Golden Ocean Group GOGL is preparing to release its quarterly earnings on Wednesday, 2024-11-27. Here's a brief overview of what investors should keep in mind before the announcement.
Analysts expect Golden Ocean Group to report an earnings per share (EPS) of $0.33.
Investors in Golden Ocean Group are eagerly awaiting the company's announcement, hoping for news of surpassing estimates and positive guidance for the next quarter.
It's worth noting for new investors that stock prices can be heavily influenced by future projections rather than just past performance.
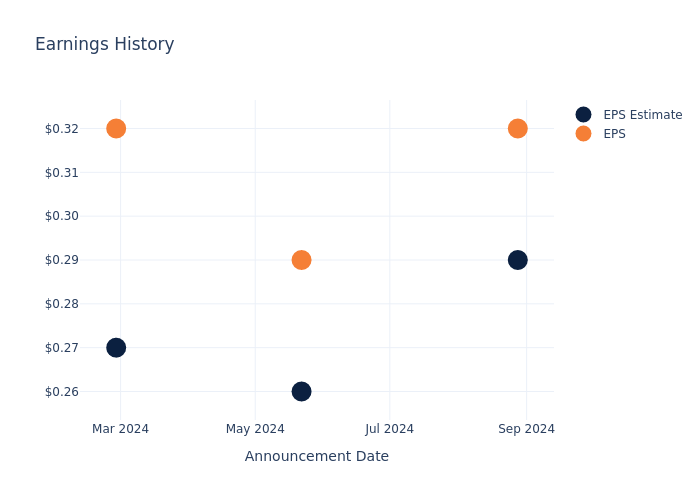
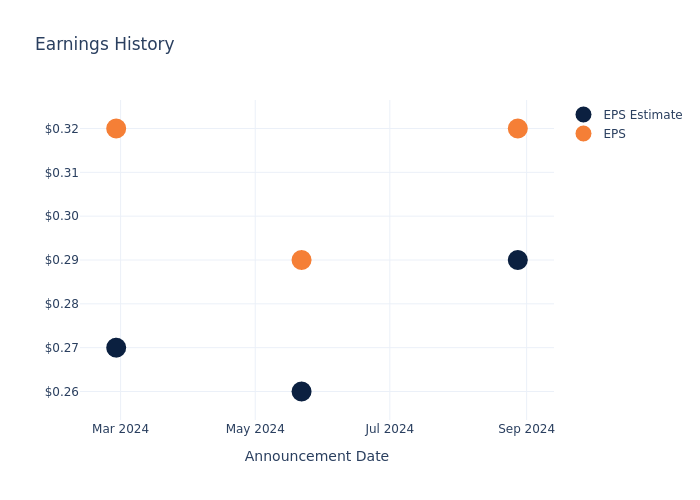
Earnings History Snapshot
Last quarter the company beat EPS by $0.03, which was followed by a 2.23% increase in the share price the next day.
Here's a look at Golden Ocean Group's past performance and the resulting price change:
| Quarter | Q2 2024 | Q1 2024 | Q4 2023 | Q3 2023 |
|---|---|---|---|---|
| EPS Estimate | 0.29 | 0.26 | 0.27 | 0.11 |
| EPS Actual | 0.32 | 0.29 | 0.32 | 0.14 |
| Price Change % | 2.0% | -1.0% | 1.0% | -0.0% |

Performance of Golden Ocean Group Shares
Shares of Golden Ocean Group were trading at $11.08 as of November 25. Over the last 52-week period, shares are up 19.53%. Given that these returns are generally positive, long-term shareholders are likely bullish going into this earnings release.
Analyst Opinions on Golden Ocean Group
For investors, grasping market sentiments and expectations in the industry is vital. This analysis explores the latest insights regarding Golden Ocean Group.
A total of 2 analyst ratings have been received for Golden Ocean Group, with the consensus rating being Neutral. The average one-year price target stands at $13.5, suggesting a potential 21.84% upside.
Comparing Ratings with Peers
The analysis below examines the analyst ratings and average 1-year price targets of Star Bulk Carriers, Costamare and Danaos, three significant industry players, providing valuable insights into their relative performance expectations and market positioning.
- Analysts currently favor an Buy trajectory for Star Bulk Carriers, with an average 1-year price target of $25.0, suggesting a potential 125.63% upside.
- The consensus outlook from analysts is an Neutral trajectory for Costamare, with an average 1-year price target of $13.0, indicating a potential 17.33% upside.
- The consensus among analysts is an Buy trajectory for Danaos, with an average 1-year price target of $105.0, indicating a potential 847.65% upside.
Summary of Peers Analysis
The peer analysis summary offers a detailed examination of key metrics for Star Bulk Carriers, Costamare and Danaos, providing valuable insights into their respective standings within the industry and their market positions and comparative performance.
| Company | Consensus | Revenue Growth | Gross Profit | Return on Equity |
|---|---|---|---|---|
| Golden Ocean Group | Neutral | 17.20% | $91.01M | 3.24% |
| Star Bulk Carriers | Buy | 54.32% | $113.84M | 3.27% |
| Costamare | Neutral | 36.03% | $124.19M | 3.06% |
| Danaos | Buy | 7.09% | $150.59M | 3.69% |
Key Takeaway:
Golden Ocean Group ranks at the bottom for Revenue Growth among its peers. In terms of Gross Profit, it is also at the bottom. However, for Return on Equity, it is in the middle compared to its peers.
Unveiling the Story Behind Golden Ocean Group
Golden Ocean Group Ltd is a Bermuda-based dry bulk shipping company. Its business involves the transportation of dry bulk cargo including ores, coal, grains and fertilizers through its fleet of owned and chartered vessels, bareboat vessels, commercial management vessels and new buildings are chartered-out on fixed rate time charters and index-linked time charter contracts.
Unraveling the Financial Story of Golden Ocean Group
Market Capitalization Analysis: Above industry benchmarks, the company's market capitalization emphasizes a noteworthy size, indicative of a strong market presence.
Revenue Growth: Golden Ocean Group's remarkable performance in 3 months is evident. As of 30 June, 2024, the company achieved an impressive revenue growth rate of 17.2%. This signifies a substantial increase in the company's top-line earnings. As compared to its peers, the revenue growth lags behind its industry peers. The company achieved a growth rate lower than the average among peers in Industrials sector.
Net Margin: Golden Ocean Group's net margin excels beyond industry benchmarks, reaching 24.99%. This signifies efficient cost management and strong financial health.
Return on Equity (ROE): Golden Ocean Group's financial strength is reflected in its exceptional ROE, which exceeds industry averages. With a remarkable ROE of 3.24%, the company showcases efficient use of equity capital and strong financial health.
Return on Assets (ROA): Golden Ocean Group's ROA excels beyond industry benchmarks, reaching 1.79%. This signifies efficient management of assets and strong financial health.
Debt Management: Golden Ocean Group's debt-to-equity ratio is below the industry average at 0.74, reflecting a lower dependency on debt financing and a more conservative financial approach.
To track all earnings releases for Golden Ocean Group visit their earnings calendar on our site.
This article was generated by Benzinga's automated content engine and reviewed by an editor.
© 2024 Benzinga.com. Benzinga does not provide investment advice. All rights reserved.


