Investors with a lot of money to spend have taken a bullish stance on General Motors GM.
And retail traders should know.
We noticed this today when the trades showed up on publicly available options history that we track here at Benzinga.
Whether these are institutions or just wealthy individuals, we don't know. But when something this big happens with GM, it often means somebody knows something is about to happen.
So how do we know what these investors just did?
Today, Benzinga's options scanner spotted 66 uncommon options trades for General Motors.
This isn't normal.
The overall sentiment of these big-money traders is split between 40% bullish and 39%, bearish.
Out of all of the special options we uncovered, 40 are puts, for a total amount of $2,717,669, and 26 are calls, for a total amount of $2,043,567.
What's The Price Target?
Taking into account the Volume and Open Interest on these contracts, it appears that whales have been targeting a price range from $35.0 to $80.0 for General Motors over the last 3 months.
Volume & Open Interest Trends
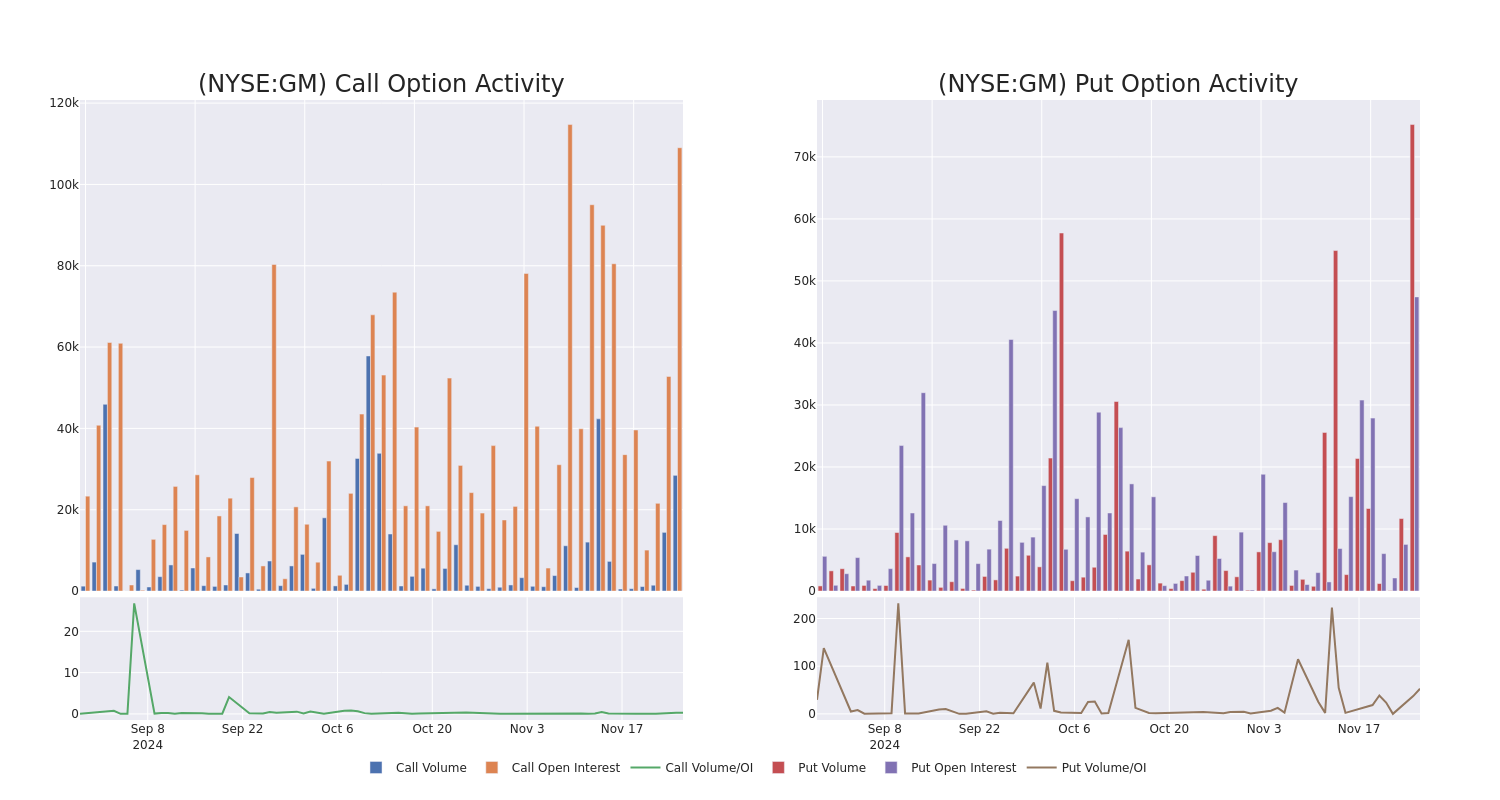
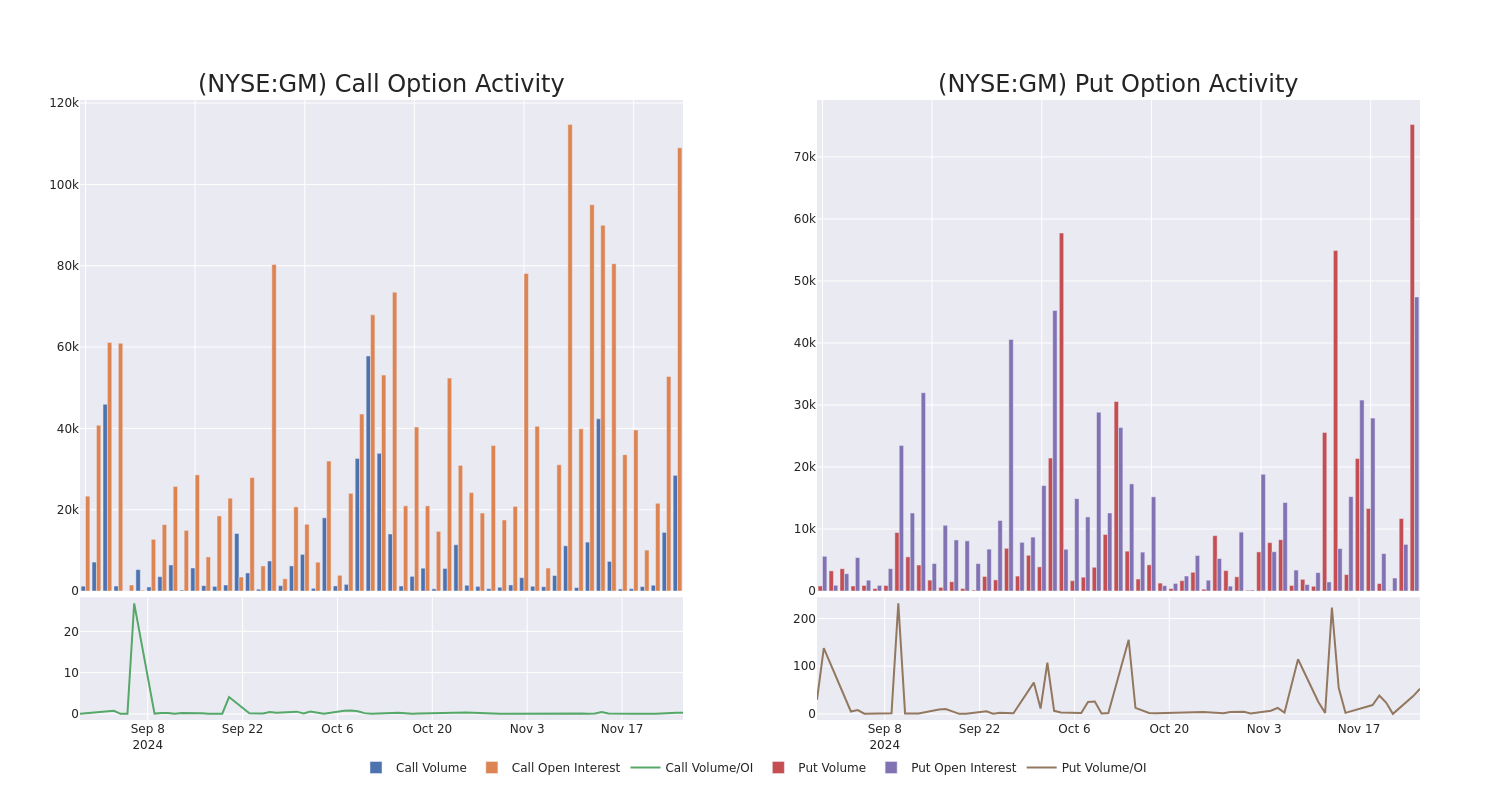
Looking at the volume and open interest is a powerful move while trading options. This data can help you track the liquidity and interest for General Motors's options for a given strike price. Below, we can observe the evolution of the volume and open interest of calls and puts, respectively, for all of General Motors's whale trades within a strike price range from $35.0 to $80.0 in the last 30 days.
General Motors Option Volume And Open Interest Over Last 30 Days

Largest Options Trades Observed:
| Symbol | PUT/CALL | Trade Type | Sentiment | Exp. Date | Ask | Bid | Price | Strike Price | Total Trade Price | Open Interest | Volume |
|---|---|---|---|---|---|---|---|---|---|---|---|
| GM | CALL | SWEEP | BULLISH | 01/16/26 | $6.25 | $6.0 | $6.0 | $62.50 | $600.0K | 106 | 1.0K |
| GM | PUT | SWEEP | BEARISH | 03/21/25 | $5.1 | $5.0 | $5.05 | $57.50 | $290.8K | 2.9K | 607 |
| GM | CALL | TRADE | BULLISH | 01/15/27 | $4.45 | $4.2 | $4.45 | $80.00 | $268.3K | 2.3K | 1.3K |
| GM | PUT | SWEEP | BEARISH | 11/29/24 | $2.71 | $2.63 | $2.63 | $58.00 | $131.6K | 1.6K | 1.0K |
| GM | PUT | SWEEP | BULLISH | 03/21/25 | $3.45 | $3.4 | $3.4 | $55.00 | $121.7K | 8.8K | 3.2K |
About General Motors
General Motors Co. emerged from the bankruptcy of General Motors Corp. (old GM) in July 2009. GM has eight brands and operates under four segments: GM North America, GM International, Cruise, and GM Financial. The United States now has four brands instead of eight under old GM. The company regained its us market share leader crown in 2022, after losing it to Toyota due to the chip shortage in 2021. 2023's share was 16.5%. GM's Cruise autonomous vehicle arm has previously done driverless geofenced AV robotaxi services in San Francisco and other cities but stopped in late 2023 after an accident. It restarted service in 2024 but not in California. GM owns over 80% of Cruise. GM Financial became the company's captive finance arm in October 2010 via the purchase of AmeriCredit.
Present Market Standing of General Motors
- With a volume of 15,241,874, the price of GM is down -8.07% at $55.34.
- RSI indicators hint that the underlying stock may be approaching overbought.
- Next earnings are expected to be released in 63 days.
Unusual Options Activity Detected: Smart Money on the Move
Benzinga Edge's Unusual Options board spots potential market movers before they happen. See what positions big money is taking on your favorite stocks. Click here for access.
Options are a riskier asset compared to just trading the stock, but they have higher profit potential. Serious options traders manage this risk by educating themselves daily, scaling in and out of trades, following more than one indicator, and following the markets closely.
If you want to stay updated on the latest options trades for General Motors, Benzinga Pro gives you real-time options trades alerts.
© 2024 Benzinga.com. Benzinga does not provide investment advice. All rights reserved.


