It’s been a wild ride for long-term Treasury ETFs lately, and it's looking like they might have hit a rough patch. Following months of declining interest rates, yields on U.S. Treasurys reversed course in October, and the charts are now flashing a warning: the dreaded Death Cross is looming.
For those who aren’t familiar, the Death Cross occurs when the short-term moving average (such as the 50-day) crosses below the long-term moving average (like the 200-day).
And that's exactly what's been happening for a trio of heavy hitters in the bond market: iShares 20+ Year Treasury Bond ETF TLT, Vanguard Long-Term Treasury ETF VGLT, and US Treasury 30 Year Bond ETF UTHY.
The recent surge in long-end yields, after months of decline, has turned this segment of the market into a hotbed of concern. The 10-year U.S. Treasury note yield, which fell to a low of 3.63% in September, jumped more than 0.80% as the Federal Reserve cut the federal funds target rate in September and November.
Read Also: Viking Therapeutics Stock On Brink Of Death Cross As Weight Loss Hype Loses Momentum
The result? A sharp inverse reaction in Treasury bond prices, and unfortunately, for these ETFs, that's a price decline.
Let's break it down:
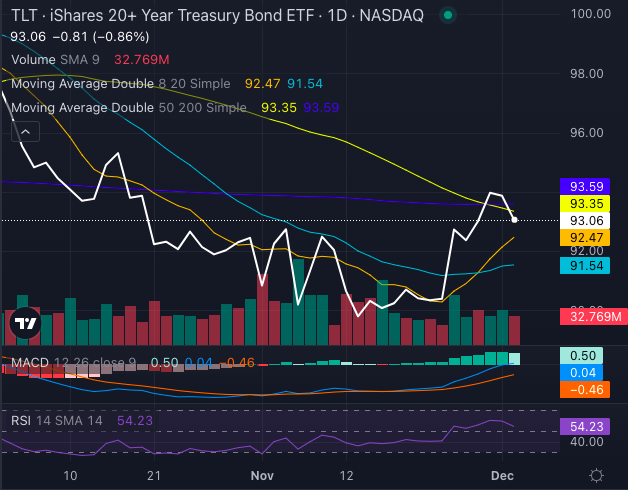
- iShares 20+ Year Treasury Bond ETF: Once a star of the bond world, this ETF now has its 50-day simple moving average below its 200-day. And while it’s seeing a bit of buying pressure, the bearish signals on the chart indicate a downward trend that could be setting up. With a stock price at $93.06 and RSI at 54.23, things aren’t looking rosy for this long-duration bond fund.

Chart created using Benzinga Pro
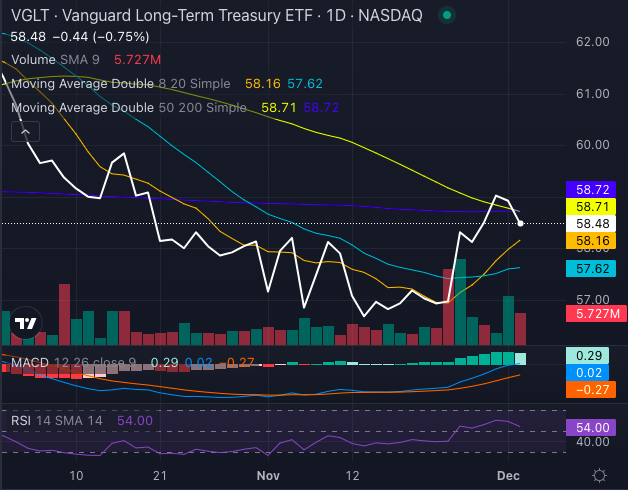
- Vanguard Long-Term Treasury ETF: This ETF is in the same boat, with its 50-day moving average below the 200-day. It has a similar chart pattern to iShares 20+ Year Treasury Bond ETF and shows potential for future bearish movement as the market contemplates further interest rate hikes. At $58.48 and an RSI of 54, it's hard to argue against the bearish signals forming.

Chart created using Benzinga Pro
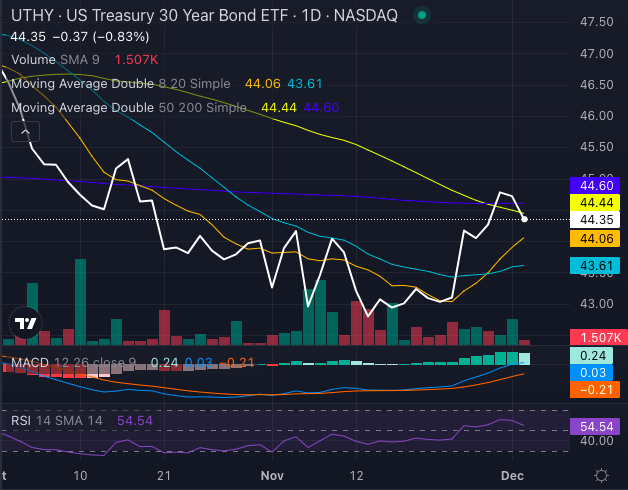
- U.S. Treasury 30 Year Bond ETF: Last but not least, this ETF is also struggling to hold onto its gains. Its price at $44.35 isn't enough to offset the pressure from the moving averages. Although the short-term outlook has some bullish signs, the 50-day SMA crossing below the 200-day indicates a tough road ahead.

Chart created using Benzinga Pro
With a surge in long-term Treasury yields, it's clear that the long bond party might be winding down. Investors betting on these ETFs are facing an uphill battle, and a higher interest rate environment seems to be taking its toll.
For those holding these three ETFs, it might be time to re-evaluate your exposure to these long-duration bonds before the Death Cross turns into a market-wide plunge.
Read Next:
Photo: Shutterstock
© 2024 Benzinga.com. Benzinga does not provide investment advice. All rights reserved.


