Insmed's Options: A Look at What the Big Money is Thinking
Financial giants have made a conspicuous bearish move on Insmed. Our analysis of options history for Insmed INSM revealed 13 unusual trades.
Delving into the details, we found 7% of traders were bullish, while 76% showed bearish tendencies. Out of all the trades we spotted, 10 were puts, with a value of $855,036, and 3 were calls, valued at $419,310.
Expected Price Movements
Based on the trading activity, it appears that the significant investors are aiming for a price territory stretching from $62.5 to $85.0 for Insmed over the recent three months.
Analyzing Volume & Open Interest
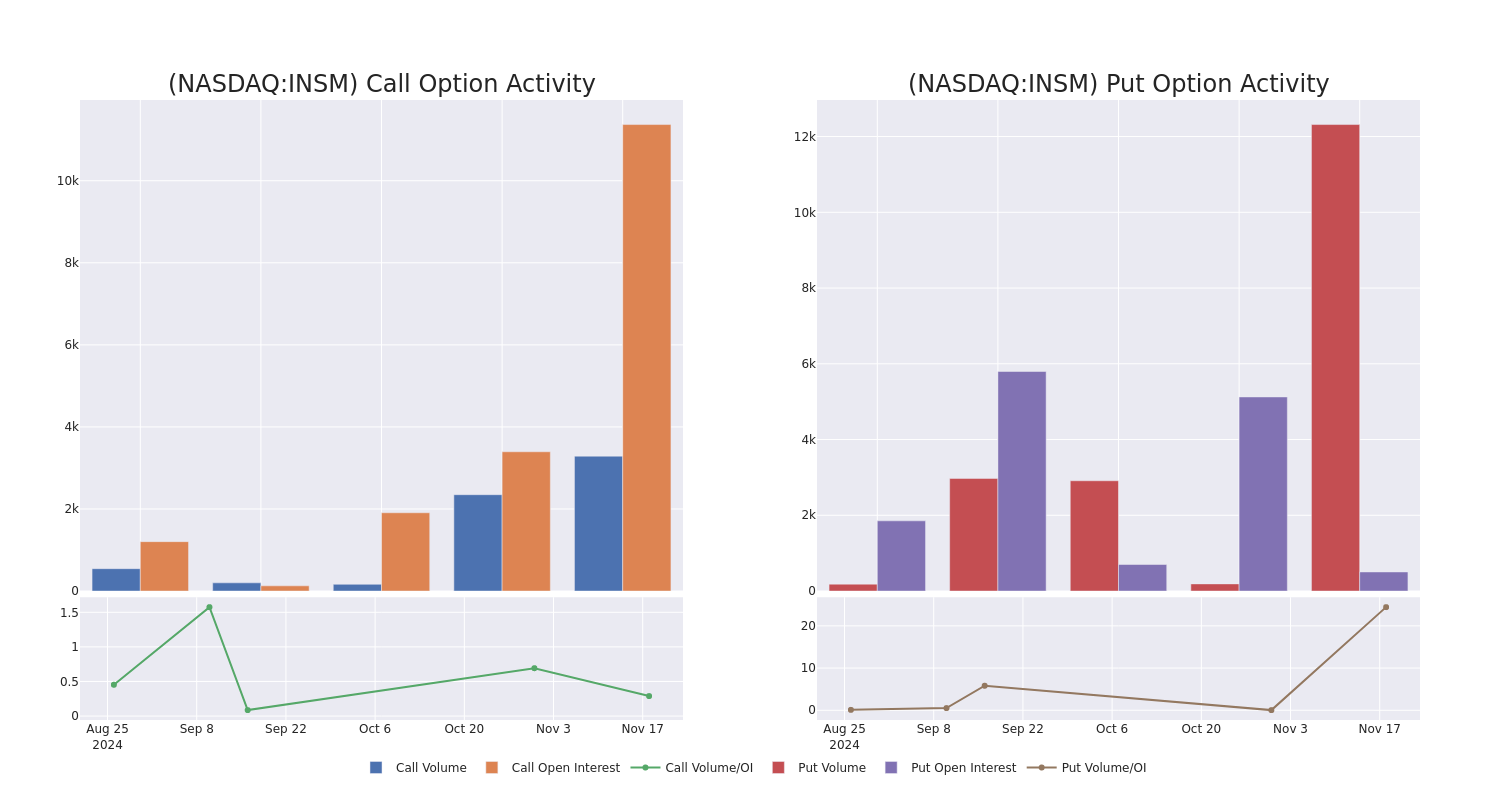
In today’s trading context, the average open interest for options of Insmed stands at 2968.25, with a total volume reaching 15,604.00. The accompanying chart delineates the progression of both call and put option volume and open interest for high-value trades in Insmed, situated within the strike price corridor from $62.5 to $85.0, throughout the last 30 days.
Insmed Option Volume And Open Interest Over Last 30 Days
Biggest Options Spotted:
| Symbol | PUT/CALL | Trade Type | Sentiment | Exp. Date | Ask | Bid | Price | Strike Price | Total Trade Price | Open Interest | Volume |
|---|---|---|---|---|---|---|---|---|---|---|---|
| INSM | CALL | TRADE | BULLISH | 01/17/25 | $1.2 | $0.75 | $1.2 | $85.00 | $360.0K | 7.1K | 3.0K |
| INSM | PUT | SWEEP | BEARISH | 01/17/25 | $4.1 | $3.8 | $4.06 | $62.50 | $150.3K | 504 | 2.3K |
| INSM | PUT | SWEEP | BEARISH | 01/17/25 | $4.5 | $3.4 | $3.9 | $62.50 | $142.3K | 504 | 365 |
| INSM | PUT | SWEEP | BEARISH | 01/17/25 | $4.0 | $3.7 | $4.0 | $62.50 | $138.4K | 504 | 1.5K |
| INSM | PUT | SWEEP | BEARISH | 01/17/25 | $4.0 | $3.7 | $4.0 | $62.50 | $123.2K | 504 | 746 |
About Insmed
Insmed Inc is a global biopharmaceutical company transforming the lives of patients with serious and rare diseases. The company’s first commercial product is ARIKAYCE (amikacin liposome inhalation suspension), approved in the US for the treatment of Mycobacterium Avium Complex (MAC) lung disease as part of a combination antibacterial drug regimen for adult patients with limited or no alternative treatment options. The company’s earlier-stage clinical pipeline includes Brensocatib, a novel oral reversible inhibitor of dipeptidyl peptidase 1 with therapeutic potential in non-cystic fibrosis bronchiectasis and other inflammatory diseases; and INS1009, an inhaled formulation of a treprostinil prodrug that may offer a differentiated product profile for pulmonary arterial hypertension.
After a thorough review of the options trading surrounding Insmed, we move to examine the company in more detail. This includes an assessment of its current market status and performance.
Where Is Insmed Standing Right Now?
- With a trading volume of 891,951, the price of INSM is down by -0.03%, reaching $66.27.
- Current RSI values indicate that the stock is may be approaching oversold.
- Next earnings report is scheduled for 94 days from now.
Professional Analyst Ratings for Insmed
2 market experts have recently issued ratings for this stock, with a consensus target price of $97.5.
Unusual Options Activity Detected: Smart Money on the Move
Benzinga Edge’s Unusual Options board spots potential market movers before they happen. See what positions big money is taking on your favorite stocks. Click here for access.
* In a cautious move, an analyst from Truist Securities downgraded its rating to Buy, setting a price target of $105.
* Reflecting concerns, an analyst from HC Wainwright & Co. lowers its rating to Buy with a new price target of $90.
Options trading presents higher risks and potential rewards. Astute traders manage these risks by continually educating themselves, adapting their strategies, monitoring multiple indicators, and keeping a close eye on market movements. Stay informed about the latest Insmed options trades with real-time alerts from Benzinga Pro.
Market News and Data brought to you by Benzinga APIs
© 2024 Benzinga.com. Benzinga does not provide investment advice. All rights reserved.
My Trump trade went bust — with a consolation prize
I bet against Donald Trump, and lost. I got ahead, anyway.
In the final days of the 2024 US election, the “Trump trade” was getting woolly. Investors who thought Trump would win or lose the presidential race were betting for or against the impact his economic policies might have. New tariffs on imports might be bad for shippers and good for domestic producers. Tax cuts could generate larger deficits and higher interest rates. Deregulation could yield more corporate mergers.
The most direct Trump trade was a bet on the shares of Trump’s own company, Trump Media & Technology Group, known by its ticker symbol DJT. A Trump win could boost the fortunes of the flagging Truth Social network, while a Trump loss could doom the money-losing venture. The stock price was yo-yoing based on every hint that Trump was up or down in the polls.
I decided to sample the action. I wanted to place an options trade on DJT, because that’s the way many other Trump traders were playing it. I’m a plain vanilla investor, so I asked Eric Hale, founder and CEO of Trader Oasis, to guide me through an options trade. I didn’t know if Trump would win or lose, but I thought shares of DJT, which had been trading around $50, were seriously overpriced. The company was a social media pipsqueak with barely any revenue, yet the stock price gave it a market value of $8 billion. That seemed way too high under any election outcome.
I bought a put contract with a strike price of $25, which meant I could sell 100 shares at a profit if the price fell below $25 before my contract expired on Nov. 15. The contract cost $3.90 per share for 100 shares, so $390 in total. I’d make a profit of about $1,110 if the price dropped to $10, and $2,500 if it went to 0. If the price never fell below $25 by Nov. 15, I’d be out the full $390.
For a few days, it looked promising. The stock closed at $40 the day I bought my put. It fell to nearly $30 the following day, which pushed the market value of the put higher than what I paid for it. I could have closed the trade then for a small profit. But I wanted to go the distance.
Trump won, of course, which should have demolished my Trump trade. But instead of soaring after Trump’s win — which was the expectation trading action had been signaling — the stock languished. There was a brief uptick once the election outcome was clear, but then the stock fell to $30, then $27. A couple of bucks lower and I’d get back at least get some of my money.
Drop Rick Newman a note, follow him on Twitter, or sign up for his newsletter.
On Nov. 15, the day my put expired, the stock crawled back to about $28. I was out of luck and my $390 was gone. It was my second failure to capitalize on an investing fad. In 2021, I tried my hand at meme stock investing by buying shares of BlackBerry. I went underwater right away and ended up losing $1,760.
Netflix stock recovers from losses after technical glitches disrupt the Jake Paul, Mike Tyson boxing match
Netflix (NFLX) shares recovered from earlier losses on Monday after the streaming giant’s highly anticipated boxing event between heavyweight champion Mike Tyson and YouTube personality Jake Paul experienced technical glitches throughout the live broadcast.
The issues have sparked concerns about the company’s ability to deliver other types of live programs, especially with the upcoming NFL Christmas Day games in just over a month.
Customers complained about buffering disruptions and streaming issues while watching the event Friday night. Downdetector, which tracks internet outages, received thousands of outage reports throughout the evening.
Netflix declined to directly comment on the glitches when asked by Yahoo Finance.
Since the start of the year, Netflix shares have surged over 70%, far outpacing the broader markets and streaming rivals, including Disney (DIS) and Comcast (CMCSA). Shares climbed more than 2% in afternoon trade on Monday.
Bandwidth issues were likely at fault: The company revealed 60 million households around the world tuned in to watch. It alluded to the technical problems in an Instagram post, saying the event “even had our buffering systems on the ropes.”
But it’s not the first time Netflix has faced technical glitches from its various live events, which have included comedy specials and reunion tapings. That’s led to investor concerns the company won’t be able to get things right in time for its NFL Christmas Day doubleheader, with the Kansas City Chiefs vs. Pittsburgh Steelers and the Baltimore Ravens vs. Houston Texans.
Multiple users on social media platforms vented their frustrations, explicitly calling out the streaming issues and disruptions throughout the night.
Still, Oppenheimer analyst Jason Helfstein shrugged off the customer complaints, writing in a note to clients on Sunday that viewing was likely twice as large as the company’s internal expectations, “a high quality problem than can be easily fixed by Christmas Day.”
Netflix inked a three-season deal with the NFL earlier this year to air the Christmas Day games, which will be produced by CBS Sports (PARA). The streamer reportedly coughed up about $75 million per game, according to the Wall Street Journal.
Late Sunday, the company announced Beyoncé as the headline performer during the Ravens vs. Texans halftime show. It will be the first time the artist will perform her Grammy-nominated album “Cowboy Cater” live.
Earnings Preview For Allot
Allot ALLT is gearing up to announce its quarterly earnings on Tuesday, 2024-11-19. Here’s a quick overview of what investors should know before the release.
Analysts are estimating that Allot will report an earnings per share (EPS) of $-0.03.
Anticipation surrounds Allot’s announcement, with investors hoping to hear about both surpassing estimates and receiving positive guidance for the next quarter.
New investors should understand that while earnings performance is important, market reactions are often driven by guidance.
Past Earnings Performance
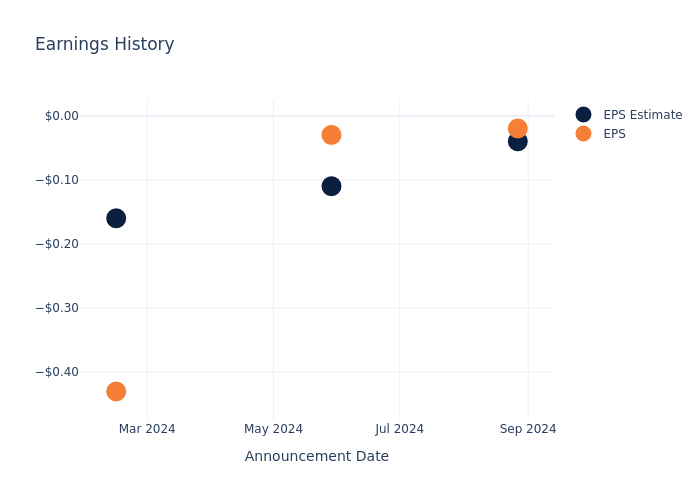
In the previous earnings release, the company beat EPS by $0.02, leading to a 0.91% drop in the share price the following trading session.
Here’s a look at Allot’s past performance and the resulting price change:
| Quarter | Q2 2024 | Q1 2024 | Q4 2023 | Q3 2023 |
|---|---|---|---|---|
| EPS Estimate | -0.04 | -0.11 | -0.16 | -0.27 |
| EPS Actual | -0.02 | -0.03 | -0.43 | -0.28 |
| Price Change % | -1.0% | -3.0% | 5.0% | 3.0% |
Market Performance of Allot’s Stock
Shares of Allot were trading at $3.49 as of November 15. Over the last 52-week period, shares are up 162.5%. Given that these returns are generally positive, long-term shareholders are likely bullish going into this earnings release.
To track all earnings releases for Allot visit their earnings calendar on our site.
This article was generated by Benzinga’s automated content engine and reviewed by an editor.
Market News and Data brought to you by Benzinga APIs
© 2024 Benzinga.com. Benzinga does not provide investment advice. All rights reserved.
Spotlight on PDD Holdings: Analyzing the Surge in Options Activity
Financial giants have made a conspicuous bullish move on PDD Holdings. Our analysis of options history for PDD Holdings PDD revealed 87 unusual trades.
Delving into the details, we found 44% of traders were bullish, while 39% showed bearish tendencies. Out of all the trades we spotted, 27 were puts, with a value of $1,964,219, and 60 were calls, valued at $8,300,647.
What’s The Price Target?
Taking into account the Volume and Open Interest on these contracts, it appears that whales have been targeting a price range from $100.0 to $230.0 for PDD Holdings over the last 3 months.
Analyzing Volume & Open Interest
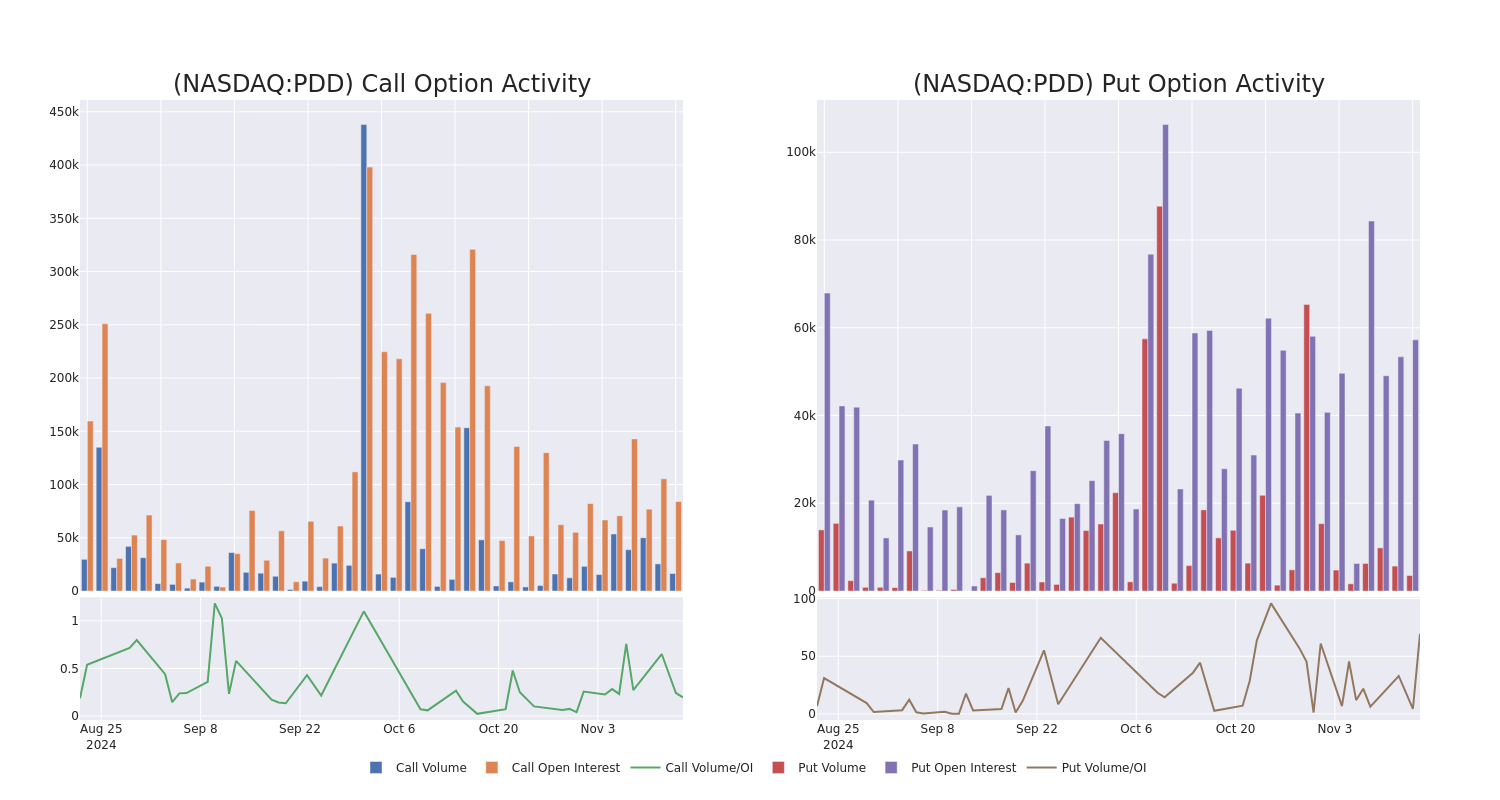
Examining the volume and open interest provides crucial insights into stock research. This information is key in gauging liquidity and interest levels for PDD Holdings’s options at certain strike prices. Below, we present a snapshot of the trends in volume and open interest for calls and puts across PDD Holdings’s significant trades, within a strike price range of $100.0 to $230.0, over the past month.
PDD Holdings Call and Put Volume: 30-Day Overview
Significant Options Trades Detected:
| Symbol | PUT/CALL | Trade Type | Sentiment | Exp. Date | Ask | Bid | Price | Strike Price | Total Trade Price | Open Interest | Volume |
|---|---|---|---|---|---|---|---|---|---|---|---|
| PDD | CALL | TRADE | BULLISH | 12/20/24 | $8.45 | $7.9 | $8.31 | $115.00 | $2.0M | 4.7K | 5.0K |
| PDD | CALL | TRADE | BEARISH | 12/20/24 | $8.15 | $8.0 | $8.0 | $115.00 | $2.0M | 4.7K | 2.5K |
| PDD | PUT | SWEEP | BULLISH | 12/13/24 | $28.05 | $27.75 | $27.8 | $144.00 | $247.4K | 0 | 139 |
| PDD | PUT | SWEEP | BULLISH | 12/20/24 | $38.7 | $38.45 | $38.45 | $155.00 | $192.2K | 1.0K | 50 |
| PDD | CALL | SWEEP | BULLISH | 12/20/24 | $6.3 | $6.2 | $6.3 | $120.00 | $184.5K | 4.2K | 654 |
About PDD Holdings
PDD Holdings is a multinational commerce group that owns and operates a portfolio of businesses. PDD aims to bring more businesses and people into the digital economy so that local communities and small businesses can benefit from the increased productivity and new opportunities. PDD has built a network of sourcing, logistics, and fulfillment capabilities that support its underlying businesses.
Following our analysis of the options activities associated with PDD Holdings, we pivot to a closer look at the company’s own performance.
Present Market Standing of PDD Holdings
- Trading volume stands at 6,199,920, with PDD’s price up by 3.47%, positioned at $117.96.
- RSI indicators show the stock to be is currently neutral between overbought and oversold.
- Earnings announcement expected in 3 days.
Turn $1000 into $1270 in just 20 days?
20-year pro options trader reveals his one-line chart technique that shows when to buy and sell. Copy his trades, which have had averaged a 27% profit every 20 days. Click here for access.
Trading options involves greater risks but also offers the potential for higher profits. Savvy traders mitigate these risks through ongoing education, strategic trade adjustments, utilizing various indicators, and staying attuned to market dynamics. Keep up with the latest options trades for PDD Holdings with Benzinga Pro for real-time alerts.
Market News and Data brought to you by Benzinga APIs
© 2024 Benzinga.com. Benzinga does not provide investment advice. All rights reserved.
Why Super Micro Computer Stock Was Soaring Today
Shares of Super Micro Computer (NASDAQ: SMCI) were surging today as investors awaited a plan from the company to stay in compliance with the Nasdaq and maintain its listing.
Following a delay in its 10-K filing, the Nasdaq told Supermicro in September that it was out of compliance with its standards and that it had two months to file the annual report or submit a plan to get back in compliance.
Start Your Mornings Smarter! Wake up with Breakfast news in your inbox every market day. Sign Up For Free »
That deadline is expiring today, but investors were optimistic that it would submit a plan after Barron’s reported on Friday that it was on track to do so. As of 2:13 p.m. ET, the stock was up 23.4% on the news, though it had not yet submitted a plan.
At this point, today’s jump is just one small chapter in the larger drama around Supermicro, as the stock is still 60% from its peak before Hindenburg Research released a short report on the company, accusing it of accounting problems, which preceded its delay in filing its 10-K report.
In that context, it’s hard to see today’s gains as a real positive development for the company, at least until we see what the compliance plan includes.
In its preliminary third-quarter earnings report, the company also its special committee would release a report on remedial measures to improve its internal governance, by the end of last week, which it has not yet done.
Regardless of what is in the compliance plan, Supermicro still has a lot of work to do, as it must find an auditor, as well as file its 10-K and now its 10-Q for the first quarter, which it just said would be late.
The stock could recover, but investors shouldn’t mistake the stock’s rebound today and Friday for a meaningful turning point in this saga. Nothing’s changed yet with the company’s underlying financial reporting challenges. Until it does, the stock is best avoided.
Before you buy stock in Super Micro Computer, consider this:
The Motley Fool Stock Advisor analyst team just identified what they believe are the 10 best stocks for investors to buy now… and Super Micro Computer wasn’t one of them. The 10 stocks that made the cut could produce monster returns in the coming years.
Consider when Nvidia made this list on April 15, 2005… if you invested $1,000 at the time of our recommendation, you’d have $870,068!*
Stock Advisor provides investors with an easy-to-follow blueprint for success, including guidance on building a portfolio, regular updates from analysts, and two new stock picks each month. The Stock Advisor service has more than quadrupled the return of S&P 500 since 2002*.
A Peek at Powell Industries's Future Earnings
Powell Industries POWL is preparing to release its quarterly earnings on Tuesday, 2024-11-19. Here’s a brief overview of what investors should keep in mind before the announcement.
Analysts expect Powell Industries to report an earnings per share (EPS) of $3.55.
Powell Industries bulls will hope to hear the company announce they’ve not only beaten that estimate, but also to provide positive guidance, or forecasted growth, for the next quarter.
New investors should note that it is sometimes not an earnings beat or miss that most affects the price of a stock, but the guidance (or forecast).
Historical Earnings Performance
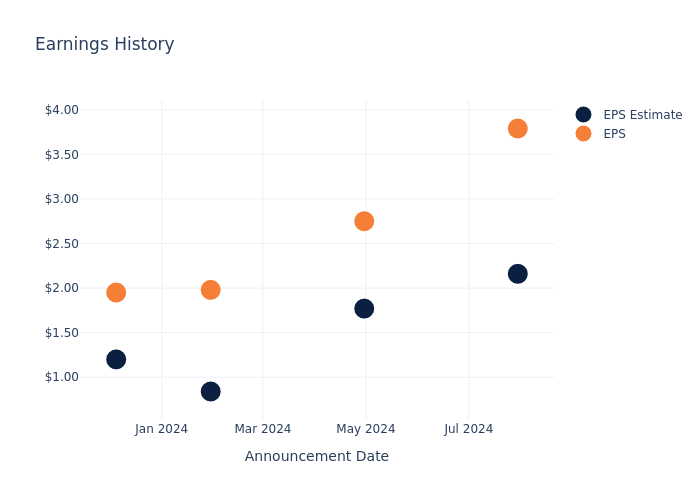
Last quarter the company beat EPS by $1.63, which was followed by a 37.81% increase in the share price the next day.
Here’s a look at Powell Industries’s past performance and the resulting price change:
| Quarter | Q3 2024 | Q2 2024 | Q1 2024 | Q4 2023 |
|---|---|---|---|---|
| EPS Estimate | 2.16 | 1.77 | 0.84 | 1.20 |
| EPS Actual | 3.79 | 2.75 | 1.98 | 1.95 |
| Price Change % | 38.0% | 19.0% | 45.0% | -6.0% |
Market Performance of Powell Industries’s Stock
Shares of Powell Industries were trading at $278.53 as of November 15. Over the last 52-week period, shares are up 253.69%. Given that these returns are generally positive, long-term shareholders are likely bullish going into this earnings release.
To track all earnings releases for Powell Industries visit their earnings calendar on our site.
This article was generated by Benzinga’s automated content engine and reviewed by an editor.
Market News and Data brought to you by Benzinga APIs
© 2024 Benzinga.com. Benzinga does not provide investment advice. All rights reserved.
Looking At Vistra's Recent Unusual Options Activity
Investors with a lot of money to spend have taken a bearish stance on Vistra VST.
And retail traders should know.
We noticed this today when the trades showed up on publicly available options history that we track here at Benzinga.
Whether these are institutions or just wealthy individuals, we don’t know. But when something this big happens with VST, it often means somebody knows something is about to happen.
So how do we know what these investors just did?
Today, Benzinga‘s options scanner spotted 66 uncommon options trades for Vistra.
This isn’t normal.
The overall sentiment of these big-money traders is split between 39% bullish and 45%, bearish.
Out of all of the special options we uncovered, 9 are puts, for a total amount of $377,116, and 57 are calls, for a total amount of $3,201,254.
Projected Price Targets
Analyzing the Volume and Open Interest in these contracts, it seems that the big players have been eyeing a price window from $65.0 to $210.0 for Vistra during the past quarter.
Volume & Open Interest Development
Looking at the volume and open interest is an insightful way to conduct due diligence on a stock.
This data can help you track the liquidity and interest for Vistra’s options for a given strike price.
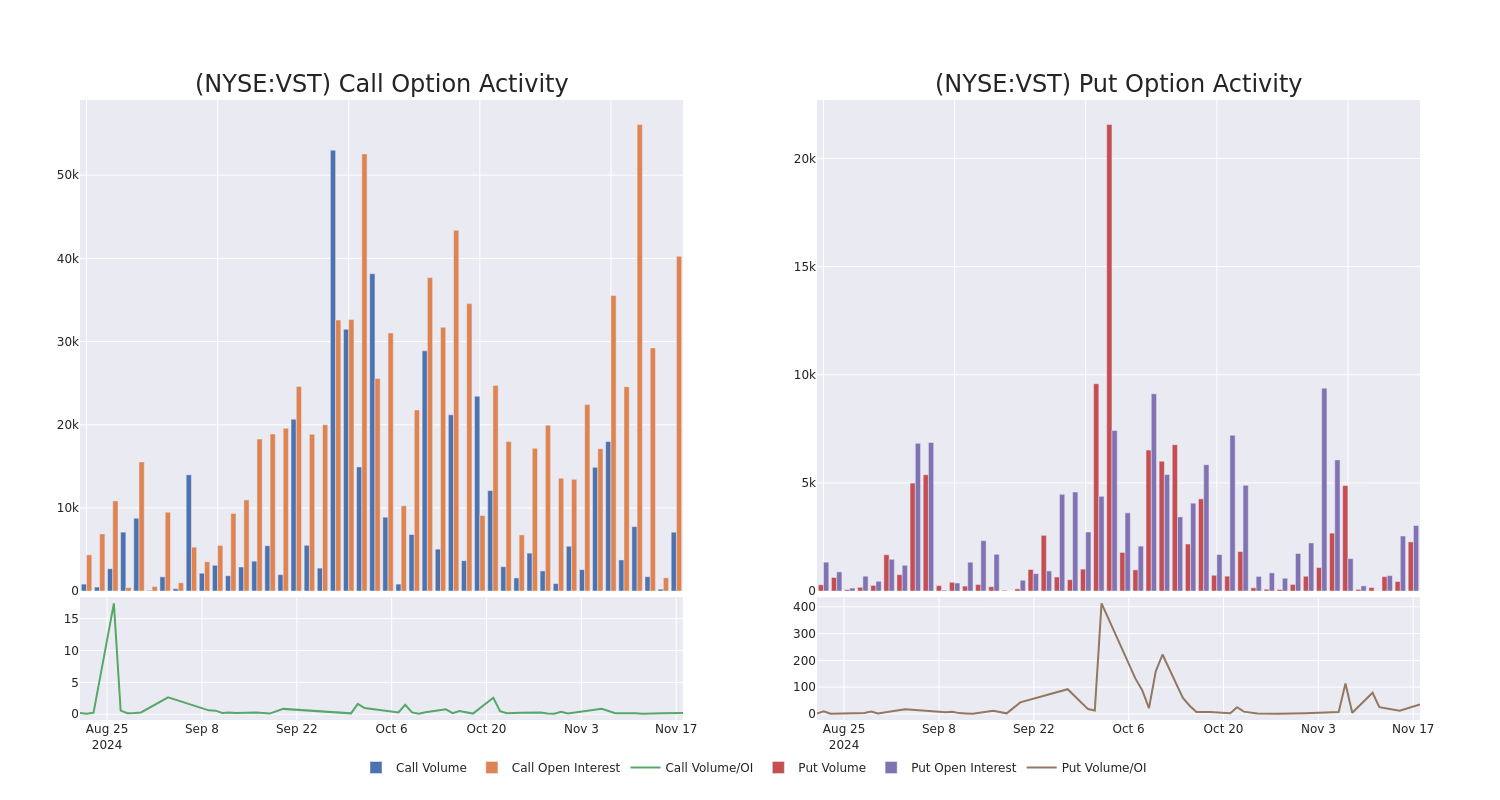
Below, we can observe the evolution of the volume and open interest of calls and puts, respectively, for all of Vistra’s whale activity within a strike price range from $65.0 to $210.0 in the last 30 days.
Vistra Option Activity Analysis: Last 30 Days
Largest Options Trades Observed:
| Symbol | PUT/CALL | Trade Type | Sentiment | Exp. Date | Ask | Bid | Price | Strike Price | Total Trade Price | Open Interest | Volume |
|---|---|---|---|---|---|---|---|---|---|---|---|
| VST | CALL | SWEEP | NEUTRAL | 12/20/24 | $11.9 | $11.4 | $11.62 | $150.00 | $348.4K | 4.3K | 247 |
| VST | CALL | TRADE | BULLISH | 04/17/25 | $41.7 | $41.1 | $41.5 | $120.00 | $166.0K | 4.3K | 100 |
| VST | CALL | SWEEP | BULLISH | 12/20/24 | $7.5 | $7.2 | $7.38 | $160.00 | $147.4K | 788 | 388 |
| VST | PUT | SWEEP | BEARISH | 01/17/25 | $5.4 | $5.2 | $5.4 | $130.00 | $108.5K | 2.3K | 1.9K |
| VST | CALL | TRADE | BEARISH | 12/20/24 | $11.7 | $11.6 | $11.6 | $145.00 | $91.6K | 1.4K | 337 |
About Vistra
Vistra Energy is one of the largest power producers and retail energy providers in the us Following the 2024 Energy Harbor acquisition, Vistra owns 41 gigawatts of nuclear, coal, natural gas, and solar power generation along with one of the largest utility-scale battery projects in the world. Its retail electricity business serves 5 million customers in 20 states, including almost a third of all Texas electricity consumers. Vistra emerged from the Energy Future Holdings bankruptcy as a stand-alone entity in 2016. It acquired Dynegy in 2018.
Following our analysis of the options activities associated with Vistra, we pivot to a closer look at the company’s own performance.
Vistra’s Current Market Status
- With a volume of 4,078,647, the price of VST is up 3.6% at $147.26.
- RSI indicators hint that the underlying stock may be approaching overbought.
- Next earnings are expected to be released in 100 days.
What The Experts Say On Vistra
Over the past month, 2 industry analysts have shared their insights on this stock, proposing an average target price of $148.5.
Unusual Options Activity Detected: Smart Money on the Move
Benzinga Edge’s Unusual Options board spots potential market movers before they happen. See what positions big money is taking on your favorite stocks. Click here for access.
* An analyst from BMO Capital has decided to maintain their Outperform rating on Vistra, which currently sits at a price target of $147.
* An analyst from UBS has decided to maintain their Buy rating on Vistra, which currently sits at a price target of $150.
Options are a riskier asset compared to just trading the stock, but they have higher profit potential. Serious options traders manage this risk by educating themselves daily, scaling in and out of trades, following more than one indicator, and following the markets closely.
If you want to stay updated on the latest options trades for Vistra, Benzinga Pro gives you real-time options trades alerts.
Market News and Data brought to you by Benzinga APIs
© 2024 Benzinga.com. Benzinga does not provide investment advice. All rights reserved.
