Looking At Vistra's Recent Unusual Options Activity
Investors with a lot of money to spend have taken a bearish stance on Vistra VST.
And retail traders should know.
We noticed this today when the trades showed up on publicly available options history that we track here at Benzinga.
Whether these are institutions or just wealthy individuals, we don’t know. But when something this big happens with VST, it often means somebody knows something is about to happen.
So how do we know what these investors just did?
Today, Benzinga‘s options scanner spotted 66 uncommon options trades for Vistra.
This isn’t normal.
The overall sentiment of these big-money traders is split between 39% bullish and 45%, bearish.
Out of all of the special options we uncovered, 9 are puts, for a total amount of $377,116, and 57 are calls, for a total amount of $3,201,254.
Projected Price Targets
Analyzing the Volume and Open Interest in these contracts, it seems that the big players have been eyeing a price window from $65.0 to $210.0 for Vistra during the past quarter.
Volume & Open Interest Development
Looking at the volume and open interest is an insightful way to conduct due diligence on a stock.
This data can help you track the liquidity and interest for Vistra’s options for a given strike price.
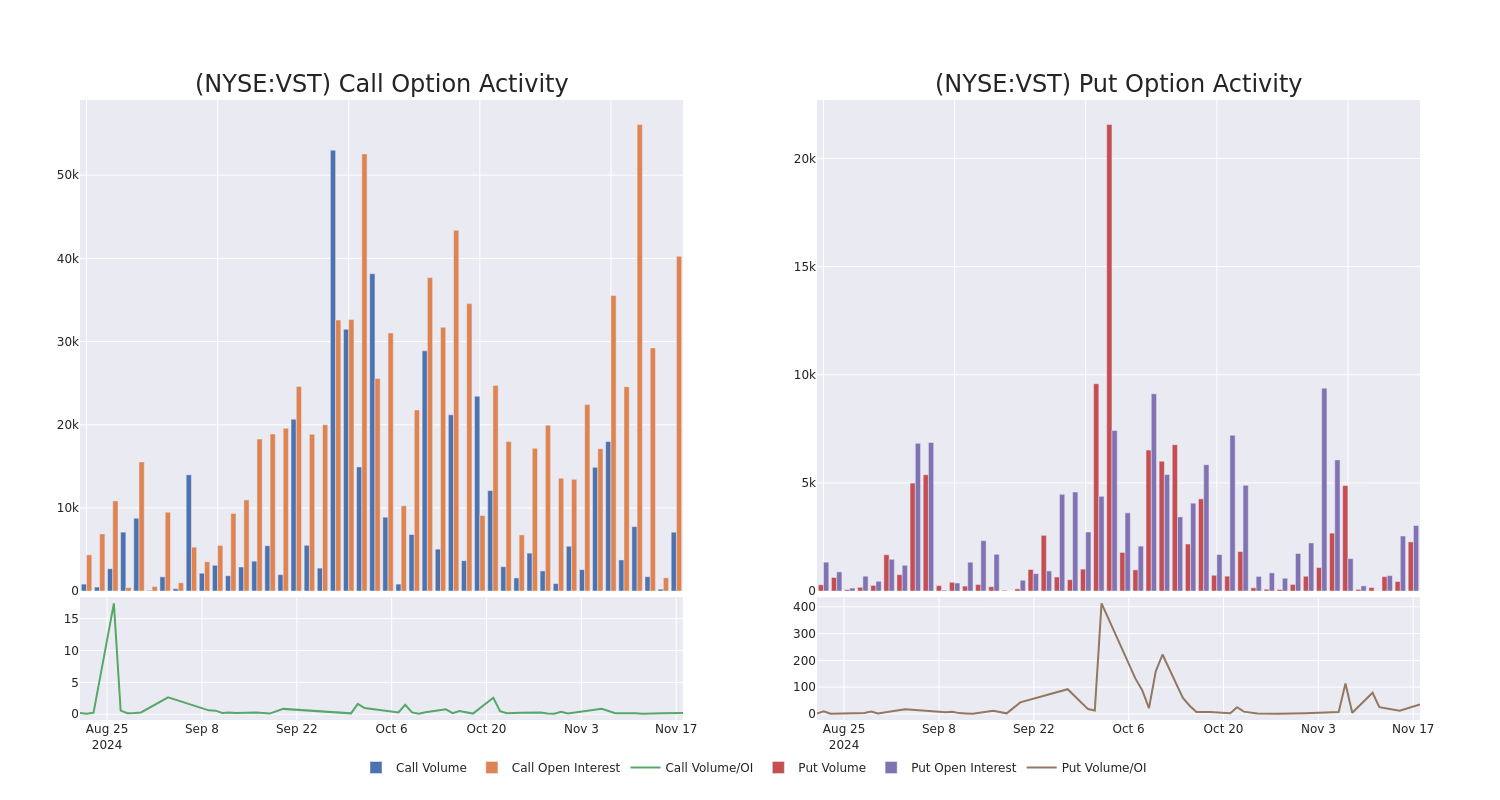
Below, we can observe the evolution of the volume and open interest of calls and puts, respectively, for all of Vistra’s whale activity within a strike price range from $65.0 to $210.0 in the last 30 days.
Vistra Option Activity Analysis: Last 30 Days
Largest Options Trades Observed:
| Symbol | PUT/CALL | Trade Type | Sentiment | Exp. Date | Ask | Bid | Price | Strike Price | Total Trade Price | Open Interest | Volume |
|---|---|---|---|---|---|---|---|---|---|---|---|
| VST | CALL | SWEEP | NEUTRAL | 12/20/24 | $11.9 | $11.4 | $11.62 | $150.00 | $348.4K | 4.3K | 247 |
| VST | CALL | TRADE | BULLISH | 04/17/25 | $41.7 | $41.1 | $41.5 | $120.00 | $166.0K | 4.3K | 100 |
| VST | CALL | SWEEP | BULLISH | 12/20/24 | $7.5 | $7.2 | $7.38 | $160.00 | $147.4K | 788 | 388 |
| VST | PUT | SWEEP | BEARISH | 01/17/25 | $5.4 | $5.2 | $5.4 | $130.00 | $108.5K | 2.3K | 1.9K |
| VST | CALL | TRADE | BEARISH | 12/20/24 | $11.7 | $11.6 | $11.6 | $145.00 | $91.6K | 1.4K | 337 |
About Vistra
Vistra Energy is one of the largest power producers and retail energy providers in the us Following the 2024 Energy Harbor acquisition, Vistra owns 41 gigawatts of nuclear, coal, natural gas, and solar power generation along with one of the largest utility-scale battery projects in the world. Its retail electricity business serves 5 million customers in 20 states, including almost a third of all Texas electricity consumers. Vistra emerged from the Energy Future Holdings bankruptcy as a stand-alone entity in 2016. It acquired Dynegy in 2018.
Following our analysis of the options activities associated with Vistra, we pivot to a closer look at the company’s own performance.
Vistra’s Current Market Status
- With a volume of 4,078,647, the price of VST is up 3.6% at $147.26.
- RSI indicators hint that the underlying stock may be approaching overbought.
- Next earnings are expected to be released in 100 days.
What The Experts Say On Vistra
Over the past month, 2 industry analysts have shared their insights on this stock, proposing an average target price of $148.5.
Unusual Options Activity Detected: Smart Money on the Move
Benzinga Edge’s Unusual Options board spots potential market movers before they happen. See what positions big money is taking on your favorite stocks. Click here for access.
* An analyst from BMO Capital has decided to maintain their Outperform rating on Vistra, which currently sits at a price target of $147.
* An analyst from UBS has decided to maintain their Buy rating on Vistra, which currently sits at a price target of $150.
Options are a riskier asset compared to just trading the stock, but they have higher profit potential. Serious options traders manage this risk by educating themselves daily, scaling in and out of trades, following more than one indicator, and following the markets closely.
If you want to stay updated on the latest options trades for Vistra, Benzinga Pro gives you real-time options trades alerts.
Market News and Data brought to you by Benzinga APIs
© 2024 Benzinga.com. Benzinga does not provide investment advice. All rights reserved.
Dave Ramsey Recalls The Day American Express Called His Wife, Asking Why Stay 'With A Man That Won't Pay His Bills.' Here's What He Did Next
Dave Ramsey is known today as a straight-talking personal finance expert. But before becoming a household name, Ramsey went through a financial crisis that turned his life upside down. It all started when he realized how deep in debt he was – and when American Express called his wife, questioning her choice to stay with a man who couldn’t pay his bills. That moment sparked a transformation that changed Dave’s life and led him to help millions of others regain control of their finances.
Don’t Miss:
In the late 1980s, Ramsey was flying high. By age 28, he had built up a $4 million real estate portfolio and was well on his way to what he thought was lasting wealth. But things came crashing down fast. Changes in banking laws led to his loans being called in and Ramsey suddenly needed to repay $1.2 million. He was forced into bankruptcy with no way to liquidate his properties quickly enough.
That was a tough pill to swallow. Ramsey recalls, “I splatted. It hurt.” The financial crash didn’t just wipe out his wealth; it made life at home tense and uncertain. To make things worse, creditors were relentless. Ramsey vividly remembers when an American Express representative called his wife, Sharon, asking why she’d “stay with a man that won’t pay his bills.” “I was a very mad redneck,” Ramsey admits and that was the moment he knew things had to change.
Trending: Studies show 50% of consumers think Financial Advisors cost much more than they do — to debunk this, this company provides matching for free and a complimentary first call with the matched advisor.
Ramsey made a decision: No more debt. Ever again. He vowed to be “the last Ramsey in this branch of the family tree in debt.” He canceled all his credit cards, swore off borrowing money and resolved to teach his children – and anyone else who would listen – how to build wealth without relying on debt. It wasn’t just about building wealth but about breaking the cycle and starting a new chapter.
Goldman Sachs To Spin Out Digital Assets Platform Amid Blockchain Push
Goldman Sachs Group Inc. NYSE: GS) is advancing its blockchain ambitions, planning to spin out its digital-assets platform into an independent company within the next 12 to 18 months.
What Happened: The platform aims to enable large financial institutions to create, trade, and settle financial instruments using blockchain technology, Bloomberg reported.
Mathew McDermott, Goldman’s global head of Digital Assets, revealed the plans, emphasizing the importance of making the platform “industry-owned” to benefit the broader market.
The move is contingent on regulatory approval.
Goldman is actively engaging with potential partners to enhance the platform’s capabilities and explore new commercial applications.
The first strategic partner, Tradeweb Markets Inc., has already joined forces with Goldman to develop use cases, marking a significant step toward the initiative’s realization.
Goldman’s spin-out plan reflects a broader trend of financial institutions leveraging blockchain to streamline the issuance, trading, and settlement of traditional assets like cash and bonds.
Blockchain technology offers a faster, more efficient alternative to conventional systems, a proposition increasingly attractive to institutional players.
Also Read: Bitcoin To $100,000 ‘Seems Around The Corner,’ Bulls Are ‘On The Right Side Of History’—Bernstein
Bitcoin’s recent surge to $93,000 has further bolstered confidence in the transformative potential of digital assets.
“Despite market volatility, we see significant long-term opportunities for blockchain and Bitcoin in institutional finance,” McDermott said.
Goldman’s optimism is evident in its investments in blockchain-backed financial products.
Earlier this year, the firm partnered with DRW Capital to allocate $600 million across spot Bitcoin and Ethereum ETFs, signaling a strong commitment to the sector’s growth.
In addition to its blockchain platform, Goldman is exploring opportunities to facilitate secondary transactions in private digital-asset companies, providing liquidity for clients like family offices while allowing buyers to capitalize on private market discounts.
The bank is also preparing to resume its Bitcoin-backed lending activities, highlighting its confidence in Bitcoin’s role as a financial instrument.
Goldman’s efforts align with renewed momentum in the crypto market following Donald Trump’s election victory.
Investors are betting on favorable digital asset policies under his administration, driving institutional interest and regulatory clarity.
These developments will be central to discussions at Benzinga’s Future of Digital Assets event on Nov. 19.
Read Next:
Photo: Shutterstock
Market News and Data brought to you by Benzinga APIs
© 2024 Benzinga.com. Benzinga does not provide investment advice. All rights reserved.
An Overview of Star Bulk Carriers's Earnings
Star Bulk Carriers SBLK is set to give its latest quarterly earnings report on Tuesday, 2024-11-19. Here’s what investors need to know before the announcement.
Analysts estimate that Star Bulk Carriers will report an earnings per share (EPS) of $0.99.
Anticipation surrounds Star Bulk Carriers’s announcement, with investors hoping to hear about both surpassing estimates and receiving positive guidance for the next quarter.
New investors should understand that while earnings performance is important, market reactions are often driven by guidance.
Historical Earnings Performance
The company’s EPS missed by $0.05 in the last quarter, leading to a 0.14% drop in the share price on the following day.
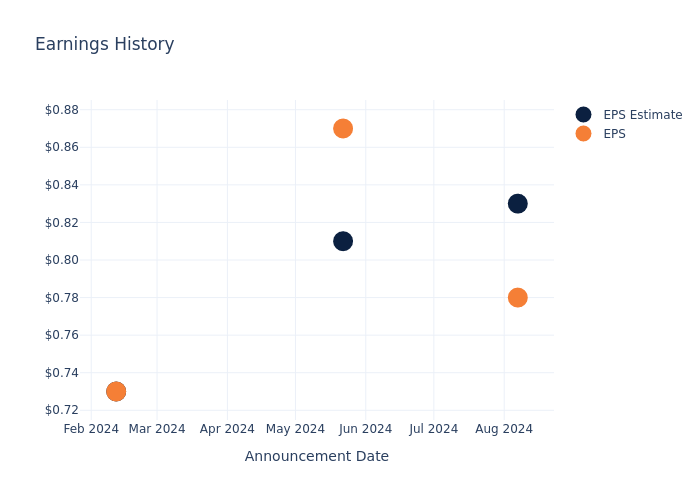
Here’s a look at Star Bulk Carriers’s past performance and the resulting price change:
| Quarter | Q2 2024 | Q1 2024 | Q4 2023 | Q3 2023 |
|---|---|---|---|---|
| EPS Estimate | 0.83 | 0.81 | 0.73 | 0.27 |
| EPS Actual | 0.78 | 0.87 | 0.73 | 0.34 |
| Price Change % | -0.0% | 2.0% | -5.0% | 2.0% |
Market Performance of Star Bulk Carriers’s Stock
Shares of Star Bulk Carriers were trading at $20.29 as of November 15. Over the last 52-week period, shares are up 3.88%. Given that these returns are generally positive, long-term shareholders should be satisfied going into this earnings release.
Analyst Insights on Star Bulk Carriers
For investors, grasping market sentiments and expectations in the industry is vital. This analysis explores the latest insights regarding Star Bulk Carriers.
With 2 analyst ratings, Star Bulk Carriers has a consensus rating of Buy. The average one-year price target is $23.5, indicating a potential 15.82% upside.
Analyzing Analyst Ratings Among Peers
In this comparison, we explore the analyst ratings and average 1-year price targets of Golden Ocean Group, Costamare and Danaos, three prominent industry players, offering insights into their relative performance expectations and market positioning.
- Golden Ocean Group is maintaining an Neutral status according to analysts, with an average 1-year price target of $14.5, indicating a potential 28.54% downside.
- Costamare received a Neutral consensus from analysts, with an average 1-year price target of $13.0, implying a potential 35.93% downside.
- Danaos is maintaining an Buy status according to analysts, with an average 1-year price target of $105.0, indicating a potential 417.5% upside.
Summary of Peers Analysis
The peer analysis summary offers a detailed examination of key metrics for Golden Ocean Group, Costamare and Danaos, providing valuable insights into their respective standings within the industry and their market positions and comparative performance.
| Company | Consensus | Revenue Growth | Gross Profit | Return on Equity |
|---|---|---|---|---|
| Star Bulk Carriers | Buy | 47.84% | $131.76M | 5.10% |
| Golden Ocean Group | Neutral | 17.20% | $91.01M | 3.24% |
| Costamare | Neutral | 36.03% | $124.19M | 3.06% |
| Danaos | Buy | 7.09% | $150.59M | 3.69% |
Key Takeaway:
Star Bulk Carriers ranks highest in Revenue Growth among its peers. It also leads in Gross Profit margin. However, it has a lower Return on Equity compared to some peers. Overall, Star Bulk Carriers is positioned favorably within the group based on these metrics.
Unveiling the Story Behind Star Bulk Carriers
Star Bulk Carriers Corp provides seaborne transportation solutions in the dry bulk sector. The company owns and operates dry bulk carrier vessels, which are used to transport bulk, such as iron ore, coal, grains, bauxite, fertilizers, and steel products. It owns a fleet of vessels that consists of Newcastlemax, Capesize, Post Panamax, Kamsarmax, Panamax, Ultramax, and Supramax. It generates revenues through the voyages it carries out.
Star Bulk Carriers: Financial Performance Dissected
Market Capitalization Analysis: With an elevated market capitalization, the company stands out above industry averages, showcasing substantial size and market acknowledgment.
Revenue Growth: Over the 3 months period, Star Bulk Carriers showcased positive performance, achieving a revenue growth rate of 47.84% as of 30 June, 2024. This reflects a substantial increase in the company’s top-line earnings. In comparison to its industry peers, the company stands out with a growth rate higher than the average among peers in the Industrials sector.
Net Margin: Star Bulk Carriers’s financial strength is reflected in its exceptional net margin, which exceeds industry averages. With a remarkable net margin of 30.06%, the company showcases strong profitability and effective cost management.
Return on Equity (ROE): Star Bulk Carriers’s ROE surpasses industry standards, highlighting the company’s exceptional financial performance. With an impressive 5.1% ROE, the company effectively utilizes shareholder equity capital.
Return on Assets (ROA): Star Bulk Carriers’s ROA excels beyond industry benchmarks, reaching 2.92%. This signifies efficient management of assets and strong financial health.
Debt Management: The company maintains a balanced debt approach with a debt-to-equity ratio below industry norms, standing at 0.66.
To track all earnings releases for Star Bulk Carriers visit their earnings calendar on our site.
This article was generated by Benzinga’s automated content engine and reviewed by an editor.
© 2024 Benzinga.com. Benzinga does not provide investment advice. All rights reserved.
This Is What Whales Are Betting On Sea
Deep-pocketed investors have adopted a bullish approach towards Sea SE, and it’s something market players shouldn’t ignore. Our tracking of public options records at Benzinga unveiled this significant move today. The identity of these investors remains unknown, but such a substantial move in SE usually suggests something big is about to happen.
We gleaned this information from our observations today when Benzinga’s options scanner highlighted 28 extraordinary options activities for Sea. This level of activity is out of the ordinary.
The general mood among these heavyweight investors is divided, with 60% leaning bullish and 39% bearish. Among these notable options, 4 are puts, totaling $329,495, and 24 are calls, amounting to $1,577,388.
What’s The Price Target?
After evaluating the trading volumes and Open Interest, it’s evident that the major market movers are focusing on a price band between $67.5 and $150.0 for Sea, spanning the last three months.
Volume & Open Interest Trends
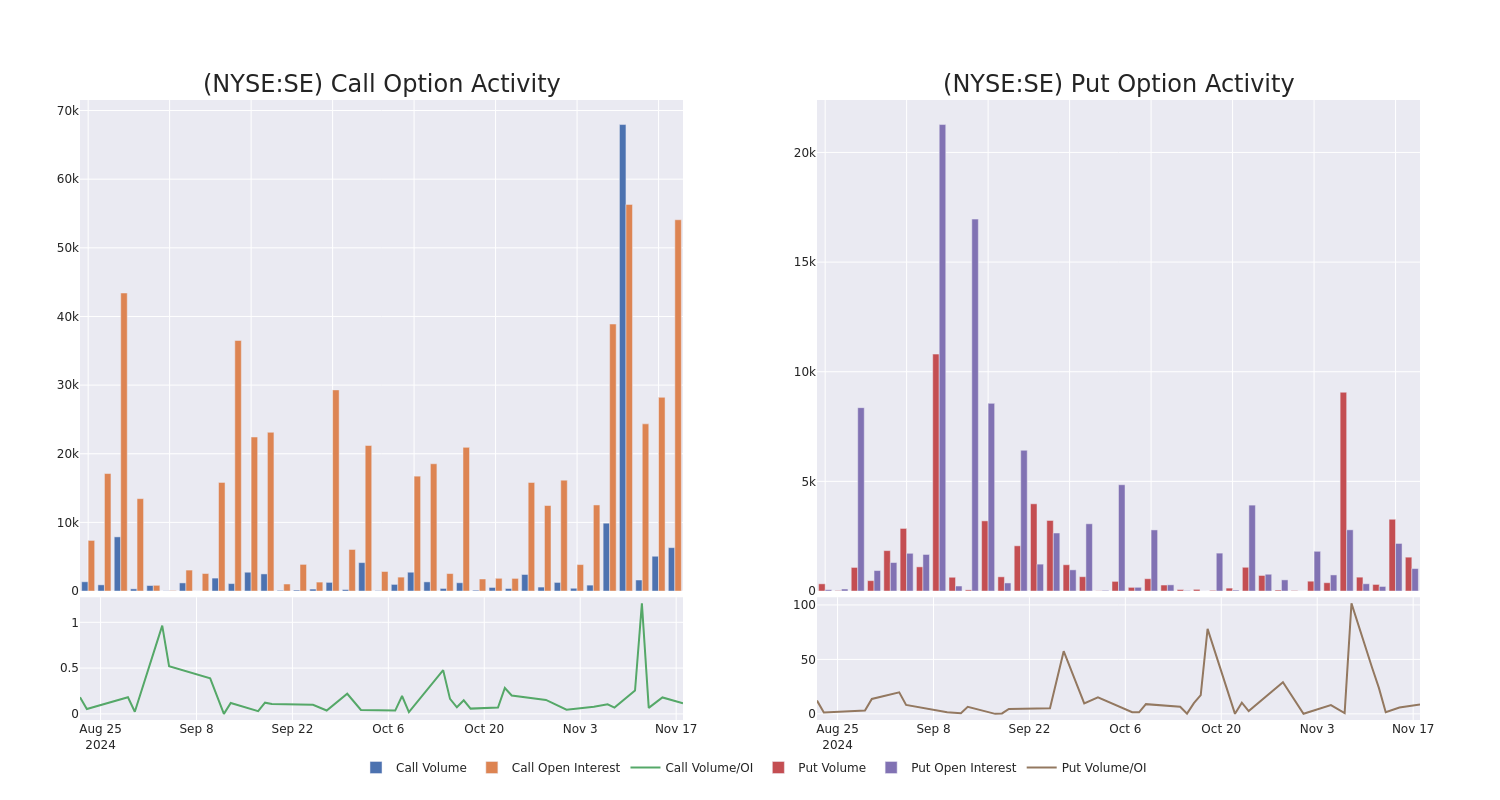
Examining the volume and open interest provides crucial insights into stock research. This information is key in gauging liquidity and interest levels for Sea’s options at certain strike prices. Below, we present a snapshot of the trends in volume and open interest for calls and puts across Sea’s significant trades, within a strike price range of $67.5 to $150.0, over the past month.
Sea Call and Put Volume: 30-Day Overview
Significant Options Trades Detected:
| Symbol | PUT/CALL | Trade Type | Sentiment | Exp. Date | Ask | Bid | Price | Strike Price | Total Trade Price | Open Interest | Volume |
|---|---|---|---|---|---|---|---|---|---|---|---|
| SE | CALL | SWEEP | BULLISH | 12/20/24 | $39.1 | $38.55 | $39.1 | $67.50 | $218.9K | 126 | 87 |
| SE | CALL | SWEEP | BULLISH | 01/17/25 | $1.43 | $1.11 | $1.43 | $125.00 | $214.6K | 4.3K | 1.5K |
| SE | CALL | TRADE | BEARISH | 01/17/25 | $5.35 | $5.25 | $5.25 | $110.00 | $105.0K | 10.8K | 335 |
| SE | PUT | SWEEP | BULLISH | 05/16/25 | $7.55 | $7.5 | $7.5 | $95.00 | $100.5K | 31 | 134 |
| SE | PUT | SWEEP | BEARISH | 01/17/25 | $4.65 | $4.6 | $4.66 | $105.00 | $100.4K | 753 | 386 |
About Sea
Sea operates Southeast Asia’s largest e-commerce company, Shopee, in terms of gross merchandise value and number of transactions. Sea started as a gaming business, Garena, but in 2015 expanded into e-commerce, which is now the main growth driver. Shopee is a hybrid C2C and B2C marketplace platform operating in eight core markets. Indonesia accounts for 35% of GMV, with the rest split mainly among Taiwan, Vietnam, Thailand, Malaysia, and the Philippines. For Garena, Free Fire was the most downloaded game in January 2022 and accounted for 74% of gaming revenue in 2021. Sea’s third business, SeaMoney, provides lending and we foresee it becoming a larger part of the entire business in the long term as its loan book has grown to $3.5 billion in 2024.
In light of the recent options history for Sea, it’s now appropriate to focus on the company itself. We aim to explore its current performance.
Present Market Standing of Sea
- Currently trading with a volume of 2,541,577, the SE’s price is up by 4.73%, now at $107.81.
- RSI readings suggest the stock is currently may be approaching overbought.
- Anticipated earnings release is in 105 days.
Professional Analyst Ratings for Sea
A total of 3 professional analysts have given their take on this stock in the last 30 days, setting an average price target of $120.33333333333333.
Turn $1000 into $1270 in just 20 days?
20-year pro options trader reveals his one-line chart technique that shows when to buy and sell. Copy his trades, which have had averaged a 27% profit every 20 days. Click here for access.
* An analyst from Benchmark persists with their Buy rating on Sea, maintaining a target price of $130.
* An analyst from Barclays persists with their Overweight rating on Sea, maintaining a target price of $131.
* An analyst from TD Cowen persists with their Hold rating on Sea, maintaining a target price of $100.
Options trading presents higher risks and potential rewards. Astute traders manage these risks by continually educating themselves, adapting their strategies, monitoring multiple indicators, and keeping a close eye on market movements. Stay informed about the latest Sea options trades with real-time alerts from Benzinga Pro.
Market News and Data brought to you by Benzinga APIs
© 2024 Benzinga.com. Benzinga does not provide investment advice. All rights reserved.
Examining the Future: Eltek's Earnings Outlook
Eltek ELTK is preparing to release its quarterly earnings on Tuesday, 2024-11-19. Here’s a brief overview of what investors should keep in mind before the announcement.
Analysts expect Eltek to report an earnings per share (EPS) of $0.31.
The announcement from Eltek is eagerly anticipated, with investors seeking news of surpassing estimates and favorable guidance for the next quarter.
It’s worth noting for new investors that guidance can be a key determinant of stock price movements.
Performance in Previous Earnings
In the previous earnings release, the company missed EPS by $0.14, leading to a 0.6% drop in the share price the following trading session.
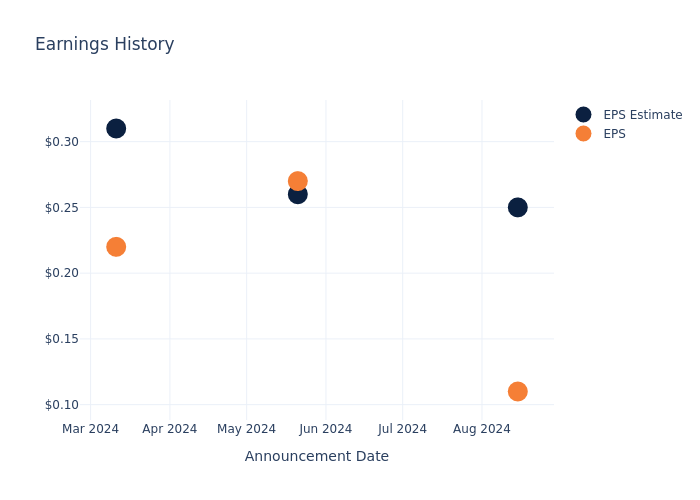
Here’s a look at Eltek’s past performance and the resulting price change:
| Quarter | Q2 2024 | Q1 2024 | Q4 2023 | Q3 2023 |
|---|---|---|---|---|
| EPS Estimate | 0.25 | 0.26 | 0.31 | 0.31 |
| EPS Actual | 0.11 | 0.27 | 0.22 | 0.36 |
| Price Change % | -1.0% | 4.0% | -0.0% | 11.0% |
Tracking Eltek’s Stock Performance
Shares of Eltek were trading at $11.01 as of November 15. Over the last 52-week period, shares are down 18.96%. Given that these returns are generally negative, long-term shareholders are likely upset going into this earnings release.
To track all earnings releases for Eltek visit their earnings calendar on our site.
This article was generated by Benzinga’s automated content engine and reviewed by an editor.
Market News and Data brought to you by Benzinga APIs
© 2024 Benzinga.com. Benzinga does not provide investment advice. All rights reserved.
Looking At Symbotic's Recent Unusual Options Activity
Deep-pocketed investors have adopted a bearish approach towards Symbotic SYM, and it’s something market players shouldn’t ignore. Our tracking of public options records at Benzinga unveiled this significant move today. The identity of these investors remains unknown, but such a substantial move in SYM usually suggests something big is about to happen.
We gleaned this information from our observations today when Benzinga’s options scanner highlighted 18 extraordinary options activities for Symbotic. This level of activity is out of the ordinary.
The general mood among these heavyweight investors is divided, with 22% leaning bullish and 72% bearish. Among these notable options, 13 are puts, totaling $746,489, and 5 are calls, amounting to $406,390.
Predicted Price Range
Taking into account the Volume and Open Interest on these contracts, it appears that whales have been targeting a price range from $27.0 to $35.0 for Symbotic over the last 3 months.
Volume & Open Interest Trends
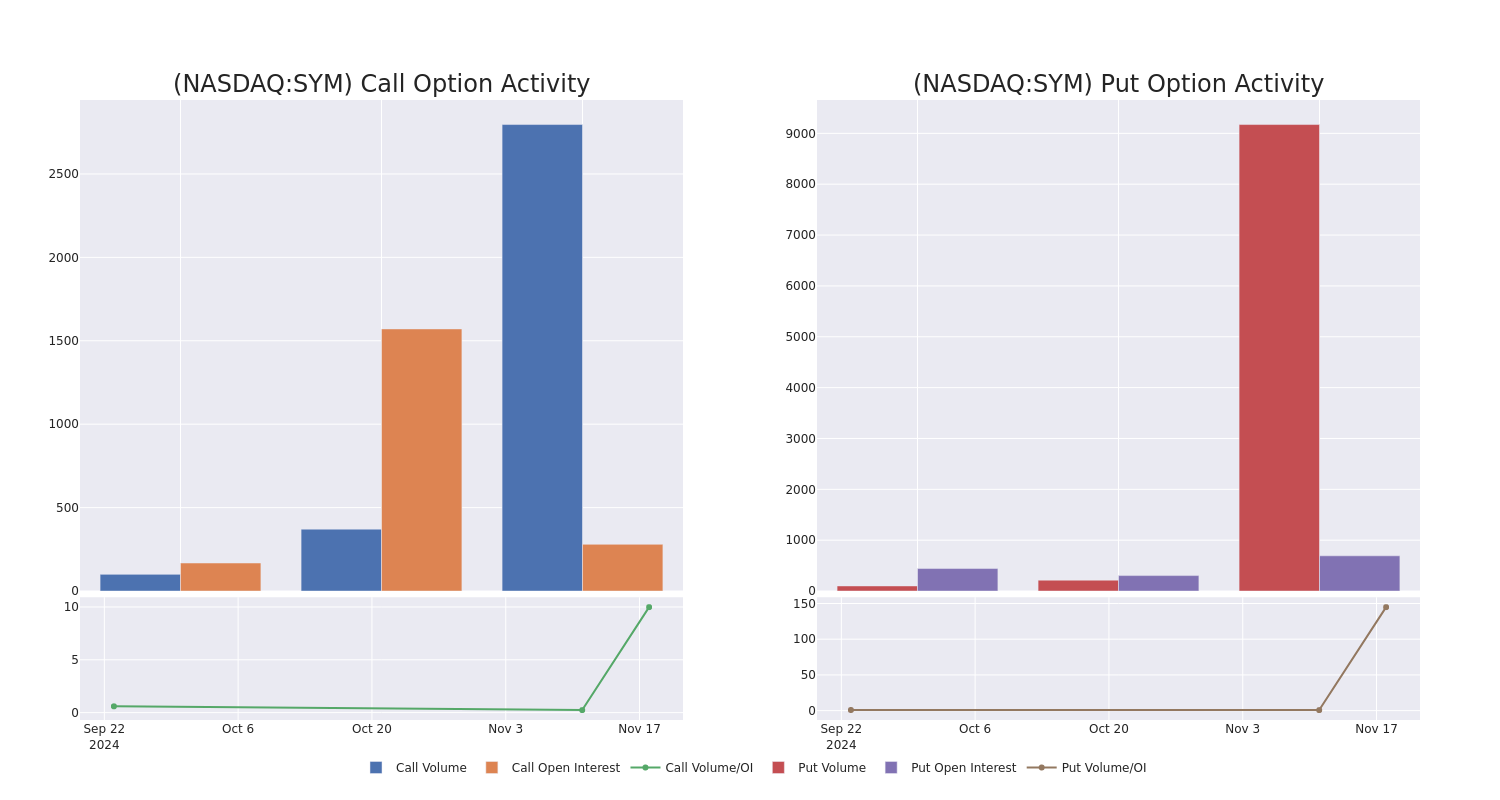
In today’s trading context, the average open interest for options of Symbotic stands at 108.11, with a total volume reaching 11,969.00. The accompanying chart delineates the progression of both call and put option volume and open interest for high-value trades in Symbotic, situated within the strike price corridor from $27.0 to $35.0, throughout the last 30 days.
Symbotic 30-Day Option Volume & Interest Snapshot
Significant Options Trades Detected:
| Symbol | PUT/CALL | Trade Type | Sentiment | Exp. Date | Ask | Bid | Price | Strike Price | Total Trade Price | Open Interest | Volume |
|---|---|---|---|---|---|---|---|---|---|---|---|
| SYM | CALL | SWEEP | BULLISH | 11/22/24 | $3.5 | $3.1 | $3.3 | $31.50 | $205.5K | 29 | 681 |
| SYM | PUT | SWEEP | BEARISH | 11/22/24 | $2.0 | $1.85 | $1.95 | $28.00 | $123.4K | 69 | 1.9K |
| SYM | PUT | TRADE | BULLISH | 11/22/24 | $1.85 | $1.8 | $1.8 | $27.00 | $101.1K | 37 | 1.0K |
| SYM | PUT | TRADE | NEUTRAL | 01/16/26 | $9.2 | $8.5 | $8.9 | $30.00 | $89.0K | 147 | 100 |
| SYM | PUT | SWEEP | BEARISH | 11/22/24 | $1.85 | $1.65 | $1.85 | $28.00 | $79.5K | 69 | 1.2K |
About Symbotic
Symbotic Inc is an automation technology company that develops technologies to improve operating efficiencies in modern warehouses. The group develops, commercializes, and deploys innovative, end-to-end technology solutions that dramatically improve supply chain operations. Symbotic also automates the processing of pallets and cases in large warehouses or distribution centers for some of the retail and wholesale companies in the world. The company operates in two geographical regions the United States and Canada. Key revenue is generated from the United States.
In light of the recent options history for Symbotic, it’s now appropriate to focus on the company itself. We aim to explore its current performance.
Symbotic’s Current Market Status
- Currently trading with a volume of 1,273,903, the SYM’s price is up by 2.41%, now at $30.2.
- RSI readings suggest the stock is currently may be approaching overbought.
- Anticipated earnings release is in 0 days.
Unusual Options Activity Detected: Smart Money on the Move
Benzinga Edge’s Unusual Options board spots potential market movers before they happen. See what positions big money is taking on your favorite stocks. Click here for access.
Options trading presents higher risks and potential rewards. Astute traders manage these risks by continually educating themselves, adapting their strategies, monitoring multiple indicators, and keeping a close eye on market movements. Stay informed about the latest Symbotic options trades with real-time alerts from Benzinga Pro.
Market News and Data brought to you by Benzinga APIs
© 2024 Benzinga.com. Benzinga does not provide investment advice. All rights reserved.
PREP Securities Solidifies Distribution Team with the Addition of Three Senior Sales Professionals
PARK CITY, Utah, Nov. 18, 2024 /PRNewswire/ — PREP Securities, LLC, the broker-dealer affiliate of PREP Property Group, announced today that the firm has added to its distribution team with the addition of several senior professionals. PREP Securities manages the selling group of third-party broker-dealer firms that raise capital for offerings sponsored by PREP Property Group.
Joining PREP Securities in October was Angela Clakley, associate vice president, internal sales for PREP’s Central and Midwest territories. Angela brings over three decades of experience in financial services, including nearly two decades specifically in the alternative investments corner of the industry with stints at Hines, Hartman and Legendary Capital. Angela is partnered with Regional Vice President Bill Auble. “We’re thrilled to welcome Angela to PREP Securities. Her extensive wholesaling experience with real estate-related products has her well prepared to hit the ground running in our Central and Midwest region,” said Tim Brennan, PREP’s head of fund management.
Arriving at PREP earlier in the year was the external/internal wholesaling team of Mark Wander, regional vice president, and Reggie Cabral, associate vice president, internal sales. Mark arrived at PREP with several decades of experience in retail securities services and wholesaling various financial products, including more than two decades in the alternative investment space focused on real estate. Reggie has more than two decades of registered experience in the financial services industry, with more than 15 years of that in real estate-related alternative investments. Mark and Reggie cover the Eastern territories for PREP.
About PREP Property Group
PREP Property Group is a vertically integrated real estate company founded by Michael C. Phillips, co-founder of Phillips Edison & Company, and built on the foundations of Phillips Edison’s strategic and net lease real estate divisions that were spun out in 2015. PREP is focused on transforming retail real estate by repositioning lifestyle centers, power centers and enclosed malls that are undermanaged, capital starved, poorly merchandised and or distressed. PREP’s Net Lease division seeks to acquire well-located, single tenant net leased retail properties from non-institutional sellers throughout the United States. The team aims to acquire a diverse mix of tenant credit, uses, and geographies including auto parts, convenience stores, pharmacies, casual dining, quick service restaurants, banks, dollar stores, and medical uses in active retail markets. PREP’s investors benefit from its fully integrated operating platform for acquisitions, dispositions, development, redevelopment, leasing and property management. The focus of PREP’s Net Lease division is to identify sites with strong real estate fundamentals and improve the leases, terms or creditworthiness creating value in the assets and the portfolio. For more information, please visit www.preppg.com.
PREP Securities, LLC is the broker-dealer affiliate of PREP Property Group. PREP Securities, member SIPC, is a broker-dealer registered with the SEC, FINRA and all states.
Related Links http://www.preppg.com/
![]() View original content to download multimedia:https://www.prnewswire.com/news-releases/prep-securities-solidifies-distribution-team-with-the-addition-of-three-senior-sales-professionals-302308893.html
View original content to download multimedia:https://www.prnewswire.com/news-releases/prep-securities-solidifies-distribution-team-with-the-addition-of-three-senior-sales-professionals-302308893.html
SOURCE PREP Securities, LLC
Market News and Data brought to you by Benzinga APIs
© 2024 Benzinga.com. Benzinga does not provide investment advice. All rights reserved.

