Nvidia Beats Q3 Revenue, EPS Estimates, Supply Constraints Ding Stock: Huang Says 'Age Of AI Is In Full Steam'
NVIDA Corporation NVDA continued its streak of beating expectations with third-quarter revenue and earnings per share coming in ahead of Street estimates Wednesday
Nvidia’s Key Q3 Numbers: Nvidia reported third-quarter revenue of $35.1 billion, up 94% year-over-year, which beat a Street consensus estimate of $33.12 billion, according to data from Benzinga Pro.
The company reported earnings per share of 81 cents, which beat Street consensus estimate of 75 cents per share.
The company has beaten analyst estimates for revenue in nine straight quarters.
The company has beaten analyst estimates for earnings per share in eight straight quarters.
Analysts and Benzinga readers predicted Nvidia would meet or exceed third-quarter expectations ahead of the report.
“What’s your boldest prediction for Nvidia’s earnings report on Wednesday?” Benzinga asked readers.
The results were:
- Meets expectations: 45%
- Blowout beat: 42%
- Misses expectations: 13%
The majority of Benzinga readers expected the company to meet or beat the estimates from analysts. While more readers expected the company to meet estimates, 42% believed the company will beat estimates Wednesday.
Read Also: Nvidia Stock Historically Drops In December After Q3 Earnings
Nvidia’s Q3 Performance By Segment: The data center business posted a quarterly record for revenue in the third quarter.
Here is a look at the revenue performance by operating business segment.
| Segment | Revenue | Year-over-Year change | Quarter-over-Quarter change |
| Data Center | $30.8 billion | +112% | +17% |
| Gaming & AI PC | $3.3 billion | +15% | +14% |
| Professional Vizualization | $486 million | +17% | +7% |
| Auto | $449 million | +72% | +30% |
“The age of AI is in full steam, propelling a global shift to NVIDIA computing,” Nvidia CEO Jensen Huang said.
“Demand for Hopper and anticipation for Blackwell — in full production — are incredible as foundation model makers scale pretraining, post-training and inference.
Huang said countries have “awakened to the importance” of AI.
“AI is transforming every industry, company and country. Enterprises are adopting agentic AI to revolutionize workflows. Industrial robotics investments are surging with breakthroughs in physical AI.”
Nvidia Q4 Outlook: Nvidia said it expects fourth-quarter revenue to be $37.5 billion plus or minus 2%.
The company said Blackwell production shipments are scheduled to begin in the fourth quarter of 2025 and will ramp into fiscal 2026. Nvidia said Hopper and Blackwell are seeing “certain supply constraints.”
Demand for Blackwell is expected to exceed supply for several quarters in fiscal 2026, the company said.
What’s Next: With the chance of an earnings beat, Benzinga recently asked readers about their expectations for the stock if Nvidia blows out earnings estimates.
“If Nvidia shatters expectations, how high could its stock go by the end of 2024?” Benzinga asked.
The results were:
- $150 to $180: 55%
- $180 to $200: 26%
- Above $200: 18%
Benzinga readers predicted the stock will hit new all-time highs if third-quarter results come in ahead of analyst estimates.
If the stock goes higher, CEO Huang would continue to benefit as one of the key shareholders of the stock. Huang’s wealth has soared to $128 billion in 2024, ranking 11th in the world according to Bloomberg.
Huang has added $84.3 billion to his wealth and is around $17 billion away from cracking the top 10 richest people in the world milestone. If shares continue to trade higher to the end of the year, this milestone could be within reach.
NVDA Price Action: Nvidia stock is down 2.7% to $141.93 in after-hours trading Wednesday versus a 52-week trading range of $45.01 to $149.76. The stock closed Wednesday down 0.8% to $145.89. Nvidia stock was up over 200% year-to-date ahead of Wednesday’s earnings report
Read Next:
Nvidia CEO Jensen Huang. Photo courtesy of Nvidia.
Market News and Data brought to you by Benzinga APIs
© 2024 Benzinga.com. Benzinga does not provide investment advice. All rights reserved.
Astera Labs Options Trading: A Deep Dive into Market Sentiment
Whales with a lot of money to spend have taken a noticeably bearish stance on Astera Labs.
Looking at options history for Astera Labs ALAB we detected 43 trades.
If we consider the specifics of each trade, it is accurate to state that 27% of the investors opened trades with bullish expectations and 53% with bearish.
From the overall spotted trades, 9 are puts, for a total amount of $451,810 and 34, calls, for a total amount of $2,558,039.
Predicted Price Range
Analyzing the Volume and Open Interest in these contracts, it seems that the big players have been eyeing a price window from $62.5 to $110.0 for Astera Labs during the past quarter.
Analyzing Volume & Open Interest
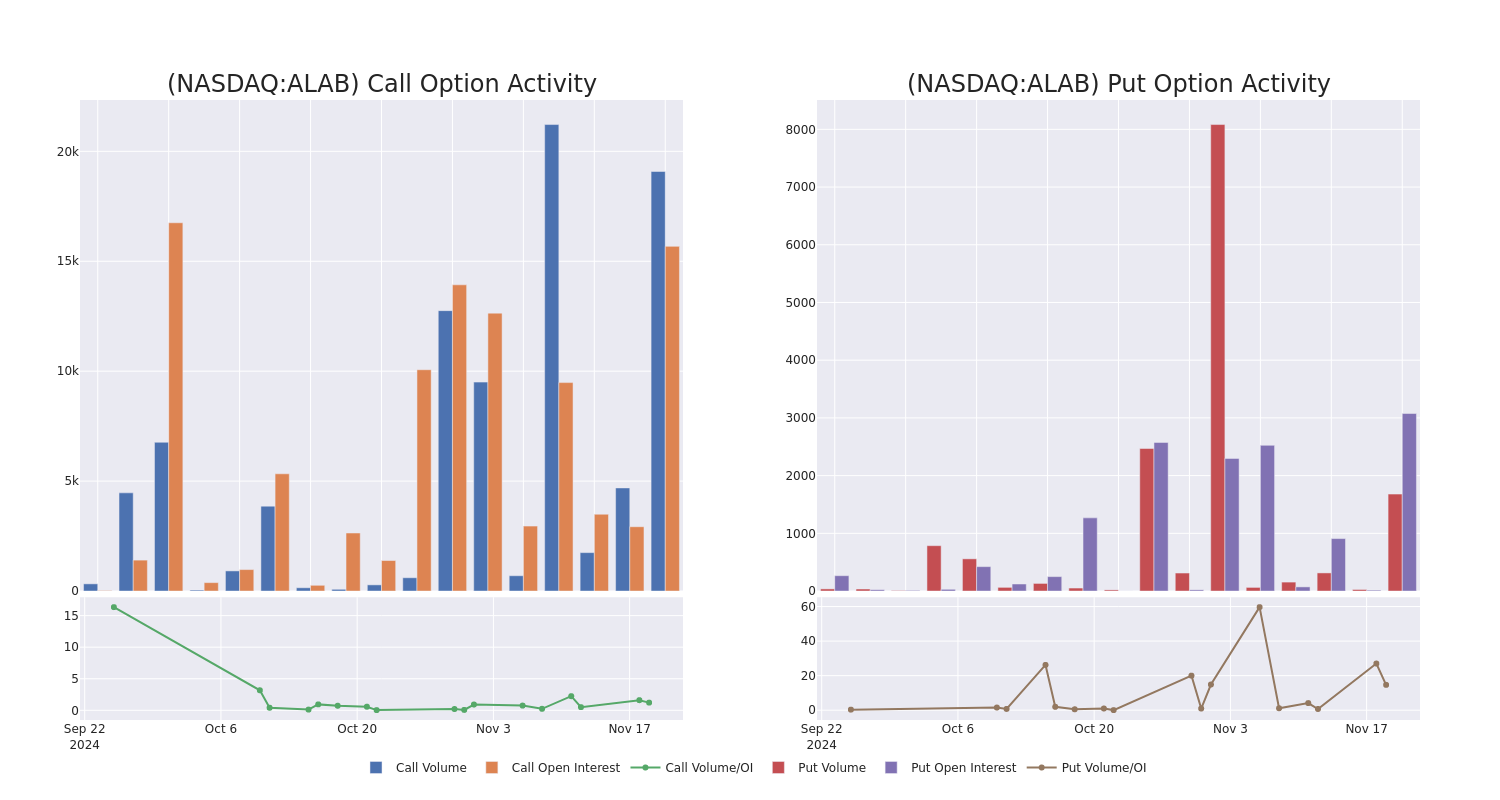
In terms of liquidity and interest, the mean open interest for Astera Labs options trades today is 1110.79 with a total volume of 37,537.00.
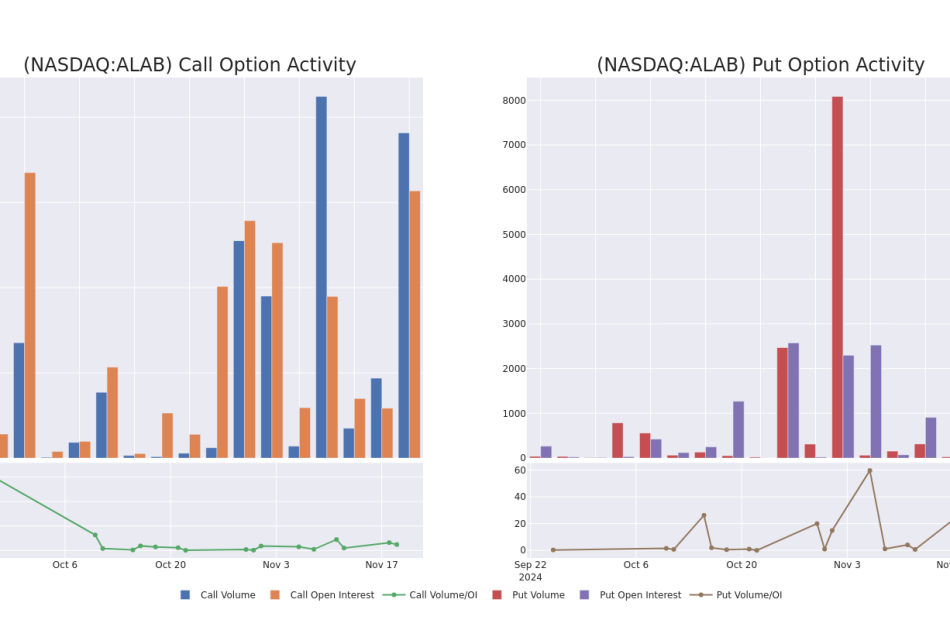
In the following chart, we are able to follow the development of volume and open interest of call and put options for Astera Labs’s big money trades within a strike price range of $62.5 to $110.0 over the last 30 days.
Astera Labs Option Volume And Open Interest Over Last 30 Days
Noteworthy Options Activity:
| Symbol | PUT/CALL | Trade Type | Sentiment | Exp. Date | Ask | Bid | Price | Strike Price | Total Trade Price | Open Interest | Volume |
|---|---|---|---|---|---|---|---|---|---|---|---|
| ALAB | CALL | SWEEP | BEARISH | 07/18/25 | $16.7 | $16.4 | $16.45 | $110.00 | $466.9K | 105 | 500 |
| ALAB | CALL | SWEEP | BULLISH | 01/17/25 | $15.6 | $15.3 | $15.35 | $85.00 | $435.9K | 795 | 500 |
| ALAB | CALL | SWEEP | BEARISH | 01/17/25 | $32.0 | $31.6 | $31.61 | $62.50 | $158.1K | 70 | 50 |
| ALAB | PUT | SWEEP | BEARISH | 04/17/25 | $10.5 | $10.5 | $10.5 | $85.00 | $105.0K | 25 | 100 |
| ALAB | PUT | TRADE | BEARISH | 12/20/24 | $7.8 | $7.4 | $7.7 | $97.50 | $77.0K | 54 | 100 |
About Astera Labs
Astera Labs Inc is a company that offers an Intelligent Connectivity Platform, comprised of Semiconductor-based, high-speed mixed-signal connectivity products that integrate a matrix of microcontrollers and sensors. COSMOS, their software suite which is embedded in its connectivity products and integrated into their customers’ systems. The Company delivers critical connectivity performance, enables flexibility and customization, and supports observability and predictive analytics. This approach addresses the data, network, and memory bottlenecks, scalability, and other infrastructure requirements of hyperscalers and system original equipment manufacturers.
After a thorough review of the options trading surrounding Astera Labs, we move to examine the company in more detail. This includes an assessment of its current market status and performance.
Current Position of Astera Labs
- Currently trading with a volume of 4,536,588, the ALAB’s price is down by -0.76%, now at $94.46.
- RSI readings suggest the stock is currently may be overbought.
- Anticipated earnings release is in 124 days.
Expert Opinions on Astera Labs
A total of 5 professional analysts have given their take on this stock in the last 30 days, setting an average price target of $104.8.
Turn $1000 into $1270 in just 20 days?
20-year pro options trader reveals his one-line chart technique that shows when to buy and sell. Copy his trades, which have had averaged a 27% profit every 20 days. Click here for access.
* Maintaining their stance, an analyst from Deutsche Bank continues to hold a Buy rating for Astera Labs, targeting a price of $100.
* An analyst from Craig-Hallum has decided to maintain their Buy rating on Astera Labs, which currently sits at a price target of $105.
* Reflecting concerns, an analyst from Citigroup lowers its rating to Buy with a new price target of $120.
* An analyst from Roth MKM persists with their Buy rating on Astera Labs, maintaining a target price of $105.
* Maintaining their stance, an analyst from Morgan Stanley continues to hold a Overweight rating for Astera Labs, targeting a price of $94.
Options are a riskier asset compared to just trading the stock, but they have higher profit potential. Serious options traders manage this risk by educating themselves daily, scaling in and out of trades, following more than one indicator, and following the markets closely.
If you want to stay updated on the latest options trades for Astera Labs, Benzinga Pro gives you real-time options trades alerts.
Market News and Data brought to you by Benzinga APIs
© 2024 Benzinga.com. Benzinga does not provide investment advice. All rights reserved.
Nvidia earnings, forecasts top expectations as 'age of AI is in full steam'
Nvidia (NVDA) reported third quarter earnings after the bell on Wednesday that topped expectations on the strength of sales of its high-powered AI chips powering what its CEO Jensen Huang called the “age of AI.”
The world’s largest publicly traded company by market cap, Nvidia reported earnings per share (EPS) of $0.81 on revenue of $35.1 billion. Analysts were anticipating EPS of $0.74 on revenue of $33.2 billion.
Nvidia also said it anticipates revenue of $37.5 billion, plus or minus 2%. That’s just ahead of Wall Street expectations of $37 billion.
Nvidia’s stock price fell roughly 1% on the news.
“The age of AI is in full steam, propelling a global shift to Nvidia computing,” CEO Jensen Huang, said in a statement. “Demand for Hopper and anticipation for Blackwell — in full production — are incredible as foundation model makers scale pretraining, post-training and inference.”
The chip giant’s Data Center business, which makes up the vast majority of its revenue, brought in $30.8 billion in the quarter, topping analysts’ expectations of $29 billion. The segment generated $14.5 billion in Q3 last year.
Nvidia’s gaming revenue came in at $3.3 billion from the $2.8 billion the division brought in last year. Analysts were looking for $3 billion.
Nvidia’s stock has continued to rocket higher throughout 2024, thanks to the explosive growth in AI across the tech landscape and beyond.
Nvidia also appeared to assuage concerns about potential slowdowns in the availability of its next-generation Blackwell chip, with CFO Colette Kress saying that the AI GPU will begin shipping in its current quarter and ramp into the year ahead.
“Both Hopper and Blackwell systems have certain supply constraints, and the demand for Blackwell is expected to exceed supply for several quarters in fiscal 2026,” she added.
Shares of Nvidia were up 192% year to date as of Wednesday, easily outpacing any of the company’s chipmaker rivals. AMD (AMD), the closest competitor, has seen its stock price sink over 5% year to date, while Intel (INTC), which is contending with a difficult turnaround, has seen its stock plunge nearly 52%.
Nvidia is facing an uncertain future, given that Donald Trump has threatened to put blanket tariffs on products from around the world.
In addition, the president-elect has raised the specter of tariffs on Taiwan-made chips. That would be a potential alternative to the CHIPS Act, which is designed to bring semiconductor manufacturing back to the US.
The vast majority of Nvidia’s chips are built by TSMC in Taiwan. A tariff could mean that Nvidia will charge more for its AI chips, depressing margins, or pass the added cost on to its customers. Investors are sure to be looking for any guidance Huang has to offer on the topic.
Decoding YPF's Options Activity: What's the Big Picture?
High-rolling investors have positioned themselves bullish on YPF YPF, and it’s important for retail traders to take note.
This activity came to our attention today through Benzinga’s tracking of publicly available options data. The identities of these investors are uncertain, but such a significant move in YPF often signals that someone has privileged information.
Today, Benzinga’s options scanner spotted 8 options trades for YPF. This is not a typical pattern.
The sentiment among these major traders is split, with 50% bullish and 25% bearish. Among all the options we identified, there was one put, amounting to $207,000, and 7 calls, totaling $343,511.
Predicted Price Range
After evaluating the trading volumes and Open Interest, it’s evident that the major market movers are focusing on a price band between $12.0 and $38.0 for YPF, spanning the last three months.
Analyzing Volume & Open Interest
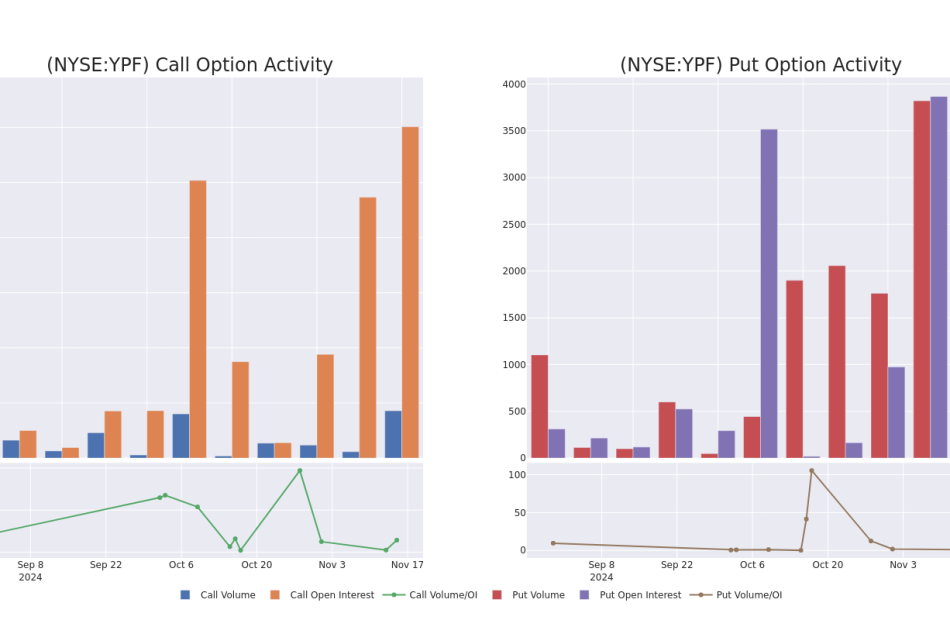
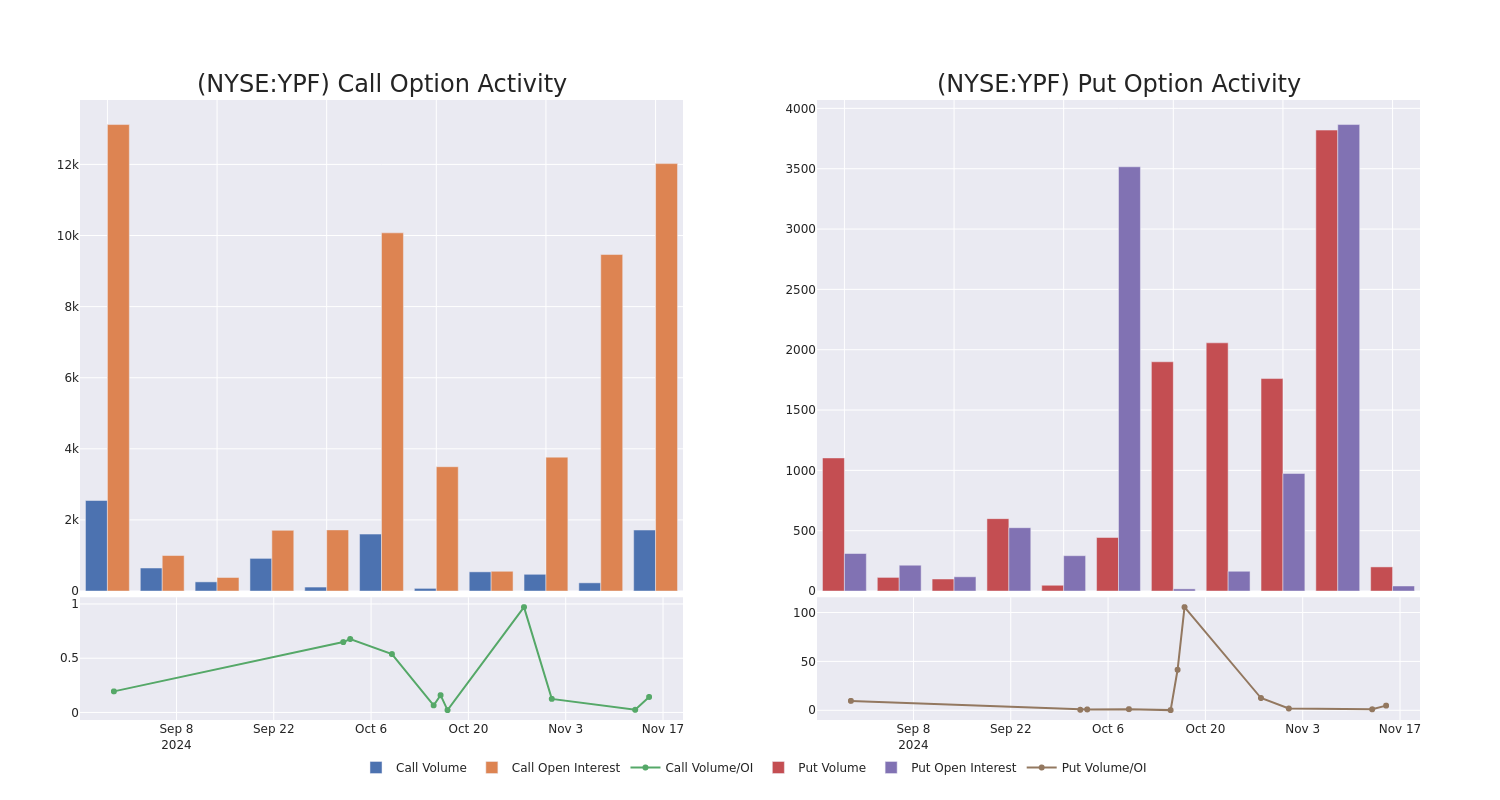
Assessing the volume and open interest is a strategic step in options trading. These metrics shed light on the liquidity and investor interest in YPF’s options at specified strike prices. The forthcoming data visualizes the fluctuation in volume and open interest for both calls and puts, linked to YPF’s substantial trades, within a strike price spectrum from $12.0 to $38.0 over the preceding 30 days.
YPF Call and Put Volume: 30-Day Overview
Noteworthy Options Activity:
| Symbol | PUT/CALL | Trade Type | Sentiment | Exp. Date | Ask | Bid | Price | Strike Price | Total Trade Price | Open Interest | Volume |
|---|---|---|---|---|---|---|---|---|---|---|---|
| YPF | PUT | TRADE | BEARISH | 04/17/25 | $4.6 | $4.5 | $4.6 | $38.00 | $207.0K | 0 | 475 |
| YPF | CALL | TRADE | BULLISH | 04/17/25 | $5.2 | $5.1 | $5.2 | $35.00 | $104.0K | 1.1K | 307 |
| YPF | CALL | SWEEP | BEARISH | 01/17/25 | $6.9 | $6.7 | $6.72 | $30.00 | $50.3K | 4.1K | 88 |
| YPF | CALL | SWEEP | BULLISH | 01/17/25 | $6.7 | $6.5 | $6.7 | $31.00 | $50.2K | 2.4K | 81 |
| YPF | CALL | SWEEP | BULLISH | 04/17/25 | $5.0 | $4.8 | $5.0 | $35.00 | $47.5K | 1.1K | 96 |
About YPF
YPF SA is an Argentina-based integrated oil and gas company. It is engaged in operating a fully integrated oil and gas chain across the domestic upstream, downstream, and gas and power segments. The company’s upstream operations consist of the exploration, development, and production of crude oil, natural gas, and LPG. Its downstream operations include the refining, marketing, transportation, and distribution of oil and a wide range of petroleum products, petroleum derivatives, petrochemicals, LPG, and bio-fuels. The company generates maximum revenue from the downstream segment.
In light of the recent options history for YPF, it’s now appropriate to focus on the company itself. We aim to explore its current performance.
YPF’s Current Market Status
- With a trading volume of 2,652,189, the price of YPF is up by 4.33%, reaching $37.09.
- Current RSI values indicate that the stock is may be overbought.
- Next earnings report is scheduled for 13 days from now.
What Analysts Are Saying About YPF
A total of 1 professional analysts have given their take on this stock in the last 30 days, setting an average price target of $25.0.
Turn $1000 into $1270 in just 20 days?
20-year pro options trader reveals his one-line chart technique that shows when to buy and sell. Copy his trades, which have had averaged a 27% profit every 20 days. Click here for access.
* An analyst from JP Morgan persists with their Neutral rating on YPF, maintaining a target price of $25.
Options are a riskier asset compared to just trading the stock, but they have higher profit potential. Serious options traders manage this risk by educating themselves daily, scaling in and out of trades, following more than one indicator, and following the markets closely.
If you want to stay updated on the latest options trades for YPF, Benzinga Pro gives you real-time options trades alerts.
Market News and Data brought to you by Benzinga APIs
© 2024 Benzinga.com. Benzinga does not provide investment advice. All rights reserved.
Stock market today: Dow, S&P 500 eke out gains ahead of Nvidia earnings
US stocks recovered from steep losses Wednesday ahead of Nvidia’s (NVDA) earnings, seen as a crucial litmus test for the artificial intelligence trade that could set the direction of markets for days to come.
The Dow Jones Industrial Average (^DJI) finished the day up about 0.3%, while the benchmark S&P 500 (^GSPC) closed flat. Meanwhile, the tech-heavy Nasdaq Composite (^IXIC) slipped about 0.1%. All three major indexes had been deep in the red at some point in the day, with the Nasdaq down over 1% in morning trading.
Investors counted down to Nvidia’s results after the bell, hoping the last of the “Magnificent Seven” tech megacaps to report can provide some fresh momentum for stocks. It’s seen as a reality check on just how important the AI poster child (and its cousins) are to the two-year bull market.
The $3.61 trillion chipmaker, now the world’s most valuable company, has seen its stock surge 200% this year so far, hitting record highs after the US presidential election.
Nvidia’s share price was down less than 1% after surging on Tuesday to buoy the Nasdaq to a win. Traders are bracing for a potential post-earnings swing of 8% — or $300 billion in market value — in either direction, going by options markets.
Elsewhere in corporates, Target (TGT) muted its outlook for holiday-season sales and profit after posting a big quarterly profit miss and slashing its full-year guidance. The retail giant’s shares sank more than 21% after the earnings.
Meanwhile, bitcoin (BTC-USD) prices were up more than 3% to hit a fresh record near $94,500 per token before paring back some gains and falling below $94,000. Optimism for a crypto-friendly Trump White House has spurred the digital currency’s recent rally.
LIVE 18 updatesInnocan Pharma Reports Third Quarter 2024 Financial Results
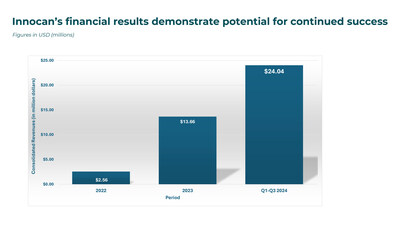
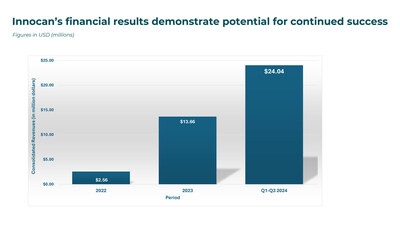
2.7X Revenue Growth Year-Over-Year at US $24 Million for 9-month Period
HERZLIYA, Israel and CALGARY, Alberta, Nov. 20, 2024 /CNW/ — Innocan Pharma Corporation INNO IP INNPF (the “Company” or “Innocan”), a pharmaceutical technology company focusing on developing innovative drug delivery platform technologies, is pleased to announce its consolidated financial results for the three and nine-month periods ended September 30, 2024.
Financial Highlights
- Revenue Growth: 9-month revenues up 174% year over year (YoY) to US $24.0 million and 3-month revenues up 111% YoY to US $8.6 million, driven by strong sales growth of Innocan’s subsidiary, BI Sky Global Ltd.
- Gross Profit in the 9-month year-to-date period increased 183% to US$21.8 million, compared to US$7.7 million in the nine-month period of 2023; Third quarter gross profit increased 112% to US$7.8 million, compared to US$3.7 million in the third quarter of 2023.
- Operating Profit increased to US$0.4 million, an increase of US$1.6 million compared to an operating loss of US$1.2 million in the third quarter of 2023.
- Net Profit increased to US$0.3 million, an increase of US$2.1 million compared to a net loss of US$1.8 million in the third quarter of 2023.
Management Comments
Iris Bincovich, the CEO of Innocan commented: “As our results for both the third quarter and nine-month period have demonstrated, Innocan is bringing strong value for shareholders through our dual focus on our pharma and wellness activities. Chronic pain, which affects over a quarter of the U.S. population, remains one of the most pressing issues in outpatient care today*. Our commitment and solution for chronic pain management is backed by rigorous pharmaceutical innovation and science. With our LPT-CBT injection targeting pain relief, we are bringing a unique, non-opioid chronic pain management solution for both animals and humans, utilizing our proprietary drug delivery mechanism.”
Roni Kamhi, CEO of BI Sky Global, subsidiary of Innocan, and COO of Innocan Pharma, commented, “Our strong operational and financial momentum continued throughout 2024 and now in the third quarter, we again demonstrated solid financial results. We are pleased to report nine consecutive quarters of continuous revenue growth. Our online platform continues to perform exceptionally well, contributing to our strong nine-month revenue growth of 174% YoY to US$24.0 million and a gross profit increase of 183% to US$21.8 million. This success reflects our successful introduction of new products and increased brand awareness”.
Innocan’s unaudited consolidated financial statements and related management’s discussion and analysis for the three month period ended September 30, 2024, can be found on the Company’s profile at www.sedarplus.ca.
About Innocan
Innocan is an innovator in the pharmaceuticals and wellness sectors. In the pharmaceuticals sector, Innocan developed a CBD-loaded liposome drug delivery platform with exact dosing, prolonged and controlled release of synthetic CBD for non-opioid pain management. In the wellness sector, Innocan develops and markets a wide portfolio of high-performance self-care and beauty products to promote a healthier lifestyle. Under this segment Innocan carries on business through its 60% owned subsidiary, BI Sky Global Ltd. which focuses on advanced, targeted online sales.
For further information, please contact:
Iris Bincovich, CEO
+1-516-210-4025
+972-54-3012842
+44 203 769 9377
info@innocanpharma.com
*Chronic Pain – StatPearls – NCBI Bookshelf
NEITHER THE CANADIAN SECURITIES EXCHANGE NOR ITS REGULATION SERVICES PROVIDER HAVE REVIEWED OR ACCEPT RESPONSIBILITY FOR THE ADEQUACY OR ACCURACY OF THIS RELEASE.
Cautionary note regarding forward-looking information
Certain information set forth in this news release, including, without limitation, information regarding research and development, collaborations, the filing of potential applications with the FDA and other regulatory authorities, the potential achievement of future regulatory milestones, the potential for treatment of conditions and other therapeutic effects resulting from research activities and/or the Company’s products, requisite regulatory approvals and the timing for market entry, is forward-looking information within the meaning of applicable securities laws. By its nature, forward-looking information is subject to numerous risks and uncertainties, some of which are beyond Innocan’s control. The forward-looking information contained in this news release is based on certain key expectations and assumptions made by Innocan, including expectations and assumptions concerning the anticipated benefits of the products, satisfaction of regulatory requirements in various jurisdictions and satisfactory completion of requisite production and distribution arrangements.
Forward-looking information is subject to various risks and uncertainties which could cause actual results and experience to differ materially from the anticipated results or expectations expressed in this news release. The key risks and uncertainties include but are not limited to: general global and local (national) economic, market and business conditions; governmental and regulatory requirements and actions by governmental authorities; and relationships with suppliers, manufacturers, customers, business partners and competitors. There are also risks that are inherent in the nature of product distribution, including import / export matters and the failure to obtain any required regulatory and other approvals (or to do so in a timely manner) and availability in each market of product inputs and finished products. The anticipated timeline for entry to markets may change for a number of reasons, including the inability to secure necessary regulatory requirements, or the need for additional time to conclude and/or satisfy the manufacturing and distribution arrangements. As a result of the foregoing, readers should not place undue reliance on the forward-looking information contained in this news release concerning the timing of launch of product distribution. A comprehensive discussion of other risks that impact Innocan can also be found in Innocan’s public reports and filings which are available under Innocan’s profile at www.sedar.com.
Readers are cautioned that undue reliance should not be placed on forward-looking information as actual results may vary materially from the forward-looking information. Innocan does not undertake to update, correct or revise any forward looking information as a result of any new information, future events or otherwise, except as may be required by applicable law.
Photo – https://stockburger.news/wp-content/uploads/2024/11/Revenues.jpg
Logo – https://mma.prnewswire.com/media/2046271/3968398/Innocan_Pharma_Corporation_Logo.jpg
![]() View original content to download multimedia:https://www.prnewswire.com/news-releases/innocan-pharma-reports-third-quarter-2024-financial-results-302311841.html
View original content to download multimedia:https://www.prnewswire.com/news-releases/innocan-pharma-reports-third-quarter-2024-financial-results-302311841.html
SOURCE Innocan Pharma Corporation

![]() View original content to download multimedia: http://www.newswire.ca/en/releases/archive/November2024/20/c7162.html
View original content to download multimedia: http://www.newswire.ca/en/releases/archive/November2024/20/c7162.html
© 2024 Benzinga.com. Benzinga does not provide investment advice. All rights reserved.
Special Distribution Estimate for Canso Credit Income Fund (the "Fund")
TORONTO, Nov. 20, 2024 /CNW/ – Lysander Funds Limited announces estimated special distributions for each class of units of Canso Credit Income Fund ( the “Fund”) PBY as follows:
Estimated Special Distribution
Based on information prepared as of October 31, 2024, the Fund estimates paying an additional distribution (“Special Distribution“) in respect of each class of units as follows:
- Class A units: $0.19386 /unit
- Class F units: $0.22668 /unit
The estimated Special Distribution will be payable on December 31, 2024, to unitholders of record as of December 31, 2024. The estimated Special Distribution will be paid on or about January 2, 2025.
The estimated Special Distribution will be paid by the issuance of the same class of units of the Fund, and immediately thereafter, each class of issued and outstanding units of the Fund will be consolidated such that the number of issued and outstanding units of each class of the Fund will not change.
The final amount of the Special Distribution will be announced as soon as it is finalized. The actual taxable amounts of all distributions for 2024, including the tax characteristics of the monthly cash and Special Distributions, will be reported to investment dealers (through CDS Clearing and Depository Services Inc. or “CDS”) in early 2025.
Lysander Funds Limited (“Lysander”) is the Fund’s manager and provides estimated distributions for information purposes only. These estimates are not intended to be, nor should they be construed to be, legal or tax advice to any particular person.
Commissions, management fees and expenses all may be associated with investments funds. Please read the prospectus before investing. The Fund is not guaranteed, its value changes frequently and past performance may not be repeated. You will usually pay brokerage fees to your dealer if you purchase or sell units of the Fund on the Toronto Stock Exchange. If the units are purchased or sold on the Toronto Stock Exchange, investors may pay more than the current net asset value when buying units of the Fund and may receive less than the current net asset value when selling them. There are ongoing fees and expenses associated with owning units of an investment fund. An investment fund must prepare disclosure documents that contain key information about the fund. You can find more detailed information about the Fund in these documents.
Forward-looking Information
This press release contains forward-looking statements with respect to the estimated Special Distributions. By their nature, these forward-looking statements involve certain risks and uncertainties that could cause the actual distributions to differ materially from those contemplated by the forward-looking statements. Material factors that could cause the actual Special Distributions to differ from the estimated Special Distributions between now and the Fund’s tax year-end, without limitation: the actual amounts of income received by the Fund and the actual amount of capital gains generated from the sales of securities.
The forward-looking statements are not historical facts but reflect the current expectations of Lysander regarding future results or events and are based on information currently available to them. Certain material factors and assumptions were applied in providing these forward-looking statements. All forward-looking statements in this press release are qualified by these cautionary statements. Lysander believes that the expectations reflected in forward-looking statements are based upon reasonable assumptions; however, Lysander can give no assurance that the actual results or developments will be realized. These forward-looking statements are subject to a number of risks and uncertainties that could cause actual results or events to differ materially from current expectations. Readers, therefore, should not place undue reliance on any such forward-looking statements. Further, a forward-looking statement speaks only as of the date on which such statement is made. Lysander undertakes no obligation to publicly update any such statement or to reflect new information or the occurrence of future events or circumstances except as required by securities laws. These forward-looking statements are made as of the date of this press release.
SOURCE Canso Credit Income Fund

![]() View original content: http://www.newswire.ca/en/releases/archive/November2024/20/c4510.html
View original content: http://www.newswire.ca/en/releases/archive/November2024/20/c4510.html
Market News and Data brought to you by Benzinga APIs
© 2024 Benzinga.com. Benzinga does not provide investment advice. All rights reserved.
What's The Average 'Upper Class' Retirement Nest Egg? Here's A Look At What The Wealthiest 20% Have Stashed Away
You’re scrolling through social media and another friend is showing off their latest Mediterranean cruise. It’s hard not to wonder – are they living the dream or ignoring the whole “retirement savings” thing?
If they’re part of the upper class, there’s a good chance they have the money to fund both their vacations and their future. But how much have they saved for retirement? And where do you stand?
Don’t Miss:
What’s Considered “Upper Class?”
Before examining the numbers, it’s important to understand what “upper class” actually means.
According to Pew Research, the median income for a three-person upper-class household was $256,920 in 2022. However, income is only part of the equation. Wealth – defined as net worth – is a major factor, especially regarding retirement savings.
A New York Times analysis suggests that the top 20% of families have a wealth-to-income ratio of about 3 to 1. A household earning $256,920 has a net worth of around $770,760.
Now, let’s compare that to data from the Federal Reserve. According to their latest Survey of Consumer Finances:
-
The top 10% of households have a median net worth of $2.7 million.
-
The next bracket (11th – 25th percentile) holds a median net worth of just over $790,000.
So, whether you’re using income or wealth as your metric, the upper class is miles ahead of the national average.
Trending: Many are using this retirement income calculator to check if they’re on pace — here’s a breakdown on how on what’s behind this formula.
The Average Retirement Savings for the Upper Class
When it comes to retirement savings, the upper class doesn’t disappoint. According to data from The Motley Fool:
-
The top 10% of earners have a median retirement savings balance of $900,000.
-
Those in the next tier (75th – 89.9th percentile) have a median balance of $269,000.
Since the upper class typically includes the top 20%, a reasonable estimate for their median retirement savings is between $400,000 and $500,000. While exact numbers aren’t available for the full group, their savings are far above the national medians:
-
Median retirement savings for all U.S. households: $87,000.
-
Households under 35: Just $18,800.
If your retirement savings are in the six-figure range, you’re closer to the upper-class average than most people. If not, there’s still time to step up your game.


