Associated Capital Reports Results for the Third Quarter 2024
- AUM: $1.34 billion at September 30, 2024
- Book Value per share ended the quarter at $42.02
- Returned $45.9 million to shareholders through dividends declared and share repurchases in the third quarter
- Approved $0.20 per share shareholder designated charitable contribution for registered shareholders, bringing total to $42 million since our spin-off in 2015
GREENWICH, Conn., Nov. 08, 2024 (GLOBE NEWSWIRE) — Associated Capital Group, Inc. (“AC” or the “Company”), a diversified financial services company, today reported its financial results for the third quarter of 2024.
Financial Highlights
($ in 000’s except AUM and per share data)
| (Unaudited) | Three Months Ended | Nine Months Ended | ||||||||||||||
| September 30, | September 30, | |||||||||||||||
| 2024 | 2023 | 2024 | 2023 | |||||||||||||
| AUM – end of period (in millions) | $ | 1,340 | $ | 1,588 | $ | 1,340 | $ | 1,588 | ||||||||
| AUM – average (in millions) | 1,349 | 1,580 | 1,450 | 1,686 | ||||||||||||
| Revenues | 2,415 | 2,200 | 8,021 | 7,047 | ||||||||||||
| Operating loss before management fee (Non-GAAP) | (3,604 | ) | (3,533 | ) | (9,824 | ) | (9,050 | ) | ||||||||
| Investment and other non-operating income/(loss), net | 37,239 | 3,794 | 67,116 | 37,140 | ||||||||||||
| Income before income taxes and noncontrolling interests | 30,323 | 273 | 51,556 | 25,015 | ||||||||||||
| Net income/(loss) | 23,242 | (16 | ) | 40,048 | 21,109 | |||||||||||
| Net income/(loss) per share – basic and diluted | 1.09 | 0.00 | 1.87 | 0.97 | ||||||||||||
| Class A shares outstanding (000’s) | 2,297 | 2,672 | 2,297 | 2,672 | ||||||||||||
| Class B ” “ | 18,951 | 18,951 | 18,951 | 18,951 | ||||||||||||
| Total ” “ | 21,248 | 21,623 | 21,248 | 21,623 | ||||||||||||
| Book value per share | $ | 42.02 | $ | 41.43 | $ | 42.02 | $ | 41.43 | ||||||||
Giving Back to Society – (Y)our “S” in ESG
AC seeks to be a good corporate citizen by supporting our community through sponsoring local organizations. On August 7, 2024, the Board of Directors approved up to a $4.3 million, or $0.20 per share, shareholder designated charitable contribution (“SDCC”) for registered shareholders as of October 18, 2024. Based on the program created by Warren Buffett at Berkshire Hathaway, our corporate charitable giving is unique in that the recipients of AC’s charitable contributions are chosen directly by our shareholders, rather than by our corporate officers. Since our spin off as a public company, the shareholders of AC have donated approximately $42 million, including the most recent SDCC, to over 190 501(c)(3) organizations across the United States.
Third Quarter Financial Data
- Assets under management ended the quarter at $1.34 billion versus $1.59 billion at September 30, 2023.
- Book value was $42.02 per share (ex- $2 per share dividend) compared to $41.43 per share at September 30, 2023.
Third Quarter Results
Total revenues in the third quarter of 2024 were $2.4 million compared to $2.2 million in the third quarter of 2023. Revenues generated by the GAMCO International SICAV – GAMCO Merger Arbitrage (the “SICAV”) were $1.1 million versus $0.8 million in the prior year period. All other revenues were $1.3 million compared to $1.4 million in the year ago quarter.
Starting in December 2023, the Company recognized 100% of the merger arbitrage SICAV revenues received by Gabelli Funds, LLC. In turn, AC pays the marketing expenses of the SICAV previously paid by Gabelli Funds, and remits an administrative fee to Gabelli Funds for administrative services provided. This change better aligns the financial arrangements with the services rendered by each party. The net effect of this change had no material impact on our operating results.
Total operating expenses, excluding management fee, were $6.0 million in the third quarter of 2024 and $5.7 million in the third quarter of 2023. The increase is primarily attributed to the $0.5 million of marketing expenses on the merger arbitrage SICAV, offset partially by lower variable based compensation expenses.
Net investment and other non-operating income was $37.2 million for the third quarter of 2024 compared to $3.8 million in the third quarter of 2023. The primary drivers of this quarter’s results included gains from our merger arbitrage partnerships, a $2 per share special dividend declared on our holdings of GAMCO Investors, Inc. and interest income.
For the quarter ended September 30, 2024, the management fee was $3.3 million versus none in the year ago quarter.
The effective tax rate applied to our pre-tax income for the quarter ended September 30, 2024 was 22.9%. In the year ago quarter, the effective tax rate was 60.8% due to the deferred tax expense from a foreign investment.
Assets Under Management (AUM)
Assets under management at September 30, 2024 were $1.34 billion, $251 million lower than year-end 2023, the result of net outflows of $288 million and the impact of currency fluctuations in non-US dollar denominated classes of investment funds of $4 million, offset partially by market appreciation of $41 million.
| September 30, | December 31, | September 30, | ||||||||||
| 2024 | 2023 | 2023 | ||||||||||
| ($ in millions) | ||||||||||||
| Merger Arbitrage(a) | $ | 1,095 | $ | 1,312 | $ | 1,322 | ||||||
| Long/Short Value(b) | 208 | 244 | 233 | |||||||||
| Other | 37 | 35 | 33 | |||||||||
| Total AUM | $ | 1,340 | $ | 1,591 | $ | 1,588 | ||||||
(a) Includes $431, $621, and $613 of sub-advisory AUM related to GAMCO International SICAV – GAMCO Merger Arbitrage, and $68, $69, and $67 of sub-advisory AUM related to Gabelli Merger Plus+ Trust Plc at September 30, 2024, December 31, 2023 and September 30, 2023, respectively.
(b) Includes $201, $237 and $226 for which Associated Capital receives only performance fees, less expenses of $25, $25, and $24 at September 30, 2024, December 31, 2023 and September 30, 2023, respectively.
Alternative Investment Management
The alternative investment strategy offerings center around our merger arbitrage strategy, which has an absolute return focus of generating returns independent of the broad equity and fixed income markets. We also offer strategies utilizing fundamental, active, event-driven and special situations investments.
Merger Arbitrage

For the third quarter of 2024, the longest continuously offered fund in the merger arbitrage strategy generated gross returns of 4.88% (3.80% net of fees). A summary of the performance is as follows:
| Full Year | ||||||||||||||||||||||||||||||||||||||||
| Performance%(a) | 3Q ’24 | 3Q ’23 | YTD ’24 | YTD ’23 | 2023 | 2022 | 2021 | 2020 | 5 Year(b) | Since 1985(b)(c) | ||||||||||||||||||||||||||||||
| Merger Arb | ||||||||||||||||||||||||||||||||||||||||
| Gross | 4.88 | 2.88 | 4.82 | 2.23 | 5.49 | 4.47 | 10.81 | 9.45 | 7.66 | 10.01 | ||||||||||||||||||||||||||||||
| Net | 3.80 | 2.33 | 3.23 | 1.17 | 3.56 | 2.75 | 7.78 | 6.70 | 5.28 | 7.08 | ||||||||||||||||||||||||||||||
(a) Net performance is net of fees and expenses, unless otherwise noted. Performance shown for an actual fund in this strategy. The performance of other funds in this strategy may vary. Past performance is no guarantee of future results.
(b) Represents annualized returns through September 30, 2024
(c) Inception Date: February 1985
Global M&A activity totaled $2.3 trillion in the first nine months of 2024, an increase of 16% compared to the same period in 2023. The U.S. continued to lead in dealmaking, accounting for $1.1 trillion, or 48% of global activity, the largest percentage for U.S. dealmaking since 2019. Private Equity-backed buyouts represented 24% of M&A activity, with a total value of $548 billion, marking a 40% increase over 2023 levels and the strongest first nine months for private equity dealmaking since 1980. The Technology sector led in activity with a total volume of $375 billion, accounting for 16% of overall value, followed by Energy & Power at $374 billion or 16% and Financials at $308 billion or 12%.
The Merger Arbitrage strategy is offered by mandate and client type through partnerships and offshore corporations serving accredited as well as institutional investors. The strategy is also offered in separately managed accounts, a Luxembourg UCITS (an entity organized as an Undertaking for Collective Investment in Transferrable Securities) and a London Stock Exchange listed investment company, Gabelli Merger Plus+ Trust Plc (GMP-LN).
Acquisitions
Associated Capital Group’s plan is to accelerate the use of its capital. We intend to leverage our research and investment capabilities by pursuing acquisitions and alliances that will broaden our product offerings and add new sources of distribution. In addition, we may make direct investments in operating businesses using a variety of techniques and structures to accomplish our objectives.
Gabelli Private Equity Partners was created to launch a private equity business, somewhat akin to the success our predecessor PE firm had in the 1980s. We will continue our outreach initiatives with business owners, corporate management, and various financial sponsors. We are activating our program of buying privately owned, family started businesses, controlled and operated by the founding family.
Shareholder Compensation
On September 19, 2024, the Board of Directors declared a special cash dividend of $2.00 per share, payable on November 4, 2024 to shareholders of record on October 21, 2024. In addition to this special dividend, on November 8, 2024, the Board of Directors declared a semi-annual dividend of $0.10 per share which is payable on December 19, 2024 to shareholders of record on December 5, 2024.
During the third quarter, AC repurchased 107,218 Class A shares, totaling $3.4 million, at an average price of $31.80 per share. For the nine months ended September 30, 2024, AC repurchased 290,041 Class A shares, totaling $9.6 million, at an average price of $33.01 per share. Shares may be purchased from time to time in the future, however share repurchase amounts and prices may vary after considering a variety of factors, including the Company’s financial position, earnings, other alternative uses of cash, macroeconomic issues, and market conditions.
Since our inception in 2015, AC has returned $181.9 million to shareholders through share repurchases and exchange offers, in addition to dividends of $81.1 million.
At September 30, 2024, there were 21.248 million shares outstanding, consisting of 2.297 million Class A shares and 18.951 million Class B shares outstanding.
About Associated Capital Group, Inc.
Associated Capital Group, Inc. AC, based in Greenwich, Connecticut, is a diversified global financial services company that provides alternative investment management through Gabelli & Company Investment Advisers, Inc. (“GCIA”). We have also earmarked proprietary capital for our direct investment business that invests in new and existing businesses. The direct investment business is developing along several core pillars, including Gabelli Private Equity Partners, LLC (“GPEP”), which was formed in August 2017 with $150 million of authorized capital as a “fund-less” sponsor and Gabelli Principal Strategies Group, LLC (“GPS”), which was formed in December 2015 to pursue strategic operating initiatives.
Operating Loss Before Management Fee
Operating loss before management fee expense represents a non-GAAP financial measure used by management to evaluate its business operations. We believe this measure is useful in illustrating the operating results of the Company as management fee expense is based on pre-tax income before management fee expense, which includes non-operating items including investment gains and losses from the Company’s proprietary investment portfolio and interest expense.
| Three Months Ended | Nine Months Ended | |||||||||||||||
| September 30, | September 30, | |||||||||||||||
| ($ in 000’s) | 2024 | 2023 | 2024 | 2023 | ||||||||||||
| Operating loss – GAAP | $ | (6,916 | ) | $ | (3,521 | ) | $ | (15,560 | ) | $ | (12,125 | ) | ||||
| Add: management fee expense (1) | 3,312 | (12 | ) | 5,736 | 3,075 | |||||||||||
| Operating loss before management fee – Non-GAAP | $ | (3,604 | ) | $ | (3,533 | ) | $ | (9,824 | ) | $ | (9,050 | ) | ||||
(1) Management fee expense is incentive-based and is equal to 10% of Income before management fee and income taxes and excludes the impact of consolidating entities. For the three months ended September 30, 2024, Income before management fee, income taxes and excluding consolidated entities was $33,120; as a result $3,312 was accrued for the 10% management fee expense. There was no such accrual in the three months ended September 30, 2023. For the nine months ended September 30, 2024 and 2023, Income before management fee, income taxes and excluding consolidated entities was $57,363 and $30,747, respectively; as a result, $5,736 and $3,075 was accrued for the 10% management fee expense in 2024 and 2023, respectively.
| Table I | ||||||||||||
| ASSOCIATED CAPITAL GROUP, INC. UNAUDITED CONDENSED CONSOLIDATED STATEMENTS OF FINANCIAL CONDITION (Amounts in thousands) |
||||||||||||
| September 30, | December 31, | September 30, | ||||||||||
| 2024 | 2023 | 2023 | ||||||||||
| ASSETS | ||||||||||||
| Cash, cash equivalents and US Treasury Bills | $ | 376,697 | $ | 406,642 | $ | 384,214 | ||||||
| Investments in securities and partnerships | 472,528 | 420,706 | 433,480 | |||||||||
| Investment in GAMCO stock | 56,401 | 45,602 | 48,031 | |||||||||
| Receivable from brokers | 26,985 | 30,268 | 29,354 | |||||||||
| Income taxes receivable, including deferred tax assets, net | 2,588 | 8,474 | 7,804 | |||||||||
| Other receivables | 6,402 | 5,587 | 1,616 | |||||||||
| Other assets | 35,552 | 26,518 | 21,883 | |||||||||
| Total assets | $ | 977,153 | $ | 943,797 | $ | 926,382 | ||||||
| LIABILITIES, REDEEMABLE NONCONTROLLING INTERESTS AND EQUITY | ||||||||||||
| Payable to brokers | $ | 7,865 | $ | 4,459 | $ | 5,618 | ||||||
| Income taxes payable, including deferred tax liabilities, net | 989 | – | – | |||||||||
| Compensation payable | 17,488 | 15,169 | 10,915 | |||||||||
| Securities sold short, not yet purchased | 7,376 | 5,918 | 5,090 | |||||||||
| Accrued expenses and other liabilities | 2,288 | 5,173 | 1,957 | |||||||||
| Dividend payable | 42,494 | – | – | |||||||||
| Total liabilities | $ | 78,500 | $ | 30,719 | $ | 23,580 | ||||||
| Redeemable noncontrolling interests | 5,836 | 6,103 | 7,133 | |||||||||
| Total equity | 892,817 | 906,975 | 895,669 | |||||||||
| Total liabilities, redeemable noncontrolling interests and equity | $ | 977,153 | $ | 943,797 | $ | 926,382 | ||||||
(1) Certain captions include amounts related to a consolidated variable interest entity (“VIE”) and voting interest entity (“VOE”); refer to footnote 4 of the Condensed Consolidated Financial Statements included in the 10-Q report to be filed for the quarter ended September 30, 2024 for more details on the impact of consolidating these entities.
(2) Investment in GAMCO stock: 2,303,023, 2,386,295 and 2,397,974 shares, respectively.
| Table II | ||||||||||||||||
| ASSOCIATED CAPITAL GROUP, INC. UNAUDITED CONDENSED CONSOLIDATED STATEMENTS OF INCOME (Amounts in thousands, except per share data) |
||||||||||||||||
| Three Months Ended | Nine Months Ended | |||||||||||||||
| September 30, | September 30, | |||||||||||||||
| 2024 | 2023 | 2024 | 2023 | |||||||||||||
| Investment advisory and incentive fees | $ | 2,310 | $ | 2,098 | $ | 7,706 | $ | 6,789 | ||||||||
| Other revenues | 105 | 102 | 315 | 258 | ||||||||||||
| Total revenues | 2,415 | 2,200 | 8,021 | 7,047 | ||||||||||||
| Compensation | 4,215 | 4,078 | 11,977 | 11,437 | ||||||||||||
| Other operating expenses | 1,804 | 1,655 | 5,868 | 4,660 | ||||||||||||
| Total expenses | 6,019 | 5,733 | 17,845 | 16,097 | ||||||||||||
| Operating loss before management fee | (3,604 | ) | (3,533 | ) | (9,824 | ) | (9,050 | ) | ||||||||
| Investment gain/(loss) | 26,173 | (2,173 | ) | 42,808 | 21,635 | |||||||||||
| Interest and dividend income from GAMCO | 4,700 | 96 | 5,362 | 288 | ||||||||||||
| Interest and dividend income, net | 6,366 | 6,106 | 19,395 | 16,821 | ||||||||||||
| Shareholder-designated contribution | – | (235 | ) | (449 | ) | (1,604 | ) | |||||||||
| Investment and other non-operating income, net | 37,239 | 3,794 | 67,116 | 37,140 | ||||||||||||
| Income before management fee and income taxes | 33,635 | 261 | 57,292 | 28,090 | ||||||||||||
| Management fee | 3,312 | (12 | ) | 5,736 | 3,075 | |||||||||||
| Income before income taxes | 30,323 | 273 | 51,556 | 25,015 | ||||||||||||
| Income tax expense | 6,933 | 166 | 11,415 | 3,586 | ||||||||||||
| Income before noncontrolling interests | 23,390 | 107 | 40,141 | 21,429 | ||||||||||||
| Income attributable to noncontrolling interests | 148 | 123 | 93 | 320 | ||||||||||||
| Net income/(loss) attributable to Associated Capital Group | $ | 23,242 | $ | (16 | ) | $ | 40,048 | $ | 21,109 | |||||||
| Net income per share attributable to Associated Capital Group | ||||||||||||||||
| Basic | $ | 1.09 | $ | 0.00 | $ | 1.87 | $ | 0.97 | ||||||||
| Diluted | $ | 1.09 | $ | 0.00 | $ | 1.87 | $ | 0.97 | ||||||||
| Weighted average shares outstanding: | ||||||||||||||||
| Basic | 21,275 | 21,672 | 21,389 | 21,836 | ||||||||||||
| Diluted | 21,275 | 21,672 | 21,389 | 21,836 | ||||||||||||
| Actual shares outstanding – end of period | 21,248 | 21,623 | 21,248 | 21,623 | ||||||||||||
SPECIAL NOTE REGARDING FORWARD-LOOKING INFORMATION
The financial results set forth in this press release are preliminary. Our disclosure and analysis in this press release, which do not present historical information, contain “forward-looking statements” within the meaning of the U.S. Private Securities Litigation Reform Act of 1995. Forward-looking statements convey our current expectations or forecasts of future events. You can identify these statements because they do not relate strictly to historical or current facts. They use words such as “anticipate,” “estimate,” “expect,” “project,” “intend,” “plan,” “believe,” and other words and terms of similar meaning. They also appear in any discussion of future operating or financial performance. In particular, these include statements relating to future actions, future performance of our products, expenses, the outcome of any legal proceedings, and financial results. Although we believe that we are basing our expectations and beliefs on reasonable assumptions within the bounds of what we currently know about our business and operations, the economy and other conditions, there can be no assurance that our actual results will not differ materially from what we expect or believe. Therefore, you should proceed with caution in relying on any of these forward-looking statements. They are neither statements of historical fact nor guarantees or assurances of future performance.
Forward-looking statements involve a number of known and unknown risks, uncertainties and other important factors, some of which are listed below, that are difficult to predict and could cause actual results and outcomes to differ materially from any future results or outcomes expressed or implied by such forward-looking statements. Some of the factors that could cause our actual results to differ from our expectations or beliefs include a decline in the securities markets that adversely affect our assets under management, negative performance of our products, the failure to perform as required under our investment management agreements, and a general downturn in the economy that negatively impacts our operations. We also direct your attention to the more specific discussions of these and other risks, uncertainties and other important factors contained in our Form 10 and other public filings. Other factors that could cause our actual results to differ may emerge from time to time, and it is not possible for us to predict all of them. We do not undertake to update publicly any forward-looking statements if we subsequently learn that we are unlikely to achieve our expectations whether as a result of new information, future developments or otherwise, except as may be required by law.
| Contact: | Ian J. McAdams | |
| Chief Financial Officer | ||
| (914) 921-5078 | ||
| Associated-Capital-Group.com | ||
A photo accompanying this announcement is available at https://www.globenewswire.com/NewsRoom/AttachmentNg/00f9af12-0742-4809-9ba5-ad5c4b21cd9d

© 2024 Benzinga.com. Benzinga does not provide investment advice. All rights reserved.
Check Out What Whales Are Doing With OKLO
High-rolling investors have positioned themselves bullish on Oklo OKLO, and it’s important for retail traders to take note.
This activity came to our attention today through Benzinga’s tracking of publicly available options data. The identities of these investors are uncertain, but such a significant move in OKLO often signals that someone has privileged information.
Today, Benzinga’s options scanner spotted 30 options trades for Oklo. This is not a typical pattern.
The sentiment among these major traders is split, with 50% bullish and 36% bearish. Among all the options we identified, there was one put, amounting to $112,500, and 29 calls, totaling $2,339,238.
Predicted Price Range
Based on the trading activity, it appears that the significant investors are aiming for a price territory stretching from $2.5 to $40.0 for Oklo over the recent three months.
Analyzing Volume & Open Interest
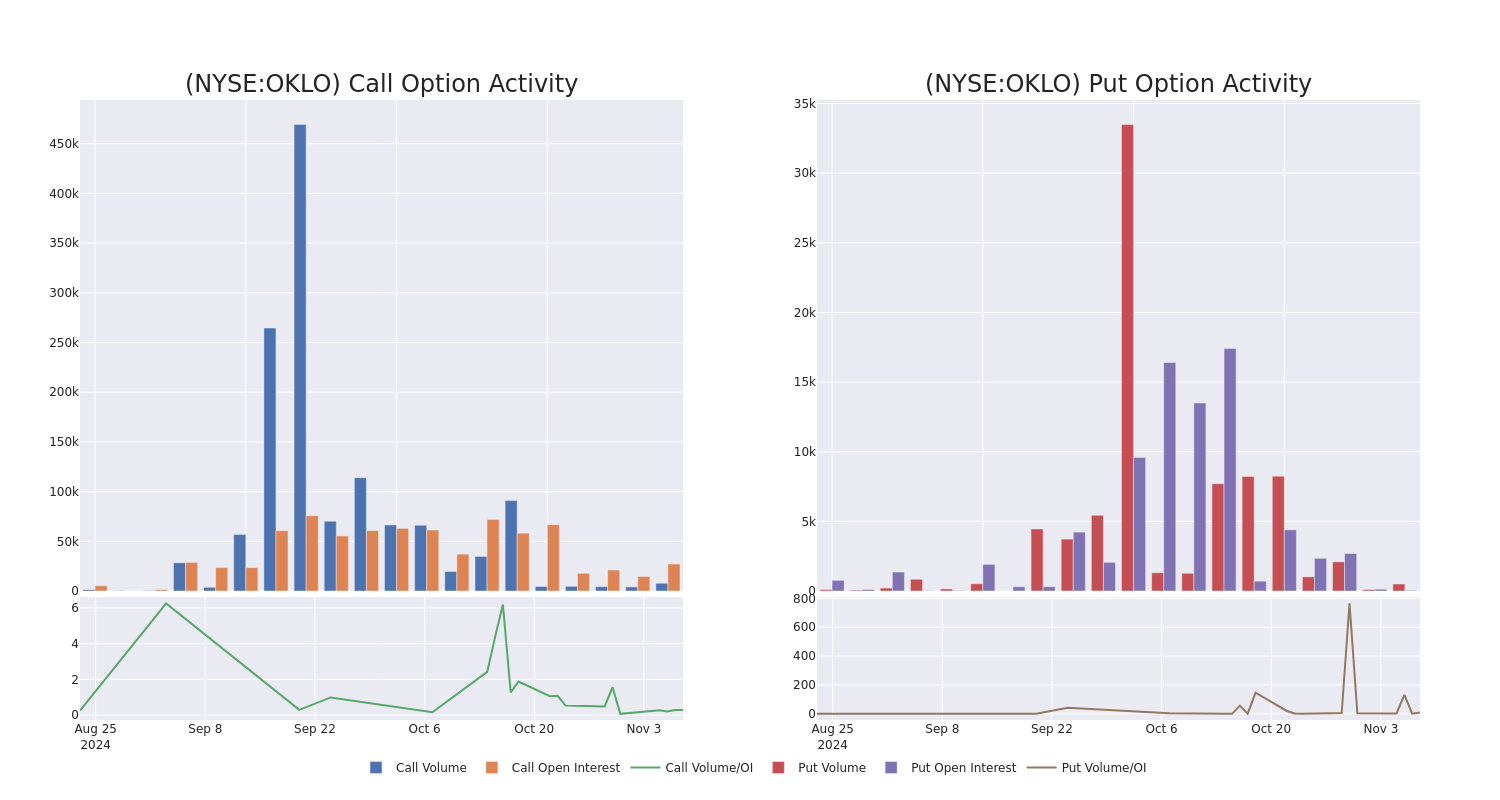
Assessing the volume and open interest is a strategic step in options trading. These metrics shed light on the liquidity and investor interest in Oklo’s options at specified strike prices. The forthcoming data visualizes the fluctuation in volume and open interest for both calls and puts, linked to Oklo’s substantial trades, within a strike price spectrum from $2.5 to $40.0 over the preceding 30 days.
Oklo Option Activity Analysis: Last 30 Days
Largest Options Trades Observed:
| Symbol | PUT/CALL | Trade Type | Sentiment | Exp. Date | Ask | Bid | Price | Strike Price | Total Trade Price | Open Interest | Volume |
|---|---|---|---|---|---|---|---|---|---|---|---|
| OKLO | CALL | TRADE | NEUTRAL | 01/17/25 | $5.2 | $5.0 | $5.1 | $25.00 | $510.0K | 3.1K | 1.2K |
| OKLO | CALL | SWEEP | BULLISH | 03/21/25 | $7.5 | $7.1 | $7.5 | $26.00 | $374.2K | 47 | 520 |
| OKLO | CALL | TRADE | NEUTRAL | 03/21/25 | $3.6 | $3.3 | $3.45 | $40.00 | $176.6K | 1.1K | 610 |
| OKLO | PUT | SWEEP | BULLISH | 11/22/24 | $2.4 | $2.25 | $2.25 | $24.00 | $112.5K | 49 | 506 |
| OKLO | CALL | TRADE | BEARISH | 11/15/24 | $6.2 | $5.1 | $5.4 | $21.00 | $94.5K | 940 | 177 |
About Oklo
Oklo Inc is developing advanced fission power plants to provide clean, reliable, and affordable energy at scale. It is pursuing two complementary tracks to address this demand: providing reliable, commercial-scale energy to customers; and selling used nuclear fuel recycling services to the U.S. market. The Company plans to commercialize its liquid metal fast reactor technology with the Aurora powerhouse product line. The first commercial Aurora powerhouse is designed to produce up to 15 megawatts of electricity (MWe) on both recycled nuclear fuel and fresh fuel.
Current Position of Oklo
- Trading volume stands at 18,810,980, with OKLO’s price down by -1.51%, positioned at $26.16.
- RSI indicators show the stock to be may be overbought.
- Earnings announcement expected in 6 days.
Turn $1000 into $1270 in just 20 days?
20-year pro options trader reveals his one-line chart technique that shows when to buy and sell. Copy his trades, which have had averaged a 27% profit every 20 days. Click here for access.
Options trading presents higher risks and potential rewards. Astute traders manage these risks by continually educating themselves, adapting their strategies, monitoring multiple indicators, and keeping a close eye on market movements. Stay informed about the latest Oklo options trades with real-time alerts from Benzinga Pro.
Market News and Data brought to you by Benzinga APIs
© 2024 Benzinga.com. Benzinga does not provide investment advice. All rights reserved.
President Of Delta Air Lines Makes $2.50M Sale
It was reported on November 7, that Glen W Hauenstein, President at Delta Air Lines DAL executed a significant insider sell, according to an SEC filing.
What Happened: A Form 4 filing with the U.S. Securities and Exchange Commission on Thursday outlined that Hauenstein executed a sale of 40,000 shares of Delta Air Lines with a total value of $2,502,360.
During Friday’s morning session, Delta Air Lines shares up by 0.65%, currently priced at $60.82.
About Delta Air Lines
Atlanta-based Delta Air Lines is one of the world’s largest airlines, with a network of over 300 destinations in more than 50 countries. Delta operates a hub-and-spoke network, where it gathers and distributes passengers across the globe through its biggest hubs in Atlanta, New York, Salt Lake City, Detroit, Seattle, and Minneapolis-St. Paul. Delta has historically earned most of its international revenue and profits from flying passengers over the Atlantic Ocean.
Key Indicators: Delta Air Lines’s Financial Health
Revenue Growth: Delta Air Lines’s remarkable performance in 3 months is evident. As of 30 September, 2024, the company achieved an impressive revenue growth rate of 1.22%. This signifies a substantial increase in the company’s top-line earnings. As compared to its peers, the revenue growth lags behind its industry peers. The company achieved a growth rate lower than the average among peers in Industrials sector.
Profitability Metrics:
-
Gross Margin: The company shows a low gross margin of 24.41%, indicating concerns regarding cost management and overall profitability relative to its industry counterparts.
-
Earnings per Share (EPS): With an EPS below industry norms, Delta Air Lines exhibits below-average bottom-line performance with a current EPS of 1.98.
Debt Management: The company maintains a balanced debt approach with a debt-to-equity ratio below industry norms, standing at 1.79.
Valuation Metrics:
-
Price to Earnings (P/E) Ratio: The P/E ratio of 8.38 is lower than the industry average, implying a discounted valuation for Delta Air Lines’s stock.
-
Price to Sales (P/S) Ratio: The P/S ratio of 0.65 is lower than the industry average, implying a discounted valuation for Delta Air Lines’s stock in relation to sales performance.
-
EV/EBITDA Analysis (Enterprise Value to its Earnings Before Interest, Taxes, Depreciation & Amortization): With a below-average EV/EBITDA ratio of 9.13, Delta Air Lines presents an opportunity for value investors. This lower valuation may attract investors seeking undervalued opportunities.
Market Capitalization: Surpassing industry standards, the company’s market capitalization asserts its dominance in terms of size, suggesting a robust market position.
Now trade stocks online commission free with Charles Schwab, a trusted and complete investment firm.
Why Insider Transactions Are Important
Investors should view insider transactions as part of a multifaceted analysis and not rely solely on them for decision-making.
Within the legal framework, an “insider” is defined as any officer, director, or beneficial owner holding more than ten percent of a company’s equity securities as per Section 12 of the Securities Exchange Act of 1934. This includes executives in the c-suite and major hedge funds. These insiders are mandated to disclose their transactions through a Form 4 filing, to be submitted within two business days of the transaction.
The initiation of a new purchase by a company insider serves as a strong indication that they expect the stock to rise.
However, insider sells may not always signal a bearish view and can be influenced by various factors.
Exploring Key Transaction Codes
Investors prefer focusing on transactions that take place in the open market, indicated in Table I of the Form 4 filing. A P in Box 3 indicates a purchase, while S indicates a sale. Transaction code C indicates the conversion of an option, and transaction code A indicates grant, award or other acquisition of securities from the company.
Check Out The Full List Of Delta Air Lines’s Insider Trades.
Insider Buying Alert: Profit from C-Suite Moves
Benzinga Edge reveals every insider trade in real-time. Don’t miss the next big stock move driven by insider confidence. Unlock this ultimate sentiment indicator now. Click here for access.
This article was generated by Benzinga’s automated content engine and reviewed by an editor.
Market News and Data brought to you by Benzinga APIs
© 2024 Benzinga.com. Benzinga does not provide investment advice. All rights reserved.
NexPoint Hospitality Trust Announces Third Quarter 2024 Financial Results
DALLAS and TORONTO, Nov. 8, 2024 /CNW/ — NexPoint Hospitality Trust (“NHT”1), NHT announced the release of NHT’s financial results for the nine months ended September 30, 2024. All amounts are expressed in U.S. dollars.
The table below presents net income from continuing operations, Funds from Operations (“FFO”) and Adjusted Funds from Operations (“AFFO”).
|
For the Nine Months Ended |
||||
|
September 30, 2024 |
September 30, 2023 |
|||
|
Net income |
$ 8.0 |
$ (11.3) |
||
|
FFO2 |
(5.0) |
(5.9) |
||
|
AFFO2 |
(11.2) |
(8.7) |
||
The table below presents Occupancy, ADR and RevPAR.
|
For the Nine Months Ended |
||||
|
September 30, |
September 30, |
|||
|
Occupancy |
67.7 % |
69.1 % |
||
|
ADR |
$ 146.97 |
$ 148.59 |
||
|
RevPAR |
$ 100.29 |
$ 102.13 |
||
Additional information on 2024 financial and operational results can be found at www.sedarplus.ca in our 2024 interim consolidated financial statements and management’s discussion and analysis (“MD&A”).
NHT Capitalization Updates
On July 26, 2024, the REIT paid down $18,435 of convertible notes, bringing the total principal convertible note balance from $81,081 to $62,646.
Non-IFRS Financial Measures
FFO and AFFO are key measures of performance commonly used by real estate operating companies and real estate investment trusts. They are not measures recognized under International Financial Reporting Standards (“IFRS”) and do not have standardized meanings prescribed by IFRS. FFO and AFFO may not be comparable to similar measures presented by other issuers in the real estate or lodging industries. For complete definitions of these measures, as well as an explanation of their composition and how the measures provide useful information to investors, please refer to the section titled “Non-IFRS Financial Measures” in NHT’s MD&A for the nine months ended September 30, 2024, which section is hereby incorporated herein by reference.
The following is a reconciliation of our net income to FFO and AFFO for the nine months ended September 30, 2024 and September 30, 2023
|
For the Nine Months Ended |
||||
|
September 30, |
September 30, |
|||
|
Net income (loss) |
$ 7,979 |
$ (11,290) |
||
|
Depreciation of property and equipment |
5,500 |
5,560 |
||
|
Depreciation of right-of-use asset |
— |
127 |
||
|
Fair value adjustment of Class B Units |
— |
(255) |
||
|
Fair value adjustment of convertible notes |
(18,512) |
— |
||
|
Funds from Operations |
(5,033) |
(5,858) |
||
|
FFO per unit – basic |
(0.17) |
(0.20) |
||
|
Income taxes |
249 |
(170) |
||
|
Core Funds from Operations |
(4,784) |
(6,028) |
||
|
CFFO per unit – basic |
(0.16) |
(0.21) |
||
|
FF&E reserve |
(7,055) |
(3,473) |
||
|
Amortization of deferred financing costs |
640 |
772 |
||
|
Adjusted Funds from Operations |
(11,199) |
(8,729) |
||
|
AFFO per unit – basic |
(0.38) |
(0.30) |
||
|
Weighted average units outstanding – basic |
29,352,055 |
29,352,055 |
||
About NHT
NexPoint Hospitality Trust is a publicly traded real estate investment trust, with its Units listed on the TSX Venture Exchange under the ticker NHT.U. NHT is focused on acquiring, owning and operating well-located real estate assets including, but not limited to, investments in life science and semiconductor manufacturing properties, but mainly focusing on hospitality properties in the United States that offer a high current yield and in many cases are underperforming assets with the potential to increase in value through investments in capital improvements, a market-based recovery, brand repositioning, revenue enhancements, operational improvements, expense inefficiencies, and exploiting excess land or underutilized space. NHT owns 7 branded properties sponsored by Marriott, Hilton and Hyatt, located across the U.S. NHT is externally advised by NexPoint Real Estate Advisors VI, L.P.
Neither TSX Venture Exchange nor its Regulation Services Provider (as that term is defined in policies of the TSX Venture Exchange) accepts responsibility for the adequacy or accuracy of this release.
Contact:
Investor Relations
IR@nexpoint.com
Media Inquiries
MediaRelations@nexpoint.com
1 In this release, “we,” “us,” “our,” and “NHT,” and the “REIT” each refer to NexPoint Hospitality Trust.
2 FFO and AFFO are non-IFRS measures. For a description of the basis of presentation and reconciliations of NHT’s non-IFRS measures, see “Non-IFRS Financial Measures” in this release.
SOURCE NexPoint Hospitality Trust

![]() View original content to download multimedia: http://www.newswire.ca/en/releases/archive/November2024/08/c3286.html
View original content to download multimedia: http://www.newswire.ca/en/releases/archive/November2024/08/c3286.html
Market News and Data brought to you by Benzinga APIs
© 2024 Benzinga.com. Benzinga does not provide investment advice. All rights reserved.
Scale In On Trump Hopium Dips – Watch Nvidia As An Indicator, Big China Stimulus
To gain an edge, this is what you need to know today.
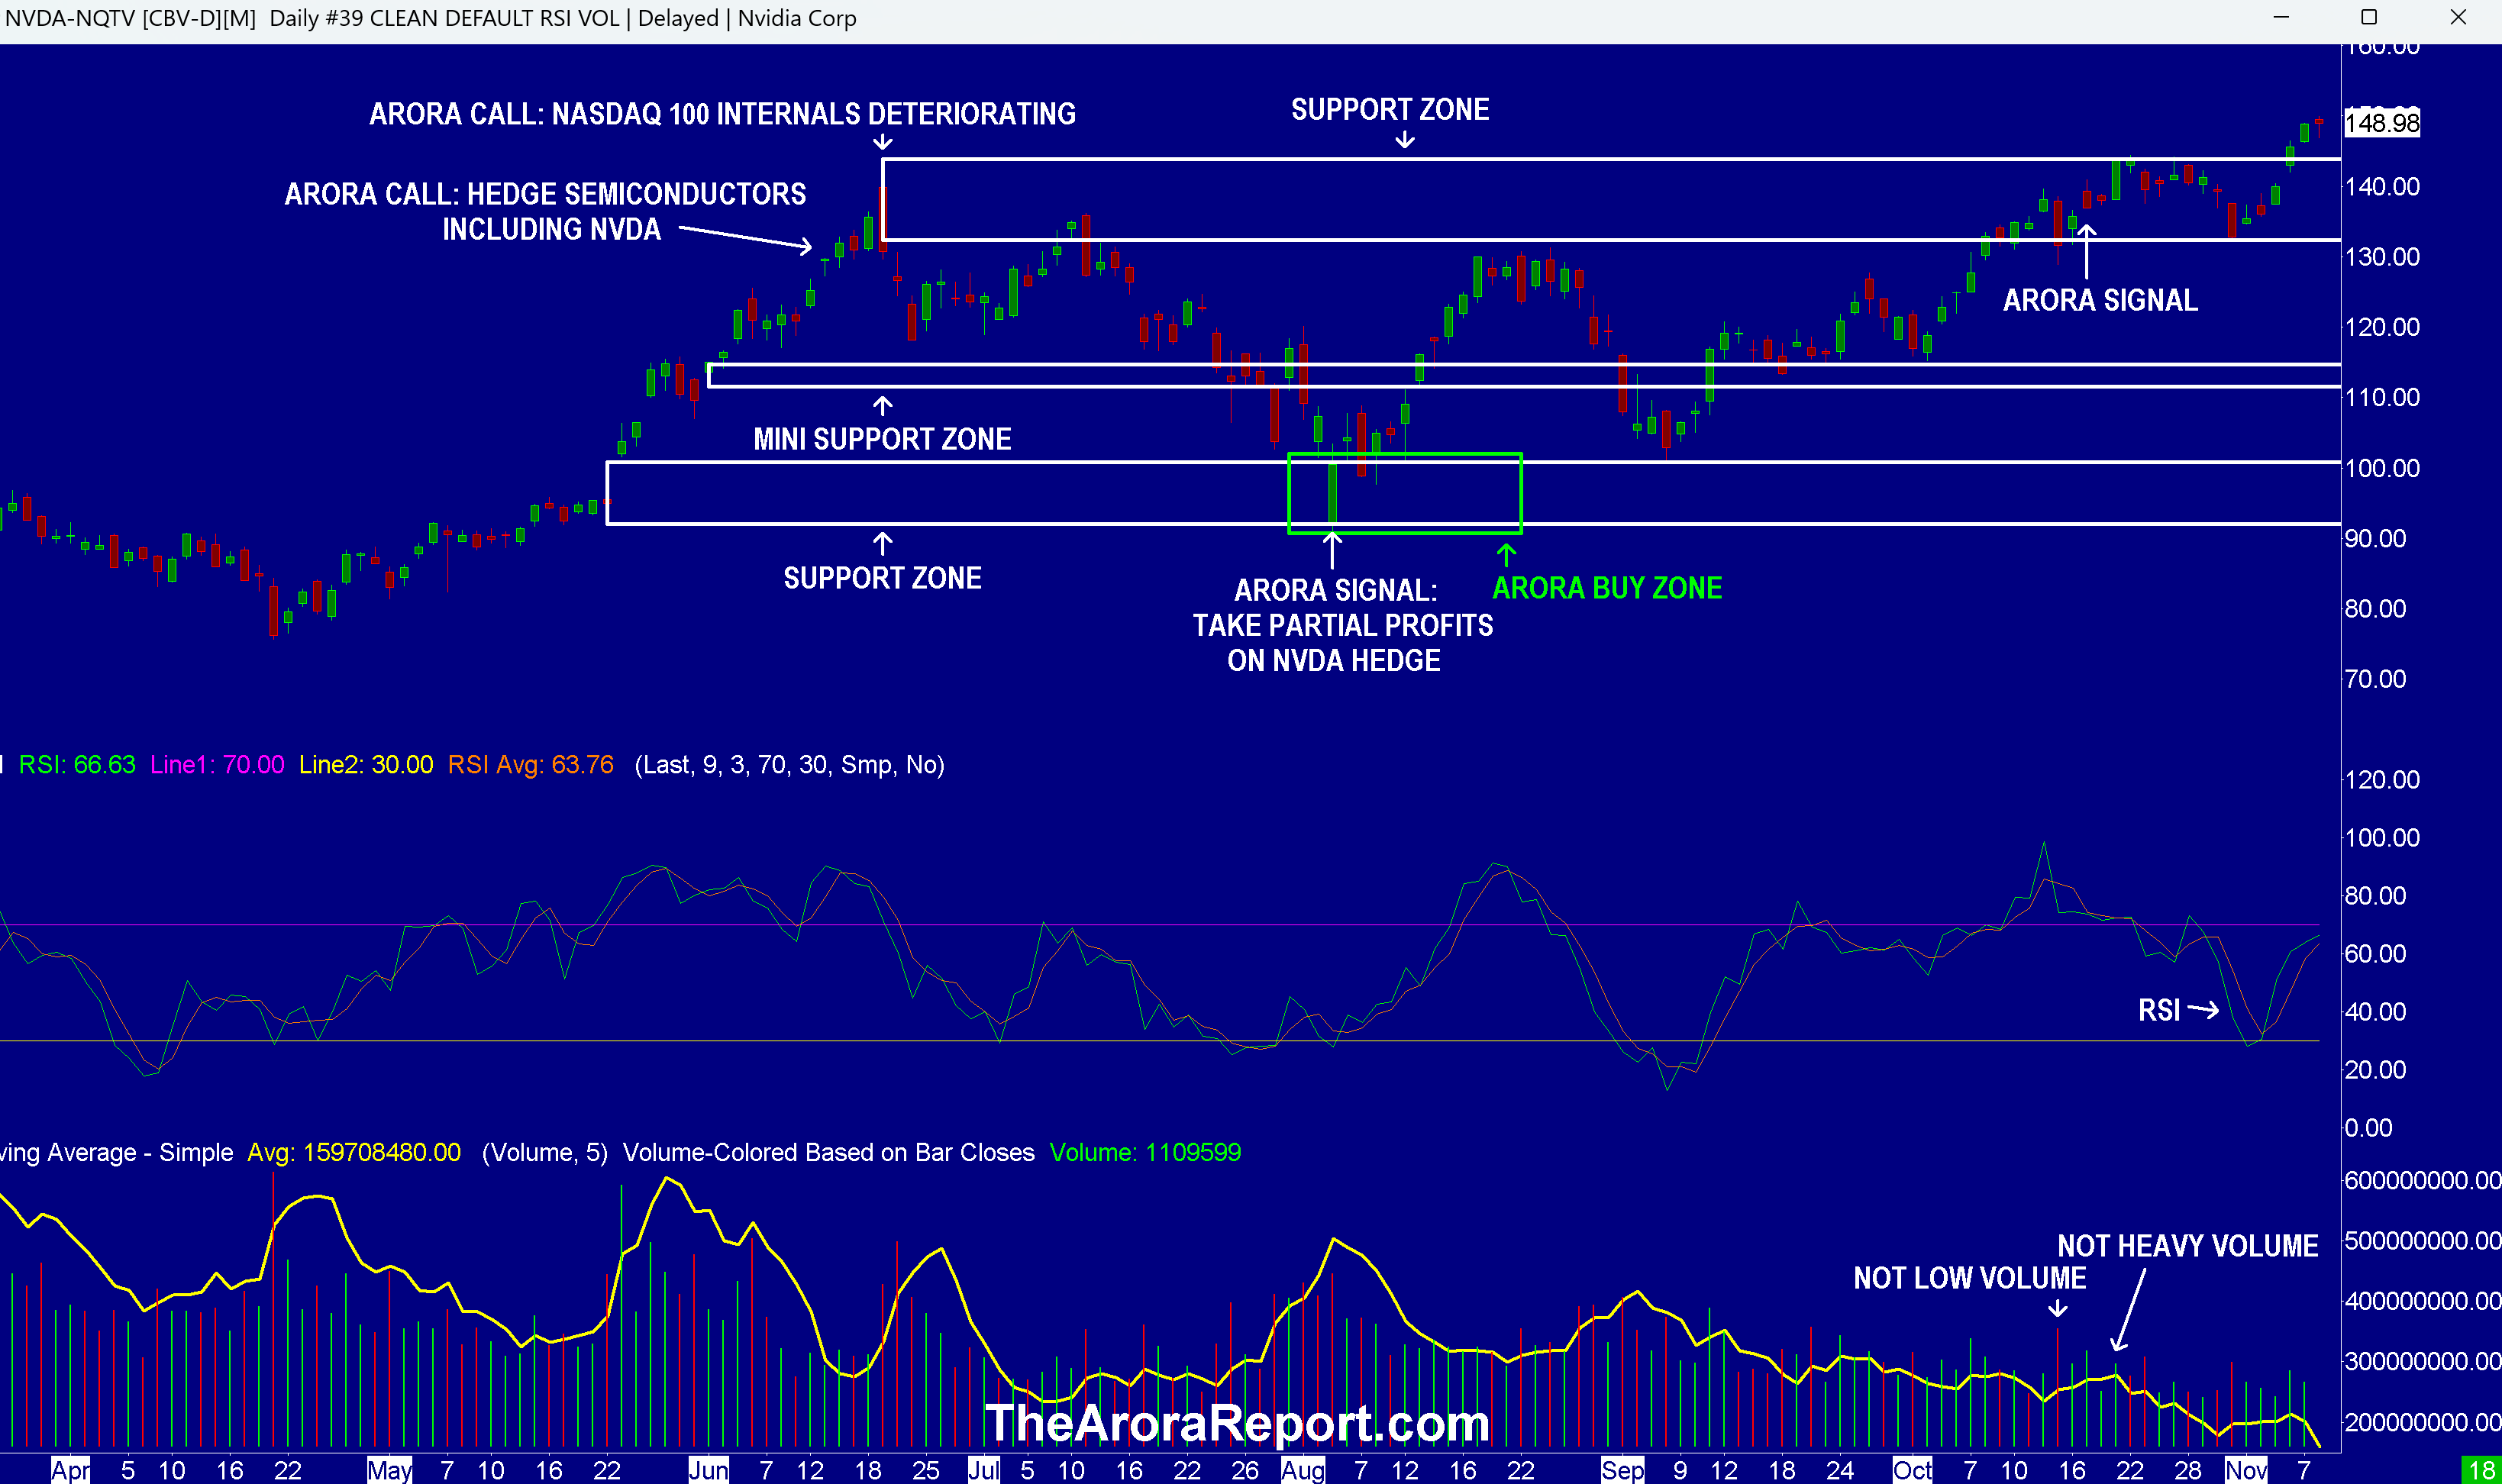
Nvidia As An Indicator
Please click here for an enlarged chart of NVIDIA Corp NVDA.
Note the following:
- This article is about the big picture, not an individual stock. The chart of NVDA stock is being used to illustrate the point.
- The chart shows that NVDA has broken out.
- RSI on the chart shows that NVDA has room to run.
- Nvidia will report earnings on Nov. 20 after the market close. Historically, NVDA stocks sees heavy buying before earnings. As full disclosure, in addition to the core position in NVDA, which is long from $12.55, The Arora Report also has a trade around position in NVDA in The Arora Report’s ZYX Buy.
- The chart shows the top support zone. This top support zone is very significant as an indicator for the entire market, not just NVDA stock.
- For the time being, as a simple short cut, investors can use Nvidia as an indicator. As long as NVDA stock does not break below the top support zone, investors’ stance towards the stock market should be bullish. The short cut is helpful but consider relying on the highly sophisticated, adaptive, ZYX Asset Allocation Model with inputs in 10 categories.
- The Arora Report call is to scale in by buying stocks and ETF’s, not just NVDA, as they dip in the buy zones until a time when Trump hopium comes close to meeting reality.
- In The Arora Report analysis, the time to take profits will be just before the Trump hopium comes close to meeting reality.
- The stock market is moving based on the difference between Wall Street positioning going into the election and the election result. In The Arora Report analysis, the main cause of the rip roaring rally after the election is two-fold:
- Wall Street was not positioned for the margin of Trump’s victory.
- Wall Street was not positioned for a potential red sweep. As of this writing, there is a high probability of a red sweep, but it is not yet confirmed. A red sweep will take place if Republicans take control of the House.
- Based on anecdotal evidence, it is difficult for many investors to put their arms around the current rally and The Arora Report’s call to buy the dips.
- In the early trade, the Trump rally is taking a breather for two reasons:
- Investors’ disappointment from China stimulus first impacted Asian markets, then moved to Europe, and now to the U.S. See the section below for details.
- In the very very short term, the stock market is overbought.
- The University of Michigan Consumer Sentiment – Prelim will be released at 10am ET. It may be market moving.
- In The Arora Report analysis, consumer sentiment has moved up significantly after Trump’s election.
Big China Stimulus
China has announced a big stimulus of $1.4T. The stimulus will provide swaps for debt ridden local governments’ off balance sheet liabilities. The size of the stimulus is greater than the consensus. For this reason, it should have been positive, but in The Arora Report analysis, investors are reacting negatively because the stimulus did not include any fiscal measures to boost the economy.
Magnificent Seven Money Flows
In the early trade, money flows are neutral in Apple Inc AAPL and Tesla Inc TSLA.
In the early trade, money flows are negative in Amazon.com, Inc. AMZN, Alphabet Inc Class C GOOG, Meta Platforms Inc META, Microsoft Corp MSFT, and NVDA.
In the early trade, money flows are negative in SPDR S&P 500 ETF Trust SPY and Invesco QQQ Trust Series 1 QQQ.
Momo Crowd And Smart Money In Stocks
Investors can gain an edge by knowing money flows in SPY and QQQ. Investors can get a bigger edge by knowing when smart money is buying stocks, gold, and oil. The most popular ETF for gold is SPDR Gold Trust GLD. The most popular ETF for silver is iShares Silver Trust SLV. The most popular ETF for oil is United States Oil ETF USO.
Bitcoin
Bitcoin BTC/USD is being bought on hope that whales will take advantage of low liquidity during the weekend to run bitcoin up over $80,000.
Protection Band And What To Do Now
It is important for investors to look ahead and not in the rearview mirror. The proprietary protection band from The Arora Report is very popular. The protection band puts all of the data, all of the indicators, all of the news, all of the crosscurrents, all of the models, and all of the analysis in an analytical framework that is easily actionable by investors.
Consider continuing to hold good, very long term, existing positions. Based on individual risk preference, consider a protection band consisting of cash or Treasury bills or short-term tactical trades as well as short to medium term hedges and short term hedges. This is a good way to protect yourself and participate in the upside at the same time.
You can determine your protection bands by adding cash to hedges. The high band of the protection is appropriate for those who are older or conservative. The low band of the protection is appropriate for those who are younger or aggressive. If you do not hedge, the total cash level should be more than stated above but significantly less than cash plus hedges.
A protection band of 0% would be very bullish and would indicate full investment with 0% in cash. A protection band of 100% would be very bearish and would indicate a need for aggressive protection with cash and hedges or aggressive short selling.
It is worth reminding that you cannot take advantage of new upcoming opportunities if you are not holding enough cash. When adjusting hedge levels, consider adjusting partial stop quantities for stock positions (non ETF); consider using wider stops on remaining quantities and also allowing more room for high beta stocks. High beta stocks are the ones that move more than the market.
Traditional 60/40 Portfolio
Probability based risk reward adjusted for inflation does not favor long duration strategic bond allocation at this time.
Those who want to stick to traditional 60% allocation to stocks and 40% to bonds may consider focusing on only high quality bonds and bonds of five year duration or less. Those willing to bring sophistication to their investing may consider using bond ETFs as tactical positions and not strategic positions at this time.
The Arora Report is known for its accurate calls. The Arora Report correctly called the big artificial intelligence rally before anyone else, the new bull market of 2023, the bear market of 2022, new stock market highs right after the virus low in 2020, the virus drop in 2020, the DJIA rally to 30,000 when it was trading at 16,000, the start of a mega bull market in 2009, and the financial crash of 2008. Please click here to sign up for a free forever Generate Wealth Newsletter.
Market News and Data brought to you by Benzinga APIs
© 2024 Benzinga.com. Benzinga does not provide investment advice. All rights reserved.
INVESTIGATION NOTICE: Girard Sharp Law Firm Encourages Evolv Technologies Holdings, Inc. (NASDAQ: EVLV) Investors with losses to Contact the Firm
SAN FRANCISCO, Nov. 08, 2024 (GLOBE NEWSWIRE) — Girard Sharp, LLP, a national investment, securities, and consumer class action firm, is investigating potential securities claims on behalf of Evolv Technologies EVLV investors.
If you are an Evolv Technologies Holdings, Inc. investor with losses, please fill out this form, email apolk@girardsharp.com, or call (866) 981-4800 for a free consultation.
On November 1, 2024, a complaint was filed detailing Evolv Technologies Holdings, Inc. and the alleged material misstatements in their financial statements during August 2022 to October 2024. According to the complaint, Evolv’s misconduct resulted in impacting revenue recognition and other metrics that are a function of revenue. In response to this news, Evolv’s stock has dropped by 40%. Additionally, it has been reported that as of October 31, 2024, CEO Peter George has announced his termination effective immediately.
If you are an Evolv Technologies Holdings, Inc. investor with losses, click here to participate.
We also encourage you to contact Adam Polk of Girard Sharp LLP, 601 California Street, Suite 1400, San Francisco, CA 94108, at (866) 981-4800, to discuss your rights free of charge. You can also reach us through the firm’s website at www.girardsharp.com, or by email at apolk@girardsharp.com.
Why Girard Sharp?
Girard Sharp represents investors, consumers, and institutions in class actions and other complex litigation nationwide. We recently obtained a $36.5 million securities settlement against Maxar Technologies, a space imagery company, after its share price collapsed following its acquisition of DigitalGlobe. Our attorneys have obtained multimillion-dollar recoveries for victims of unfair and deceptive practices in antitrust, financial fraud, and consumer protection matters against some of the country’s largest corporations, including Raymond James, John Hancock, and Sears. Girard Sharp has earned top-tier rankings from U.S. News and World Report for Securities and Class Action Litigation and has been repeatedly selected as an Elite Trial Lawyers finalist by the National Law Journal.
Contact
Girard Sharp LLP
(866) 981-4800

Market News and Data brought to you by Benzinga APIs
© 2024 Benzinga.com. Benzinga does not provide investment advice. All rights reserved.
Government of Canada announces program to boost homebuilding innovation in B.C.
New Regional Homebuilding Innovation Initiative will advance innovation and resilience in the homebuilding sector
VANCOUVER, BC, Nov. 8, 2024 /CNW/ – With vibrant communities, a strong economy, world class academic institutions and new business opportunities, British Columbia is growing quickly. This growth has significantly increased demand for housing, putting pressure on the local housing supply. In this changing environment, British Columbians need innovative approaches to homebuilding.
PacifiCan is one of several organizations working toward increasing the housing supply in British Columbia. Under Canada’s Housing Plan, the Government of Canada is taking action to address housing needs across the country.
Building tomorrow’s housing innovations, today
Today, the Honourable Harjit S. Sajjan, Minister of Emergency Preparedness and Minister responsible for the Pacific Economic Development Agency of Canada (PacifiCan), announced a new initiative that will help expand homebuilding options in B.C. and foster industry innovation to better meet the demands of our growing province and changing climate. As British Columbians look for solutions to alleviate local housing pressures, the Regional Homebuilding Innovation Initiative will propel innovative homebuilding ideas.
Through the Regional Homebuilding Innovation Initiative, the Government of Canada will invest $50 million over two years, beginning in 2024, to support innovation in the home construction sector and its supply chain. In British Columbia, PacifiCan will deliver $7.1 million in funding through this initiative.
The Government of Canada’s investment will advance innovative homebuilding solutions and boost homebuilding efficiency in B.C. and across Canada. This includes projects that advance modular and prefabrication technologies and approaches for more resilient construction.
Organizations in B.C. can now visit PacifiCan’s webpage to learn more about this initiative.
This initiative, an important part of Canada’s Housing Plan, is helping to build tomorrow’s housing solutions today. The Government of Canada is committed to helping businesses innovate and increase productivity in the housing construction sector, creating opportunities to build the homes Canadians need now and into the future.
Quotes
“British Columbians need innovative, sustainable approaches to homebuilding to meet increasing demand and to build climate resiliency in our communities. The Government of Canada is working hard to support businesses and increase productivity in this sector so that every British Columbian has a place to call home. The new Regional Homebuilding Innovation Initiative will bring us one step closer to that goal.”
-The Honourable Harjit S. Sajjan, Minister of Emergency Preparedness and Minister responsible for the Pacific Economic Development Agency of Canada
“Our government is taking bold action to address Canada’s housing crisis through innovation and strategic investments. The Regional Homebuilding Innovation Initiative will inject $50 million into modernizing and expediting homebuilding across the country. By supporting cutting-edge technologies like modular homes, net-zero 3D printing, and mass timber construction, we are building an innovative, efficient, and sustainable future for Canadian homebuilding. This initiative will boost productivity, strengthen supply chains, and ultimately help create more affordable housing options for Canadians.”
–The Honourable François-Philippe Champagne, Minister of Innovation, Science and Industry
Quick facts
- On April 12, 2024, the Prime Minister, alongside the Minister of Housing, Infrastructure and Communities, announced the federal government’s housing plan, Solving the Housing Crisis: Canada’s Housing Plan.
- The Regional Homebuilding Innovation Initiative is an important part of Canada’s Housing Plan that will provide support to pursue innovative approaches to homebuilding.
- Delivered by Canada’s Regional Development Agencies, the Regional Homebuilding Innovation Initiative is providing direct support to help enhance the local housing supply chain and advance innovation in the residential construction sector so that Canadians have a place to call home, sooner.
- PacifiCan will deliver $7.1 million under this initiative over the next two years, starting in 2024-2025.
Associated links
Stay connected
Follow PacifiCan on X and LinkedIn Toll-Free Number: 1-888-338-9378
TTY (telecommunications device for the hearing impaired): 1-877-303-3388
SOURCE Pacific Economic Development Canada

![]() View original content to download multimedia: http://www.newswire.ca/en/releases/archive/November2024/08/c4137.html
View original content to download multimedia: http://www.newswire.ca/en/releases/archive/November2024/08/c4137.html
Market News and Data brought to you by Benzinga APIs
© 2024 Benzinga.com. Benzinga does not provide investment advice. All rights reserved.
Massive Insider Trade At Enova International
It was reported on November 7, that Kirk Chartier, Chief Strategy Officer at Enova International ENVA executed a significant insider sell, according to an SEC filing.
What Happened: Chartier opted to sell 4,841 shares of Enova International, according to a Form 4 filing with the U.S. Securities and Exchange Commission on Thursday. The transaction’s total worth stands at $424,604.
Enova International‘s shares are actively trading at $99.8, experiencing a up of 0.5% during Friday’s morning session.
All You Need to Know About Enova International
Enova International Inc provides online financial services, including short-term consumer loans, line of credit accounts, and installment loans to customers mainly in the United States and the United Kingdom. Consumers apply for credit online, receive a decision almost immediately, and can receive funds within one day. Enova acts as either the lender or a third-party facilitator between borrowers and other lenders. The company earns revenue from interest income, finance charges, and other fees, including fees on the transactions between borrowers and third-party lenders. The majority of revenue comes from the United States. The company realizes similar amounts of revenue from each of its three different products: short-term loans, lines of credit, and installment loans.
A Deep Dive into Enova International’s Financials
Revenue Growth: Enova International’s revenue growth over a period of 3 months has been noteworthy. As of 30 September, 2024, the company achieved a revenue growth rate of approximately 25.13%. This indicates a substantial increase in the company’s top-line earnings. When compared to others in the Financials sector, the company excelled with a growth rate higher than the average among peers.
Analyzing Profitability Metrics:
-
Gross Margin: With a low gross margin of 46.88%, the company exhibits below-average profitability, signaling potential struggles in cost efficiency compared to its industry peers.
-
Earnings per Share (EPS): Enova International’s EPS is below the industry average, signaling challenges in bottom-line performance with a current EPS of 1.64.
Debt Management: Enova International’s debt-to-equity ratio surpasses industry norms, standing at 2.82. This suggests the company carries a substantial amount of debt, posing potential financial challenges.
Evaluating Valuation:
-
Price to Earnings (P/E) Ratio: Enova International’s P/E ratio of 15.81 is below the industry average, suggesting the stock may be undervalued.
-
Price to Sales (P/S) Ratio: With a P/S ratio of 1.15 below industry standards, the stock shows potential undervaluation, making it an appealing investment option for those focusing on sales performance.
-
EV/EBITDA Analysis (Enterprise Value to its Earnings Before Interest, Taxes, Depreciation & Amortization): The company’s EV/EBITDA ratio 19.81 is below the industry average, indicating that it may be relatively undervalued compared to peers.
Market Capitalization Analysis: Falling below industry benchmarks, the company’s market capitalization reflects a reduced size compared to peers. This positioning may be influenced by factors such as growth expectations or operational capacity.
Now trade stocks online commission free with Charles Schwab, a trusted and complete investment firm.
The Impact of Insider Transactions on Investments
Insider transactions shouldn’t be used primarily to make an investing decision, however an insider transaction can be an important factor in the investing decision.
Within the legal framework, an “insider” is defined as any officer, director, or beneficial owner holding more than ten percent of a company’s equity securities as per Section 12 of the Securities Exchange Act of 1934. This includes executives in the c-suite and major hedge funds. These insiders are mandated to disclose their transactions through a Form 4 filing, to be submitted within two business days of the transaction.
The initiation of a new purchase by a company insider serves as a strong indication that they expect the stock to rise.
However, insider sells may not always signal a bearish view and can be influenced by various factors.
Navigating the World of Insider Transaction Codes
Taking a closer look at transactions, investors often prioritize those unfolding in the open market, meticulously cataloged in Table I of the Form 4 filing. A P in Box 3 denotes a purchase, while S signifies a sale. Transaction code C denotes the conversion of an option, and transaction code A signifies a grant, award, or other acquisition of securities from the company.
Check Out The Full List Of Enova International’s Insider Trades.
Insider Buying Alert: Profit from C-Suite Moves
Benzinga Edge reveals every insider trade in real-time. Don’t miss the next big stock move driven by insider confidence. Unlock this ultimate sentiment indicator now. Click here for access.
This article was generated by Benzinga’s automated content engine and reviewed by an editor.
Market News and Data brought to you by Benzinga APIs
© 2024 Benzinga.com. Benzinga does not provide investment advice. All rights reserved.

