Asian Stocks Echo US Gains as Focus Turns to China: Markets Wrap
(Bloomberg) — Asian equities rallied after stocks and bonds and commodities all gained in the US as the Federal Reserve cut interest rates.
Most Read from Bloomberg
Australian, South Korean and Chinese shares all advanced, supporting a second day of gains for a region-wide equity gauge. That was after the S&P 500 rose 0.7% and the Nasdaq 100 climbed 1.5%, both setting fresh peaks. Treasuries ticked lower in Asia while US equity futures were little changed.
Investors are shifting focus from the Fed to China, where lawmakers are expected to approve a fiscal package worth trillions of yuan, potentially offsetting the impact of possible US trade tariffs under Donald Trump.
Such measures may include support for local government debt and consumer spending, according to Michelle Lam, greater China economist for Societe Generale. Any new policies must be balanced against the prospect of potential tariffs, she said, noting that the 60% levies mooted by Trump may fail to emerge.
“We have so much uncertainty coming from the US tariffs,” Lam said. “We might see some smaller increase in tariffs of around 15% to 20% and that is more reasonable” for the Chinese economy to absorb, she said.
Thursday’s cross-asset rally was helped along by comments from Fed Chair Jerome Powell who pointed to the strength of the US economy and said he doesn’t rule “out or in” a December rate cut. Powell added the election will have no effect on policy in the near term, and said he would not step aside if asked by Trump.
“Powell & Co. reminded investors about the solid economic footing the US continues to stand on,” said Bret Kenwell at eToro. “Powell would not tip his hand on whether the Fed would likely cut rates in December, which shouldn’t surprise investors. However, the Fed appears more comfortable with the labor market and the current US economic backdrop than they did a few months ago.”
Elsewhere in Asia, Nissan Motor’s shares fell as much as 10% in Tokyo, touching their lowest since October 2020, after the automaker said it will dismiss 9,000 workers and cut a fifth of its manufacturing capacity after net income plummeted in the first half.
Local Chinese banks are joining more higher-yielding offshore loans of mainland firms as rates fall at home amid monetary easing measures. South Korea said it will bolster its monitoring of financial markets and respond “actively” to ease any excessive volatility.
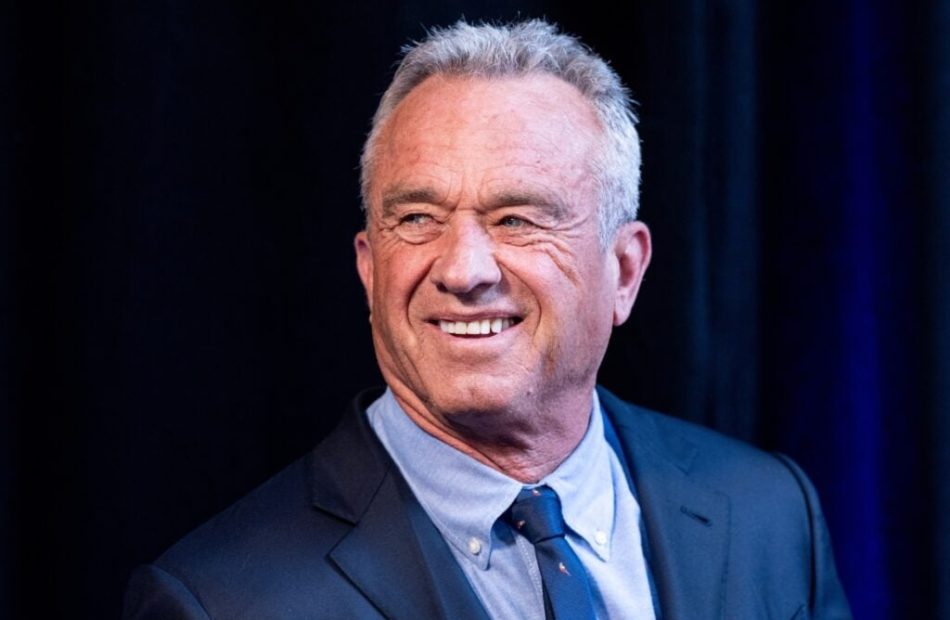
Could Trump's 'Go Wild On Health' Invite To RFK Jr. Drive Changes For Cannabis And Psychedelics?
President-elect Donald Trump has publicly suggested that Robert F. Kennedy Jr. could play a key role in his administration to drive forward his “Make America Healthy Again” agenda. While the exact nature of Kennedy’s appointment remains uncertain, Trump’s statements have stirred discussions about potential shifts in U.S. drug policy, particularly regarding cannabis and psychedelics, which Kennedy has been vocal about supporting.
What To Know: Trump’s Open Invitation For Kennedy To ‘Go Wild On Health’
Trump recently indicated that Kennedy would have significant influence, saying he would let him “go wild on health” and allow him to “do pretty much what he wants.” However, details remain unconfirmed, and no specific role has been formally announced.
Kennedy’s outspoken stances on cannabis and psychedelics suggest that, if given the authority, he could champion regulatory changes in these areas. However, his potential appointment has also prompted concerns, especially from public health advocates, about his past assertions on vaccines. Kennedy has previously promoted the debunked theory that vaccines are linked to autism, a claim thoroughly discredited by scientific studies, according to The New York Times. The U.S. has seen an increase in measles outbreaks recently, with the CDC reporting thirteen outbreaks in 2024 compared to four the previous year, a trend some link to declining vaccination rates.
Potential Influence On Cannabis Policy
Kennedy has expressed support for federal decriminalization of cannabis. In previous interviews, he proposed a model allowing states to regulate cannabis as they see fit while generating federal revenue from cannabis taxes to fund rehabilitation centers. These centers, which Kennedy envisions in rural areas, would focus on holistic recovery practices, including activities like gardening and forestry. His approach to cannabis reform centers on reducing federal barriers while using tax revenues for public health initiatives.
Another priority for Kennedy, should he influence federal cannabis policy, is securing safe banking access for the industry. Many cannabis businesses operate on a cash-only basis due to federal restrictions, increasing security risks and limiting financial service access. Kennedy has advocated for reforms that would integrate cannabis businesses into the formal banking sector, aiming to improve safety and efficiency within the industry.
Psychedelics Policy: Personal Experience Shapes Kennedy’s Stance
Kennedy’s views on psychedelics have been shaped by personal experiences and the growing acceptance of psychedelics as potential treatments for mental health conditions. In a podcast interview with the Genius Network, he recounted his son’s transformative experience with ayahuasca, a psychoactive substance, which Kennedy said helped him process grief. This experience, along with testimonies from veterans and athletes, has led Kennedy to support the decriminalization of psychedelics, particularly in therapeutic settings.
“My inclination would be to make them available, at least in therapeutic settings and maybe more generally, but in ways that would discourage corporate control and exploitation,” Kennedy shared, signaling a cautious approach to psychedelics legalization.
Looking Ahead: Will Kennedy Reshape Cannabis and Psychedelics Policy?
While Trump has promised Kennedy significant influence, the exact role and scope of his authority remain unclear. As details emerge, many will be watching to see if Kennedy can advance his pro-cannabis and psychedelics agenda within the new administration. His focus on individual liberties and health agency reform suggests he may push for more liberal policies regarding cannabis and psychedelics, though it’s unclear how these initiatives might align with broader federal policy.
Kennedy has hinted that he could serve as a “White House health czar,” giving him the latitude to guide health policy without directly leading any specific agency. However, the specifics remain fluid, and public health experts and investors alike will continue monitoring developments closely.
Photo: Shutterstock
Market News and Data brought to you by Benzinga APIs
© 2024 Benzinga.com. Benzinga does not provide investment advice. All rights reserved.
Veterans United Salutes America's Most Patriotic Cities
High marks for Veterans Day search trends, voting rate and Veteran-owned businesses place Crestview–Fort Walton Beach–Destin, Fla, Spokane, Wash., and Colorado Springs, Colo., as the Top 3
COLUMBIA, Mo., Nov. 7, 2024 /PRNewswire/ — With Veterans Day approaching, Veterans United Home Loans, the nation’s largest VA lender, today unveiled its list of The 10 Most Patriotic Cities in the U.S., showcasing the metros that are committed to their Veteran communities and the democratic process – two of the most patriotic qualities an American can demonstrate.
The top 10 in rank order are: Crestview-Fort Walton Beach Destin, Fla.; Spokane, Wash.; Colorado Springs, Colo.; Madison, Wis.; Salt Lake City, Utah; Columbia, S.C.; Springfield, Mo.; Allentown–Bethlehem–Easton, Pa.-N.J.; Minneapolis-St. Paul–Bloomington, Minn-Wis. and Columbus, Ga-Ala.
“The markets we’ve highlighted as the top patriotic cities in the U.S. stand out for the support they provide Veterans on a daily basis as well as for their community’s strong commitment to the democratic process,” Chris Birk, vice president of mortgage insight at Veterans United, said. “These are truly special places to live that showcase the best of what our nation offers, not just to the broader community, but especially to the Veterans and service members who’ve served and sacrificed to safeguard our freedoms.”
The most patriotic cities were identified based on Veteran population, the presence of VA health facilities and Veteran-owned businesses, voter turnout rate and the number of searches related to Veterans Day.
Although the top 10 cities rank high in each of the categories, they each show their patriotism in different ways.
Where Veterans call home
The Crestview–Fort Walton Beach–Destin and Colorado Springs metros have the largest Veteran populations, ranging around 17%. Columbus also has a strong Veteran presence with 13% of its residents having served in the military.*
Crestview–Fort Walton Beach–Destin is home to Eglin Air Force Base, one of the largest military bases in the country. The base offers a number of Veterans services, such as financial counseling, transition assistance and employment workshops offered by the base’s Airman and Family Readiness Center, making it a good place for Veterans to call home.
In addition to three military installations – the Air Force Academy, Fort Carson and Peterson Space Force Base – Colorado Springs offers service members employment and educational opportunities after their time in service. Major defense contractors such as Northrop Grumman, Lockheed Martin and Raytheon have locations in Colorado Springs, while the University of Colorado Springs and Pikes Peak State College offer dedicated Veteran service centers and advisors.
The Army’s largest training facility, Fort Jackson, is in Columbia. The base trains about half of all incoming soldiers entering the Army each year. The town’s Veterans Day parade is one of the largest in the Southeast.
Support for Veteran businesses
With relatively small numbers of Veteran populations, the Minneapolis, Allentown and Salt Lake City MSAs have a proportionally high number of Veteran-owned businesses. Estimates show that Veterans make up between 4-5% of Minneapolis’ population, and the metro is home to more than 3,500 Veteran-owned businesses. Allentown is home to 875 Veteran-owned businesses and Salt Lake boasts nearly 1,300, with Veteran populations about 5% and 4.2%, respectively.
Caring for our Veterans
With eight VA healthcare facilities in the metro, including the William S. Middleton Memorial Veterans Hospital, Madison scored highest among the top cities for access to healthcare relative to its Veteran population. Springfield ranked second for Veteran healthcare with the Gene Taylor Veterans’ Outpatient Clinic in the heart of the metro and four other health facilities throughout the surrounding area.
Also ranking high for VA healthcare facilities per Veteran was Spokane, with the Mann-Grandstaff Department of Veterans Affairs Medical Center offering care alongside six other locations, providing healthcare for around 40,000 Veterans. Despite its high number of Veterans, Crestview–Fort Walton Beach–Destin scored lower for VA health facilities.
Voter turnout
Voter participation in each of the top 10 metros was higher than the 66% national turnout for the 2020 election. Salt Lake City, Madison and Springfield had the highest turnouts with 90.1%, 89.3% and 83% of residents casting ballots in 2020, respectively.
The standard voter turnout metric considers the turnout of voters, compared to the number of registered voters in the area. When comparing the number of voters to the entire population, Springfield still scores exceptionally high at 67.7%, and nine of the 10 most patriotic cities score higher than the average for the 100 evaluated MSAs, which was 46.4% of the population.
Google: Where can I find Veterans Day celebrations?
Columbus led the most patriotic cities in Veterans Day searches on Google, most likely as result of the metro being home to the National Infantry Museum, events like the Tri-City Veterans Day Parade and initiatives such as “Veterans on Veterans,” a series of panel discussions where Veterans share their stories and connect with the community.
Colorado Springs placed second in Google queries due to a surge of searches for Veterans Day terms, as the Colorado Springs Veterans Day Parade. Initially canceled this year due to a lack of funding and participation, the parade was back on only a few days later due to public outcry. In announcing the event would take place, Colorado Springs Mayor Yemi Mobolade said, “Let’s show the world that Colorado Springs is a city that honors its Veterans not just with words but with actions. Let’s make this year’s parade the biggest and the best yet.”
Columbia ranked third for Google search trends among the top 10 patriotic cities, likely based on its large concentration of military retirees and the presence of Fort Jackson.
To read more about The 10 Most Patriotic Cities in the U.S., including city profiles and methodology, visit: https://www.veteransunited.com/education/most-patriotic-cities/
*Population estimates are based on the U.S. Census data.
About Veterans United Home Loans
Based in Columbia, Missouri, the full-service national direct lender financed more than $17 billion in loans in Fiscal Year 2023 and is the country’s largest VA lender, according to the Department of Veterans Affairs Lender Statistics. The company’s mission is to help Veterans and service members take advantage of the home loan benefits earned by their service.
VeteransUnited.com | 1-800-884-5560 | 550 Veterans United Drive, Columbia, MO 65201 | Veterans United Home Loans NMLS # 1907 (www.nmlsconsumeraccess.org). A VA approved lender; Not endorsed or sponsored by the Dept. of Veterans Affairs or any government agency. Licensed in all 50 states. For State Licensing information, please visit https://www.veteransunited.com/licenses/. Equal Opportunity Lender.
![]() View original content to download multimedia:https://www.prnewswire.com/news-releases/veterans-united-salutes-americas-most-patriotic-cities-302297703.html
View original content to download multimedia:https://www.prnewswire.com/news-releases/veterans-united-salutes-americas-most-patriotic-cities-302297703.html
SOURCE Veterans United Home Loans
© 2024 Benzinga.com. Benzinga does not provide investment advice. All rights reserved.
St. Joe Insider Trades Send A Signal
On November 6, a recent SEC filing unveiled that BRUCE BERKOWITZ, 10% Owner at St. Joe JOE made an insider sell.
What Happened: A Form 4 filing from the U.S. Securities and Exchange Commission on Wednesday showed that BERKOWITZ sold 388,400 shares of St. Joe. The total transaction amounted to $20,676,880.
St. Joe shares are trading up 0.26% at $53.4 at the time of this writing on Thursday morning.
About St. Joe
The St. Joe Co is a real estate development, asset management, and operating company and it has three operating segments; the Residential segment plans and develops residential communities and sells homesites to homebuilders or retail consumers, the Hospitality segment features a private membership club (the Watersound Club), hotel operations, food and beverage operations, golf courses, beach clubs, retail outlets, gulf-front vacation rentals, management services, marinas, and other entertainment assets, and Commercial segment include leasing of commercial property, multi-family, senior living, self-storage, and other assets and it also oversees the planning, development, entitlement, management, and sale of commercial and rural land holdings.
St. Joe: Delving into Financials
Revenue Challenges: St. Joe’s revenue growth over 3 months faced difficulties. As of 30 September, 2024, the company experienced a decline of approximately -2.35%. This indicates a decrease in top-line earnings. As compared to its peers, the company achieved a growth rate higher than the average among peers in Real Estate sector.
Holistic Profitability Examination:
-
Gross Margin: The company shows a low gross margin of 38.03%, suggesting potential challenges in cost control and profitability compared to its peers.
-
Earnings per Share (EPS): St. Joe’s EPS is a standout, portraying a positive bottom-line trend that exceeds the industry average with a current EPS of 0.29.
Debt Management: St. Joe’s debt-to-equity ratio surpasses industry norms, standing at 0.88. This suggests the company carries a substantial amount of debt, posing potential financial challenges.
Insights into Valuation Metrics:
-
Price to Earnings (P/E) Ratio: The current Price to Earnings ratio of 45.64 is higher than the industry average, indicating the stock is priced at a premium level according to the market sentiment.
-
Price to Sales (P/S) Ratio: The current P/S ratio of 8.09 is above industry norms, reflecting an elevated valuation for St. Joe’s stock and potential overvaluation based on sales performance.
-
EV/EBITDA Analysis (Enterprise Value to its Earnings Before Interest, Taxes, Depreciation & Amortization): St. Joe’s EV/EBITDA ratio stands at 21.58, surpassing industry benchmarks. This places the company in a position with a higher-than-average market valuation.
Market Capitalization Analysis: The company’s market capitalization surpasses industry averages, showcasing a dominant size relative to peers and suggesting a strong market position.
Now trade stocks online commission free with Charles Schwab, a trusted and complete investment firm.
Navigating the Impact of Insider Transactions on Investments
Insider transactions shouldn’t be used primarily to make an investing decision, however an insider transaction can be an important factor in the investing decision.
Exploring the legal landscape, an “insider” is defined as any officer, director, or beneficial owner holding more than ten percent of a company’s equity securities, as stipulated by Section 12 of the Securities Exchange Act of 1934. This encompasses executives in the c-suite and major hedge funds. These insiders are required to report their transactions through a Form 4 filing, which must be submitted within two business days of the transaction.
Highlighted by a company insider’s new purchase, there’s a positive anticipation for the stock to rise.
But, insider sells may not necessarily indicate a bearish view and can be motivated by various factors.
Transaction Codes To Focus On
When analyzing transactions, investors tend to focus on those in the open market, detailed in Table I of the Form 4 filing. A P in Box 3 denotes a purchase,while S signifies a sale. Transaction code C signals the conversion of an option, and transaction code A denotes a grant, award, or other acquisition of securities from the company.
Check Out The Full List Of St. Joe’s Insider Trades.
Insider Buying Alert: Profit from C-Suite Moves
Benzinga Edge reveals every insider trade in real-time. Don’t miss the next big stock move driven by insider confidence. Unlock this ultimate sentiment indicator now. Click here for access.
This article was generated by Benzinga’s automated content engine and reviewed by an editor.
© 2024 Benzinga.com. Benzinga does not provide investment advice. All rights reserved.
Pason Reports Third Quarter 2024 Results and Declares Quarterly Dividend
CALGARY, AB, Nov. 7, 2024 /CNW/ – Pason Systems Inc. (“Pason” or the “Company”) PSI announced today its 2024 third quarter results and the declaration of a quarterly dividend. The following news release should be read in conjunction with the Company’s Management Discussion and Analysis (“MD&A”), the unaudited Condensed Consolidated Interim Financial Statements and related notes for the three and nine months ended September 30, 2024, as well as the Annual Information Form for the year ended December 31, 2023. All of these documents are available on SEDAR+ at www.sedarplus.ca.
Financial Highlights
|
Three Months Ended September 30, |
Nine Months Ended September 30, |
|||||||||
|
2024 |
2023 |
Change |
2024 |
2023 |
Change |
|||||
|
(CDN 000s, except per share data) |
($) |
($) |
( %) |
($) |
($) |
( %) |
||||
|
North American Drilling Revenue |
74,141 |
72,163 |
3 |
211,510 |
219,256 |
(4) |
||||
|
International Drilling Revenue |
15,327 |
15,313 |
— |
45,243 |
45,883 |
(1) |
||||
|
Completions Revenue (3) |
12,512 |
— |
nmf |
38,963 |
— |
nmf |
||||
|
Solar and Energy Storage Revenue |
3,909 |
5,618 |
(30) |
10,788 |
10,875 |
(1) |
||||
|
Total Revenue |
105,889 |
93,094 |
14 |
306,504 |
276,014 |
11 |
||||
|
Adjusted EBITDA (1) |
44,148 |
42,281 |
4 |
119,708 |
132,578 |
(10) |
||||
|
As a % of revenue |
41.7 |
45.4 |
(370) bps |
39.1 |
48.0 |
(890) bps |
||||
|
Funds flow from operations |
36,119 |
40,233 |
(10) |
99,009 |
117,017 |
(15) |
||||
|
Per share – basic |
0.45 |
0.50 |
(9) |
1.24 |
1.45 |
(14) |
||||
|
Per share – diluted |
0.45 |
0.50 |
(9) |
1.24 |
1.45 |
(14) |
||||
|
Cash from operating activities |
30,375 |
31,698 |
(4) |
87,365 |
107,621 |
(19) |
||||
|
Net capital expenditures (2) |
13,721 |
6,682 |
105 |
50,947 |
29,907 |
70 |
||||
|
Free cash flow (1) |
16,654 |
25,016 |
(33) |
36,418 |
77,714 |
(53) |
||||
|
Cash dividends declared (per share) |
0.13 |
0.12 |
8 |
0.39 |
0.36 |
8 |
||||
|
Net income |
23,717 |
27,399 |
(13) |
103,124 |
87,815 |
17 |
||||
|
Net income attributable to Pason |
24,158 |
27,732 |
(13) |
104,577 |
89,044 |
17 |
||||
|
Per share – basic |
0.30 |
0.35 |
(13) |
1.31 |
1.10 |
19 |
||||
|
Per share – diluted |
0.30 |
0.35 |
(13) |
1.31 |
1.10 |
19 |
||||
|
As at |
September 30, 2024 |
December 31, 2023 |
Change |
|||||||
|
(CDN 000s) |
($) |
($) |
( %) |
|||||||
|
Cash and cash equivalents |
70,848 |
171,773 |
(59) |
|||||||
|
Short-term investments |
3,101 |
— |
nmf |
|||||||
|
Total Cash (1) |
73,949 |
171,773 |
(57) |
|||||||
|
Working capital |
118,059 |
212,561 |
(44) |
|||||||
|
Total interest bearing debt |
— |
— |
— |
|||||||
|
Shares outstanding end of period (#) |
79,621,109 |
79,685,025 |
nmf |
|||||||
|
(1) |
Non-GAAP and supplementary financial measures are defined under Non-GAAP Financial Measures in this press release. |
|
(2) |
Includes additions to property, plant, and equipment and development costs, net of proceeds on disposal from Pason’s Condensed Consolidated Interim Statements of Cash Flows |
|
(3) |
The Completions segment includes results generated by IWS, which were not part of the Company’s consolidated reporting group until January 1, 2024 following the IWS Acquisition |
Pason generated $105.9 million in consolidated revenue in the third quarter of 2024, representing a 14% increase from the $93.1 million generated in the comparative period of 2023 and a result that continues to outpace the changes in underlying North American industry drilling activity.
The North American Drilling business unit generated $74.1 million of revenue in the third quarter of 2024, a 3% increase over the comparative period of 2023 despite a 5% decline in North American industry drilling activity. Pason’s Revenue per Industry Day in the third quarter of 2024 of $1,058 increased by 9% from the comparative 2023 period. Revenue per Industry Day in the current quarter represents increased product adoption across Pason’s technology offering and benefited from strength in the US dollar versus the Canadian dollar. Segment gross profit of $45.5 million during the third quarter of 2024 compared to $44.2 million in the comparative period of 2023 demonstrates the Company’s ability to outpace industry activity levels on a mostly fixed cost base.
The International Drilling business unit generated $15.3 million of revenue in the third quarter of 2024, a level comparable to the third quarter of 2023. Gross profit was impacted by higher levels of depreciation and amortization expense in the current quarter and declined slightly from $7.9 million in Q3 2023 to $7.6 million in Q3 2024.
The Company’s new Completions business unit, formed after the acquisition of IWS on January 1, 2024, generated $12.5 million in revenue while averaging 28 IWS Active Jobs with Revenue per IWS day of $4,868 through very challenging industry conditions in the third quarter. Segment gross profit of $0.3 million in the quarter includes $5.1 million of depreciation and amortization expense, of which $2.2 million relates to amortization expense on intangible assets acquired through the IWS Acquisition.
Revenue generated by the Solar and Energy Storage business unit was $3.9 million, a $1.7 million decrease from the comparative period in 2023 due to the timing of revenue recognized on the delivery of control systems. Resulting segment gross profit was $0.4 million for the third quarter of 2024 compared to a segment gross profit of $0.6 million in the comparable period in 2023.
Pason generated $44.1 million in Adjusted EBITDA, or 41.7% of revenue in the third quarter of 2024, compared to $42.3 million or 45.4% of revenue in the third quarter of 2023, highlighting the Company’s mostly fixed cost base and associated operating leverage. A comparison of Adjusted EBITDA margin year over year reflects the inclusion of IWS financial results at lower margins, reflecting the Completions segment’s investments made for its current stage of growth.
The Company recorded net income attributable to Pason of $24.2 million ($0.30 per share) in the third quarter of 2024, compared to net income attributable to Pason of $27.7 million ($0.35 per share) recorded in the corresponding period in 2023. The year over year increase in Adjusted EBITDA was offset by higher levels of depreciation and amortization with increased capital expenditures in recent quarters, as well as amortization of fixed assets and intangibles acquired through the IWS acquisition in the first quarter of 2024. Further, the Company saw lower levels of interest income year over year with lower average cash balances in 2024, and a declining interest rate environment in Canada.
Sequentially, Q3 2024 consolidated revenue of $105.9 million was a 10% increase from consolidated revenue of $95.9 million generated in the second quarter of 2024 largely driven by improved drilling activity in Canada coming out of seasonal lows in the second quarter. Highlighting the Company’s mostly fixed cost base and significant operating leverage, Adjusted EBITDA was $44.1 million in the third quarter of 2024 compared to $33.1 million in the second quarter of 2024.
The Company recorded net income attributable to Pason in the third quarter of 2024 of $24.2 million ($0.30 per share) compared to net income attributable to Pason of $10.9 million ($0.14 per share) in the second quarter of 2024 where the increase is primarily driven by the factors noted above, along with lower stock based compensation expense in the third quarter which reflects changes in the Company’s share price.
Pason’s balance sheet remains strong, with no interest bearing debt, and $73.9 million in Total Cash as at September 30, 2024, compared to $171.8 million as at December 31, 2023. The decrease is the result of funding the IWS Acquisition in Q1 2024 with a total of $88.2 million in cash and the repayment of $13.3 million in interest bearing debt assumed through the acquisition. Pason generated cash from operating activities of $30.4 million in the third quarter of 2024, compared to $31.7 million in the third quarter of 2023, with the increase in Adjusted EBITDA being offset by lower levels of interest income recognized.
During the three months ended September 30, 2024, Pason invested $13.7 million in net capital expenditures, an increase from $6.7 million in the third quarter of 2023 as the Company executes on its 2024 capital budget. Net capital expenditures in the current quarter includes investments associated with supporting the continued growth of IWS’ pressure automation technology offering, for which there would be no associated capital expenditures during the 2023 comparative period given the effective date of the IWS Acquisition was January 1, 2024. Net capital expenditures in Q3 2024 also includes investments associated with the ongoing refresh of Pason’s drilling related technology platform and continued investments in the new Pason Mud Analyzer. Resulting Free Cash Flow in the third quarter of 2024 was $16.7 million, compared to $25.0 million in the same period in 2023.
In the third quarter of 2024, Pason returned $11.3 million to shareholders through the Company’s quarterly dividend of $10.3 million and $1.0 million in share repurchases. Year to date, Pason returned $38.0 million to shareholders through the Company’s quarterly dividend of $31.0 million and $7.0 million in share repurchases.
President’s Message
Pason’s President and Chief Executive Officer Jon Faber stated:
“The resilience of Pason’s business was demonstrated in our financial and operating results for the third quarter of 2024. Consolidated revenue increased by 14% compared to the third quarter of 2023, while North American land drilling activity decreased by 5% year-over-year.”
“As a daily rental business, our results will be strongly influenced by activity levels, but we remain focused on outpacing underlying North American land drilling activity in three ways: (1) growing Revenue per Industry Day in North America, primarily through increased product adoption and technology enhancements; (2) increasing revenue from international drilling markets; and (3) generating revenue from less mature, higher growth markets including technology offerings in the completions market and solar and energy storage. By focusing on these three priorities, we expect to be able to achieve meaningful growth and strong financial results even in periods of flat North American land drilling activity.”
“North American Revenue per Industry Day of $1,058 in the third quarter represented a 9% increase from 2023. On a year-to-date basis, North American Revenue per Industry Day was also up 9% at $1,018 per industry day. North American Drilling revenue increased by 3% year-over-year to $74.1 million in the third quarter, while International Drilling was unchanged year-over-year at $15.3 million.”
“Our Completions segment generated revenue of $12.5 million in the third quarter, with the sequential decline in revenue from the second quarter mirroring the decline in the reported number of frac spreads in the United States. Given its stage of development, Intelligent Wellhead Systems (“IWS”) is much more sensitive to customer mix and changes in the activity of specific customers than our drilling-related businesses, where our financial results are more strongly correlated to overall industry activity given our substantial market share. IWS continued to post strong Revenue per IWS Day, at $4,868 in the third quarter on 28 IWS Active Jobs in the quarter. Revenue per IWS Day will fluctuate between quarters based on job type and customer mix.”
“Energy Toolbase (“ETB”) generated revenue of $3.9 million in the third quarter, up 24% sequentially from the second quarter of 2024, driven primarily by increased sales of control systems. Quarterly revenue for the Solar and Energy Storage segment will fluctuate with the timing of control system deliveries, and the 30% year-over-year decline in third quarter revenue was the result of additional control system deliveries in the prior year period. Our pipeline of control systems sales and opportunities remains robust.”
“Adjusted EBITDA of $44.1 million represented a 4% increase from the third quarter of 2023 and a 33% sequential increase from the second quarter of 2024. The $11 million sequential increase in Adjusted EBITDA exceeded the $10 million sequential revenue increase, highlighting the operating leverage in our business and continued cost discipline. Free Cash Flow decreased by 33% year-over-year to $16.7 million in the quarter, reflecting our increased capital expenditures with the full inclusion of IWS in 2024, while sequentially Free Cash Flow increased by $8.6 million. Net income attributable to Pason totaled $23.7 million in the third quarter.”
In the first nine months of 2024, we returned $38.0 million to shareholders through our regular dividend and share repurchases. Net capital expenditures for the first nine months totaled $50.9 million.”
“Drilling and completions activity continued to soften in the third quarter, with US land drilling activity down 3% sequentially from the second quarter and US completions down 8% over the same period. We expect that North American land drilling will remain near current levels in the remainder of 2024 before beginning to increase in 2025, with completions activity following a similar trajectory.”
“The gains we have made in (1) increasing North American Revenue per Industry Day in our drilling segment and (2) expanding our customer base while maintaining a strong Revenue per IWS Day in our completions business should translate into continued outperformance against industry conditions. We continue to prioritize flexibility within our approach to shareholder returns and our quarterly dividend remains unchanged at $0.13 per share. We will make required capital investments in both our drilling and completion segments to position ourselves for further free cash flow generation and expect to spend approximately $70 million in capital expenditures in 2024, which is lower than the $75 million to $80 million range previously provided, and approximately $65 million in 2025.”
“As customers continue to deploy data-driven automation and analytics technologies in their operations, our drilling and completions-related businesses stand to benefit. Our innovative new drilling mud analyzer provides continuous, real-time readings of critical drilling mud parameters and we are seeing higher adoption of our automation products. Our wellsite automation products provide valuable safety and efficiency benefits for customers in their completions operations, and we are working closely with customers to develop compelling data aggregation and management solutions for the completions market, benefiting both operators and service companies. Our technology solutions are supported by a best-in-class service and support organization.”
“Our continued success remains rooted in the quality of our product and service offering, the dedication of our people, and the confidence of our customers and shareholders” concluded Mr. Faber.
Quarterly Dividend
Pason announced today that the Board of Directors have declared a quarterly dividend of thirteen cents (C$0.13) per share on the company’s common shares. The dividend will be paid on December 31, 2024, to shareholders of record at the close of business on December 17, 2024.
Third Quarter Conference Call
Pason will be conducting a conference call for interested analysts, brokers, investors, and media representatives to review its 2024 third quarter results at 9:00 a.m. (MT) on Friday, November 8, 2024. The conference call dial-in numbers are 1-888-510-2154 or 1-437-900-0527, and the call will be simultaneously audio webcast via: www.pason.com/webcast. You can access the fourteen-day replay by dialing 1-888-660-6345 or 1-289-819-1450, using password 06411#.
An archived audio webcast of the conference call will also be available on Pason’s website at www.pason.com/investors.
Non-GAAP Financial Measures
A non-GAAP financial measure has the definition set out in National Instrument 52-112 “Non-GAAP and Other Financial Measures Disclosure”.
The following non-GAAP measures may not be comparable to measures used by other companies. Management believes these non-GAAP measures provide readers with additional information regarding the Company’s operating performance, and ability to generate funds to finance its operations, fund its research and development and capital expenditure program, and return capital to shareholders through dividends or share repurchases.
EBITDA and Adjusted EBITDA
EBITDA is defined as net income before interest income and expense, income taxes, stock-based compensation expense, and depreciation and amortization expense. Adjusted EBITDA is defined as EBITDA, adjusted for foreign exchange, impairment of property, plant, and equipment, restructuring costs, net monetary adjustments, government wage assistance, revaluation of put obligation, gain or loss on mark-to-market of short-term investments, gain on previously held equity interest and other items, which the Company does not consider to be in the normal course of continuing operations.
Management believes that EBITDA and Adjusted EBITDA are useful supplemental measures as they provide an indication of the results generated by the Company’s principal business activities prior to the consideration of how these results are taxed in multiple jurisdictions, how the results are impacted by foreign exchange or how the results are impacted by the Company’s accounting policies for equity-based compensation plans.
Reconcile Net Income to EBITDA
|
Three Months Ended |
Dec 31, |
Mar 31, |
Jun 30, |
Sep 30, |
Dec 31, |
Mar 31, |
Jun 30, |
Sep 30, |
|
(000s) |
($) |
($) |
($) |
($) |
($) |
($) |
($) |
($) |
|
Net income |
35,994 |
35,454 |
24,962 |
27,399 |
8,012 |
69,123 |
10,284 |
23,717 |
|
Add: |
||||||||
|
Income taxes |
9,405 |
12,374 |
7,906 |
7,356 |
6,710 |
9,057 |
6,048 |
6,148 |
|
Depreciation and amortization |
5,399 |
6,616 |
5,815 |
6,988 |
7,797 |
11,730 |
12,901 |
13,659 |
|
Stock-based compensation |
5,129 |
(82) |
1,986 |
5,082 |
4,732 |
3,011 |
4,634 |
(117) |
|
Net interest (income) expense |
(2,679) |
(2,607) |
(2,847) |
(3,858) |
(5,082) |
(1,411) |
(522) |
(803) |
|
EBITDA |
53,248 |
51,755 |
37,822 |
42,967 |
22,169 |
91,510 |
33,345 |
42,604 |
Reconcile EBITDA to Adjusted EBITDA
|
Three Months Ended |
Dec 31, |
Mar 31, |
Jun 30, |
Sep 30, |
Dec 31, |
Mar 31, |
Jun 30, |
Sep 30, |
|
(000s) |
($) |
($) |
($) |
($) |
($) |
($) |
($) |
($) |
|
EBITDA |
53,248 |
51,755 |
37,822 |
42,967 |
22,169 |
91,510 |
33,345 |
42,604 |
|
Add: |
||||||||
|
Foreign exchange loss (gain) |
1,959 |
233 |
1,597 |
681 |
14,247 |
714 |
(1,202) |
(1,245) |
|
Put option revaluation |
(5,815) |
— |
— |
— |
(149) |
— |
— |
— |
|
Net monetary gain |
(536) |
(159) |
(1,196) |
(1,477) |
— |
— |
— |
— |
|
Gain on previously held equity interest |
— |
— |
— |
— |
— |
(50,830) |
— |
— |
|
Unrealized loss on short-term investments |
— |
— |
— |
— |
— |
— |
— |
1,103 |
|
Other |
88 |
581 |
(336) |
110 |
2,621 |
1,031 |
992 |
1,686 |
|
Adjusted EBITDA |
48,944 |
52,410 |
37,887 |
42,281 |
38,888 |
42,425 |
33,135 |
44,148 |
Free cash flow
Free cash flow is defined as cash from operating activities plus proceeds on disposal of property, plant, and equipment, less capital expenditures (including changes to non-cash working capital associated with capital expenditures), and deferred development costs. This metric provides a key measure on the Company’s ability to generate cash from its principal business activities after funding capital expenditure programs, and provides an indication of the amount of cash available to finance, among other items, the Company’s dividend and other investment opportunities.
Reconcile cash from operating activities to free cash flow
|
Three Months Ended |
Dec 31, |
Mar 31, |
Jun 30, |
Sep 30, |
Dec 31, |
Mar 31, |
Jun 30, |
Sep 30, |
|
(000s) |
($) |
($) |
($) |
($) |
($) |
($) |
($) |
($) |
|
Cash from operating activities |
19,942 |
46,265 |
29,658 |
31,698 |
27,412 |
31,014 |
25,976 |
30,375 |
|
Less: |
||||||||
|
Net additions to property, plant and equipment |
(16,112) |
(11,404) |
(11,303) |
(6,474) |
(7,720) |
(17,834) |
(16,695) |
(12,444) |
|
Deferred development costs |
(121) |
(151) |
(367) |
(208) |
(375) |
(1,447) |
(1,250) |
(1,277) |
|
Free cash flow |
3,709 |
34,710 |
17,988 |
25,016 |
19,317 |
11,733 |
8,031 |
16,654 |
Supplementary Financial Measures
A supplementary financial measure: (a) is, or is intended to be, disclosed on a periodic basis to depict the historical or expected future financial performance, financial position or cash flow of the Company; (b) is not presented in the financial statements of the Company; (c) is not a non-GAAP financial measure; and (d) is not a non-GAAP ratio. Supplementary financial measures found within this press release are as follows:
Revenue per Industry Day
Revenue per Industry Day is defined as the total revenue generated from the North American Drilling segment over all active drilling rig days in the North American market. This metric provides a key measure of the North American Drilling segment’s ability to evaluate and manage product adoption, pricing, and market share penetration. Drilling rig days are calculated by using accepted industry sources.
IWS Active Jobs
IWS Active Jobs represents the average number of jobs per day that IWS is generating revenue on through the rental of its technology offering to customers during the reporting period. This metric provides a key measure of IWS’ market penetration.
Revenue per IWS Day
Revenue per IWS Day is defined as the total revenue generated by the Completions segment over all IWS active days during the quarter. IWS active days are calculated by using IWS Active Jobs in the reporting period. This metric provides a key measure of the IWS’ ability to evaluate and manage product adoption and pricing.
Adjusted EBITDA as a percentage of revenue
Calculated as adjusted EBITDA divided by revenue.
Total Cash
Calculated as the sum of cash and cash equivalents, and short-term investments from the Company’s Condensed Consolidated Interim Balance Sheets. The Company’s short term-investments are comprised of US dollar bonds.
Forward Looking Information
Certain statements contained herein constitute “forward-looking statements” and/or “forward-looking information” under applicable securities laws (collectively referred to as “forward-looking statements”). Forward‐looking statements can generally be identified by the words “anticipate”, “expect”, “believe”, “may”, “could”, “should”, “will”, “estimate”, “project”, “intend”, “plan”, “outlook”, “forecast” or expressions of a similar nature suggesting a future outcome or outlook.
Without limiting the foregoing, this document includes, but is not limited to, the following forward‐looking statements: the Company’s growth strategy and related schedules; divergence in activity levels between the geographic regions in which we operate; demand fluctuations for our products and services; the Company’s ability to increase or maintain market share; projected future value, forecast operating and financial results; planned capital expenditures; expected product performance and adoption, including the timing, growth and profitability thereof; potential dividends and dividend growth strategy; future use and development of technology; our financial ability to meet long-term commitments not included in liabilities; the collectability of accounts receivable; the application of critical accounting estimates and judgements; treatment under governmental regulatory and taxation regimes; and projected increasing shareholder value.
These forward-looking statements reflect the current views of Pason with respect to future events and operating performance as of the date of this document. They are subject to known and unknown risks, uncertainties, assumptions, and other factors that could cause actual results to be materially different from results that are expressed or implied by such forward-looking statements.
Although we believe that these forward-looking statements are reasonable based on the information available on the date such statements are made and processes used to prepare the information, such statements are not guarantees of future performance and readers are cautioned against placing undue reliance on forward-looking statements. By their nature, these statements involve a variety of assumptions, known and unknown risks and uncertainties and other factors, which may cause actual results, levels of activity and achievements to differ materially from those expressed or implied by such statements. Such risks and uncertainties include, but are not limited to: the state of the economy; volatility in industry activity levels and resulting customer expenditures on exploration and production activities; customer demand for existing and new products; the industry shift towards more efficient drilling and completions activity and technology to assist in that efficiency; the impact of competition; the loss of key customers; the loss of key personnel; cybersecurity risks; reliance on proprietary technology and ability to protect the Company’s proprietary technologies; changes to government regulations (including those related to safety, environmental, or taxation); the impact of extreme weather events and seasonality on our suppliers and on customer operations; and war, terrorism, pandemics, social or political unrest that disrupts global markets.
These risks, uncertainties and assumptions include but are not limited to those discussed in Pason’s Annual Information Form for the year ended December 31, 2023 under the heading, “Risk and Uncertainty,” in our management’s discussion and analysis for the year ended December 31, 2023, and in our other filings with Canadian securities regulators. These documents are on file with the Canadian securities regulatory authorities and may be accessed through the SEDAR+ website (www.sedarplus.ca) or through Pason’s website (www.pason.com).
Forward-looking statements contained in this document are expressly qualified by this cautionary statement. Except to the extent required by applicable law, Pason assumes no obligation to publicly update or revise any forward-looking statements made in this document or otherwise, whether as a result of new information, future events or otherwise.
Pason Systems Inc.
Pason is a leading global provider of specialized data management systems for drilling rigs. Our solutions, which include data acquisition, wellsite reporting, remote communications, web-based information management, and analytics, enable collaboration between the rig and the office. Through Intelligent Wellhead Systems Inc. (“IWS”), we also provide engineered controls, data acquisition, and software, to automate workflows and processes for oil and gas well completions operations, improving wellsite safety and efficiency. Through Energy Toolbase Software, Inc. (“ETB”), we also provide products and services for the solar power and energy storage industry. ETB’s solutions enable project developers to model, control and monitor economics and performance of solar energy and storage projects.
Pason’s common shares trade on the Toronto Stock Exchange under the symbol PSI. For more information about Pason Systems Inc., visit the company’s website at www.pason.com or contact investorrelations@pason.com.
Additional information on risks and uncertainties and other factors that could affect Pason’s operations or financial results are included in Pason’s reports on file with the Canadian securities regulatory authorities and may be accessed through the SEDAR+ website (www.sedarplus.ca) or through Pason’s website (www.pason.com).
SOURCE Pason Systems Inc.

![]() View original content: http://www.newswire.ca/en/releases/archive/November2024/07/c6890.html
View original content: http://www.newswire.ca/en/releases/archive/November2024/07/c6890.html
© 2024 Benzinga.com. Benzinga does not provide investment advice. All rights reserved.
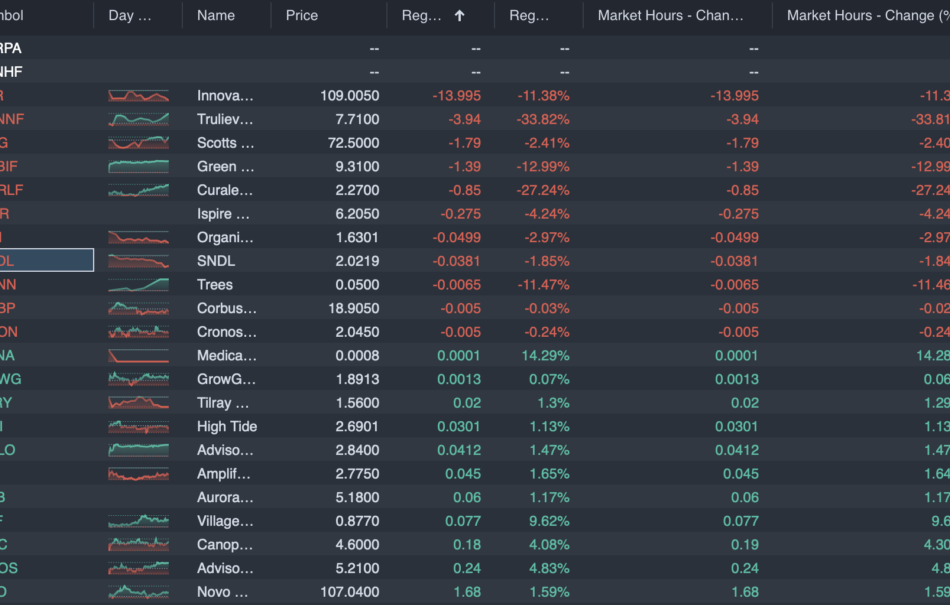
Cannabis Stocks: Is It Time To Buy The Dip After Elections And Legalization Setbacks?
The cannabis sector is showing signs of stabilization following a harsh post-election sell-off triggered by election results.
With Donald Trump’s return to the presidency, a GOP-controlled Senate, and Florida’s rejection of Amendment 3, which would have legalized cannabis, investor sentiment turned cautious, leading to widespread panic selling.
Yet, as of Thursday, some stocks are making a modest comeback, suggesting that Wednesday’s declines may have been oversold.
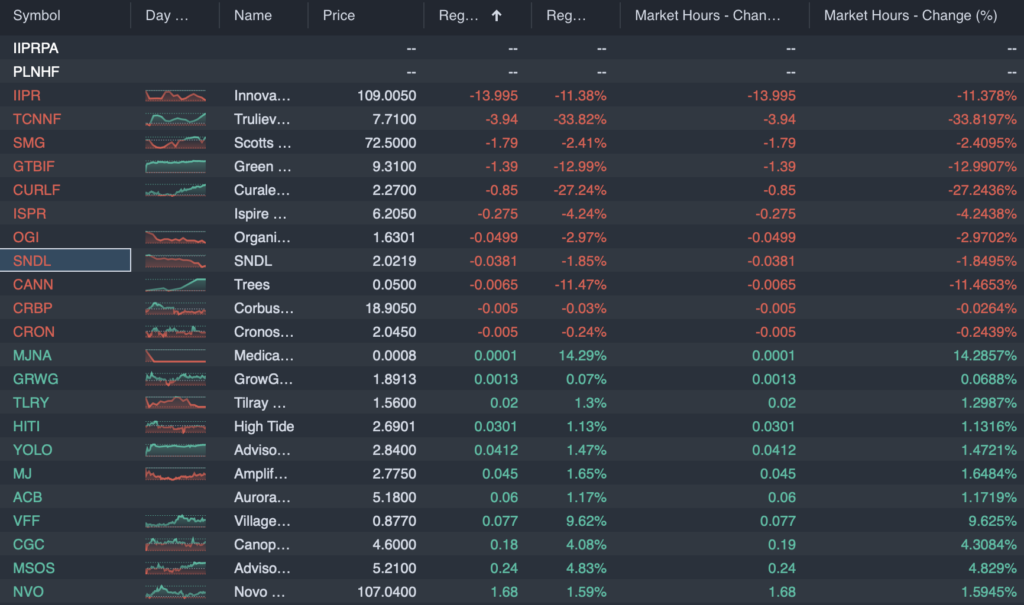
Cannabis Watchist created using Benzinga Pro
Tilray Brands TLRY: A Tentative Recovery
Tilray experienced a sharp drop yesterday, trading down to $1.51 amid panic selling, but has recovered slightly to $1.56, marking a 1.3% gain.
The RSI stands near 41.85, indicating that the stock is approaching oversold.
This could attract buyers, but the stock’s movement remains tentative, with resistance around $1.60, and a figure turning into a hammer, which could indicate final dip levels.
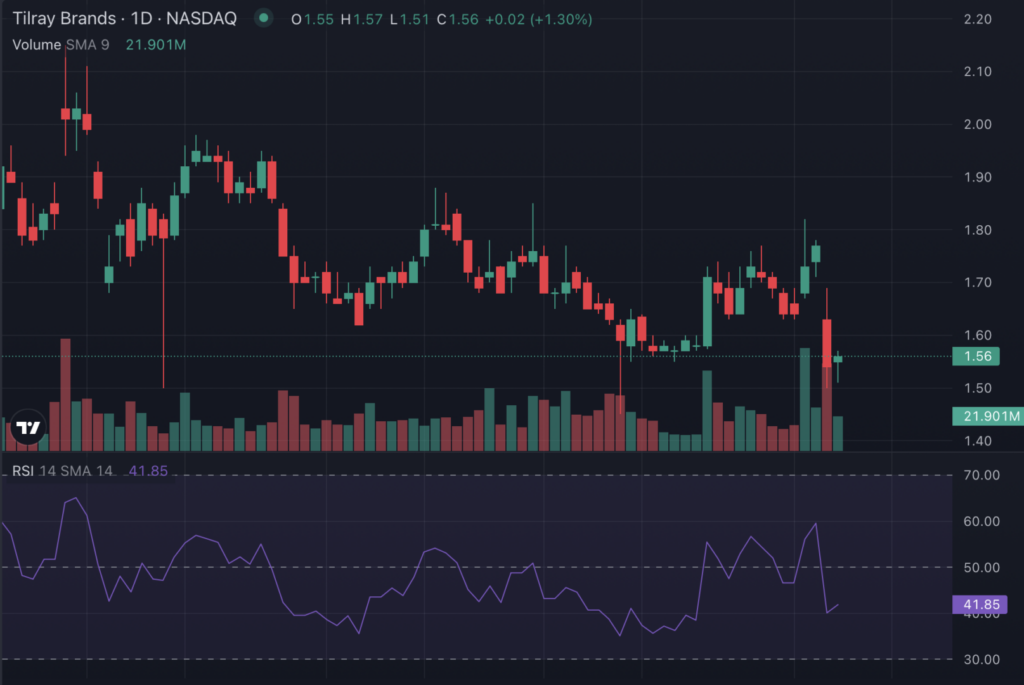
Chart created using Benzinga Pro
SNDL SNDL: Holding Support
SNDL is showing resilience at the $2.00 support level, recovering slightly to $2.02 with a neutral RSI at 45.90. The stock has managed to absorb some of the selling pressure, though it remains below its recent high near $2.60. This indicates that traders may be taking a wait-and-see approach for clearer signs of sustained support before fully stepping back in.
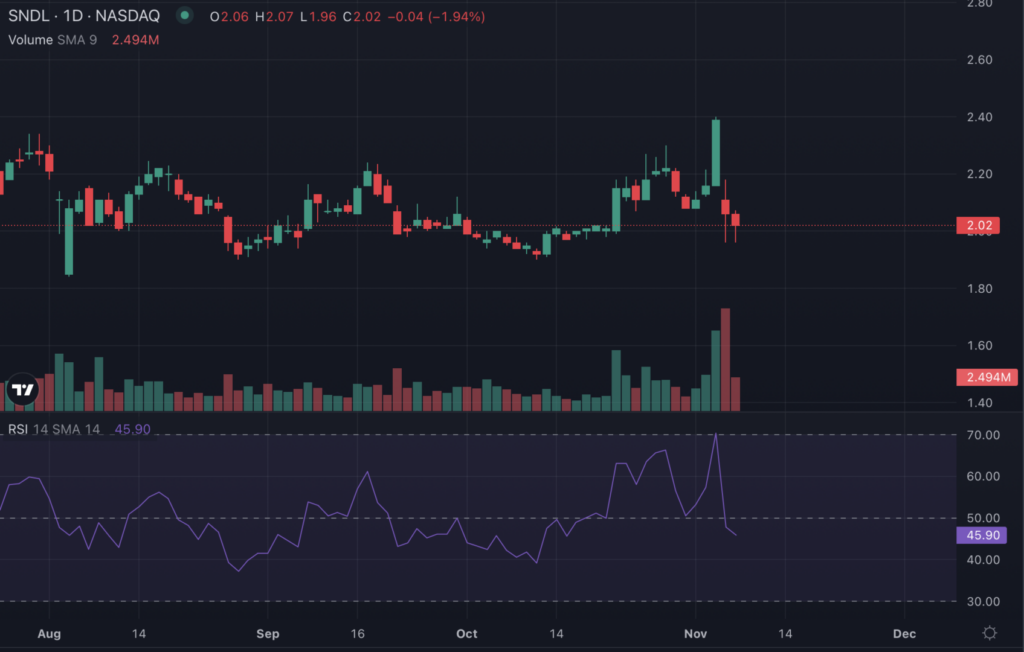
Chart created using Benzinga Pro
Trulieve TCNNF: Strong Bounce
Trulieve, which suffered a drastic drop yesterday following Florida’s failed cannabis legalization effort, is now up 6.53%, trading at $7.67. The RSI of 28.54 highlighted an oversold condition, drawing in buyers looking for value. This recovery suggests the initial selling may have been excessive.
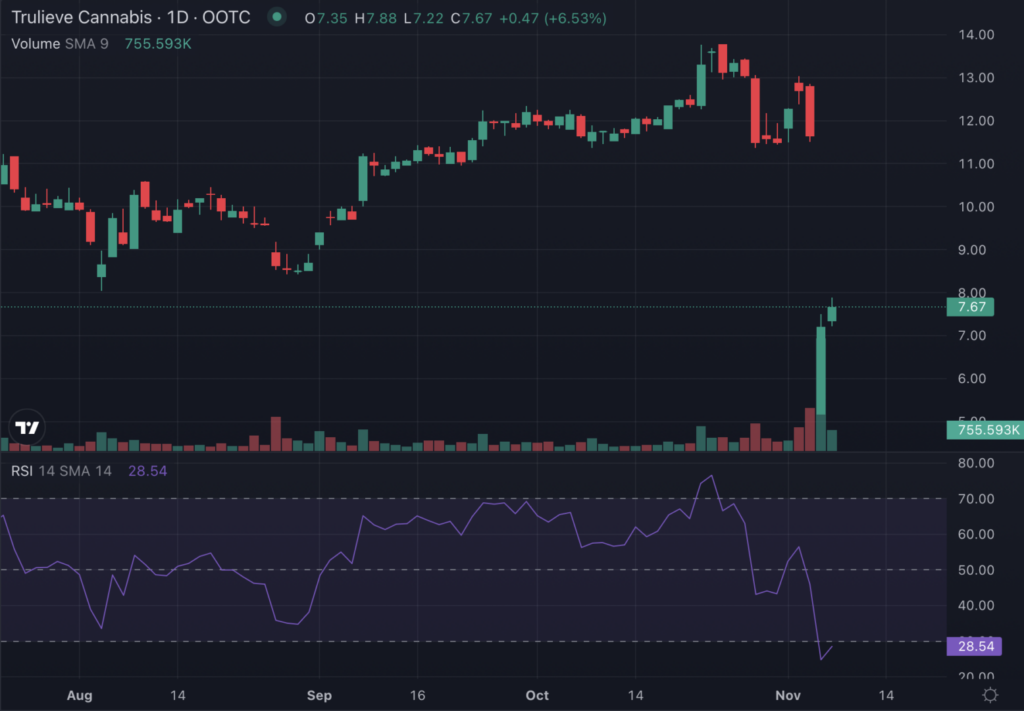
Chart created using Benzinga Pro
AdvisorShares Pure US Cannabis ETF MSOS: ETF Stability May
MSOS, a popular cannabis ETF, has risen by 4.83% to $5.21, rebounding from an RSI of 31.15, which flagged oversold conditions. With many cannabis stocks attempting recoveries, MSOS is holding above the $5.00 level, a critical support.
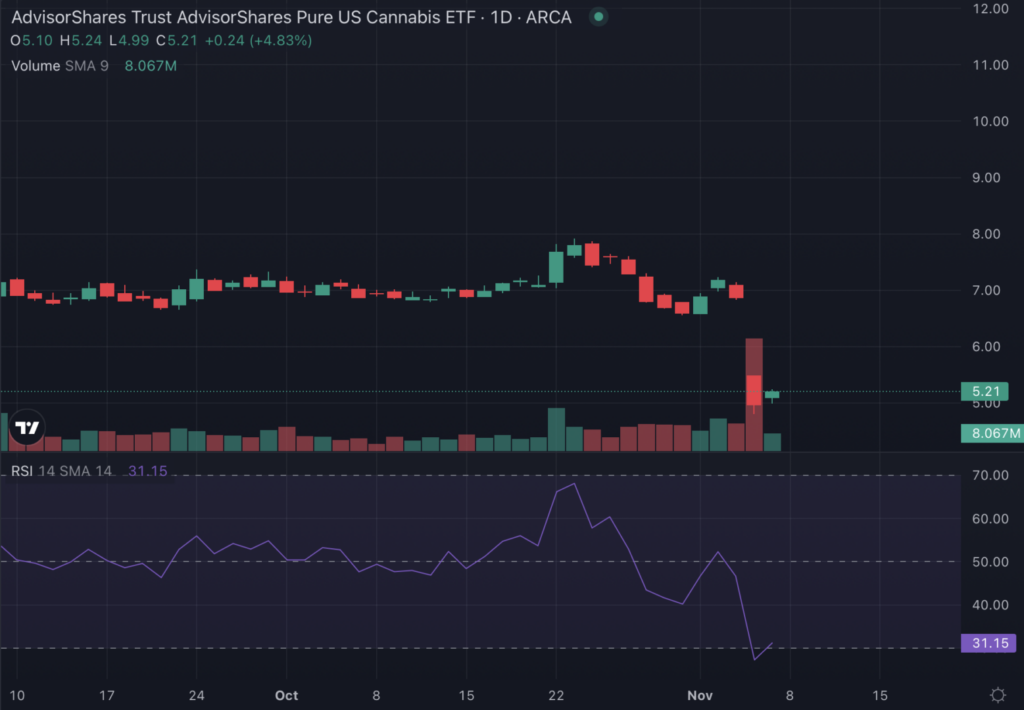
Chart created using Benzinga Pro
Is Buying The Dip A Good Idea?
While the sector is showing early signs of stabilization, the underlying risks remain. Still, most stocks look heavily oversold or reaching that point.
Fundaments are relevant to understand what the outcome might look like in the mid-turn.
With a GOP-majority Senate likely to stall cannabis reform, there’s a possibility of four more years of cannabis protectionism – a period marked by minimal legislative progress and regulatory insularity.
Nevertheless, an argument could be made that the fundamentals of cannabis have not changed and, particularly, that the impact of rescheduling on balance sheets, due to the suppression of 280E burden, would be formidable for the industry. Rescheduling does not require a Senate majority or presidential involvement.
That said, stock prices for cannabis rely heavily on the upcoming DEA administrative hearing and ruling.
Investors should weigh the potential for long-term industry growth against the immediate political headwinds.
Cover: AI generated image
Disclosure: this article is not intended to provide financial advice. Consult a professional before making investment decisions.
© 2024 Benzinga.com. Benzinga does not provide investment advice. All rights reserved.
Mexco Energy Corporation Reports Financial Results for first Six Months
MIDLAND, TX, Nov. 07, 2024 (GLOBE NEWSWIRE) — Mexco Energy Corporation MXC today reported net income of $608,237, or $0.29 per diluted share, for the six months ending September 30, 2024.
Operating revenues in the first six months of fiscal 2025 were $3,477,062, an increase of 10% when compared to the first six months of fiscal 2024. This increase was primarily due to an increase in oil and natural gas production volumes and an increase in average oil prices partially offset by a decrease in average natural gas prices. Oil contributed 87% of our operating revenues for the first six months of fiscal 2025.
Net income of $317,198, or $0.15 per diluted share, for the Company’s second quarter of fiscal 2025 compared with $269,433, or $0.12 per diluted share for the comparable quarter ending September 30, 2023. Operating revenues in the second quarter of fiscal 2025 were $1,749,227.
The Company currently expects to participate in the drilling of 30 and completion of 19 horizontal wells at an estimated aggregate cost of approximately $2.3 million for the fiscal year ending March 31, 2025, of which approximately $890,000 has been expended to date. The Company is evaluating other prospects for participation during this fiscal year.
During fiscal 2025, the Company has expended to date, approximately $1.5 million for royalty and mineral interest acquisitions in approximately 600 producing wells with additional potential development located in 37 counties in 9 states.
Mexco Energy Corporation, a Colorado corporation, is an independent oil and gas company located in Midland, Texas engaged in the acquisition, exploration, and development of oil and gas properties primarily in the Permian Basin. For more information on Mexco Energy Corporation, go to www.mexcoenergy.com.
In accordance with the Safe Harbor provisions of the Private Securities Litigation Reform Act of 1995, Mexco Energy Corporation cautions that statements in this press release which are forward-looking and which provide other than historical information involve risks and uncertainties that may impact the Company’s actual results of operations. These risks include, but are not limited to, production variance from expectations, volatility of oil and gas prices, the need to develop and replace reserves, exploration risks, uncertainties about estimates of reserves, competition, government regulation, and mechanical and other inherent risks associated with oil and gas production. A discussion of these and other factors, including risks and uncertainties, is set forth in the Company’s Form 10-K for the fiscal year ended March 31, 2024. Mexco Energy Corporation disclaims any intention or obligation to revise any forward-looking statements.
For additional information, please contact: Tammy L. McComic, President and Chief Financial Officer of Mexco Energy Corporation, (432) 682-1119.

Market News and Data brought to you by Benzinga APIs
© 2024 Benzinga.com. Benzinga does not provide investment advice. All rights reserved.
Market Whales and Their Recent Bets on RIVN Options
Investors with a lot of money to spend have taken a bullish stance on Rivian Automotive RIVN.
And retail traders should know.
We noticed this today when the trades showed up on publicly available options history that we track here at Benzinga.
Whether these are institutions or just wealthy individuals, we don’t know. But when something this big happens with RIVN, it often means somebody knows something is about to happen.
So how do we know what these investors just did?
Today, Benzinga‘s options scanner spotted 9 uncommon options trades for Rivian Automotive.
This isn’t normal.
The overall sentiment of these big-money traders is split between 66% bullish and 33%, bearish.
Out of all of the special options we uncovered, 3 are puts, for a total amount of $152,300, and 6 are calls, for a total amount of $232,551.
Projected Price Targets
Analyzing the Volume and Open Interest in these contracts, it seems that the big players have been eyeing a price window from $10.0 to $20.0 for Rivian Automotive during the past quarter.
Volume & Open Interest Development
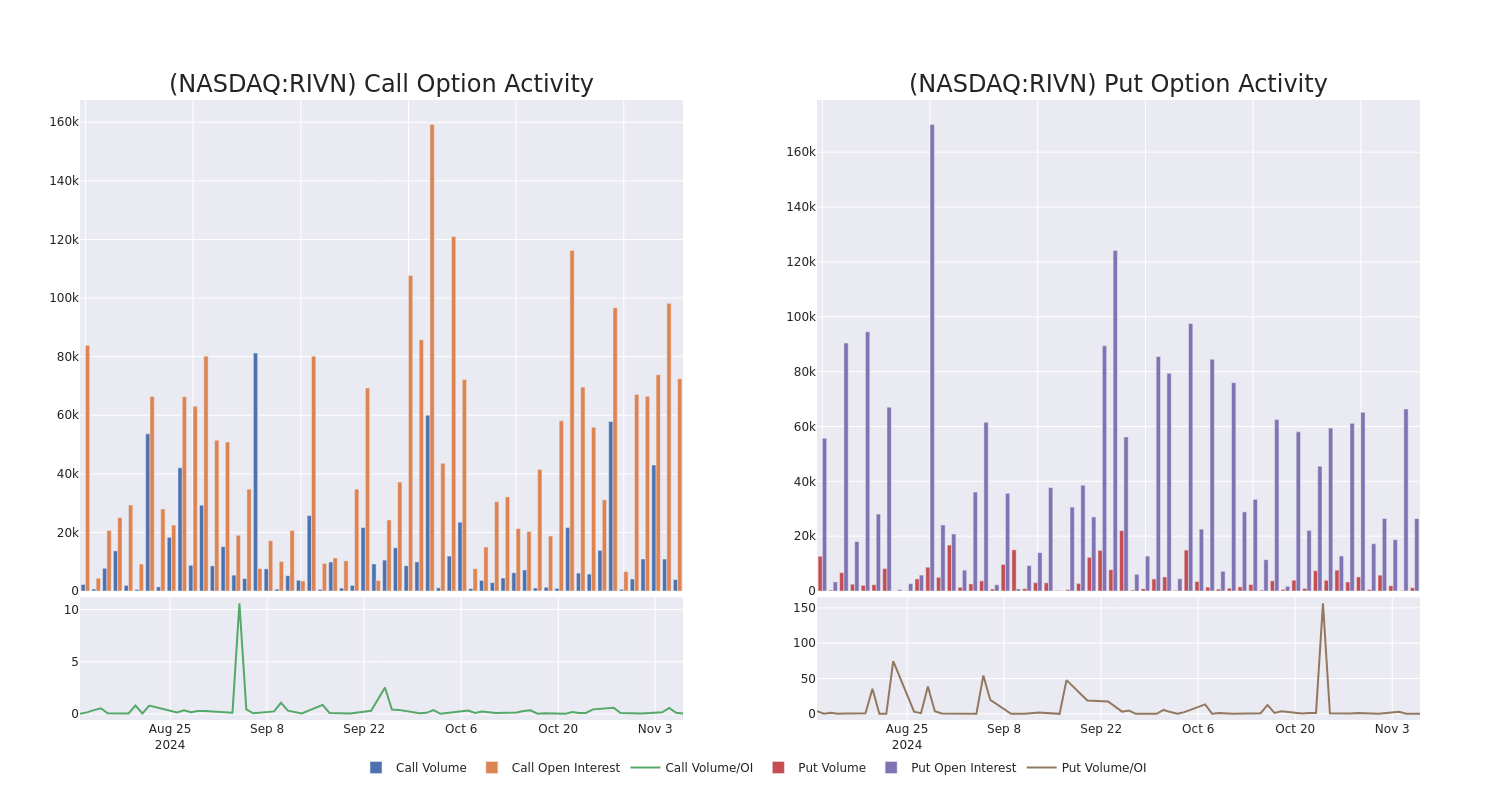
In terms of liquidity and interest, the mean open interest for Rivian Automotive options trades today is 14125.0 with a total volume of 5,139.00.
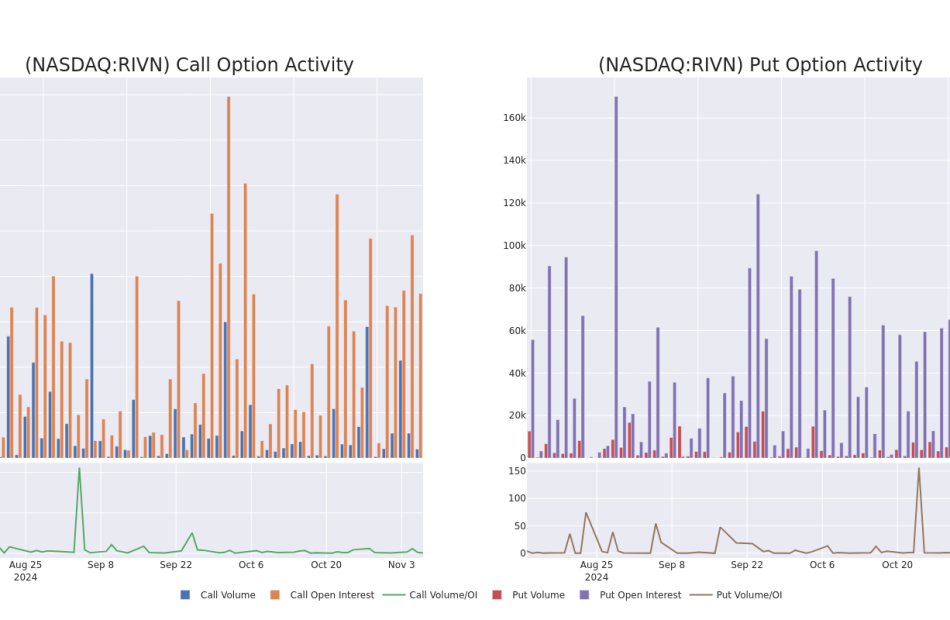
In the following chart, we are able to follow the development of volume and open interest of call and put options for Rivian Automotive’s big money trades within a strike price range of $10.0 to $20.0 over the last 30 days.
Rivian Automotive Option Activity Analysis: Last 30 Days
Significant Options Trades Detected:
| Symbol | PUT/CALL | Trade Type | Sentiment | Exp. Date | Ask | Bid | Price | Strike Price | Total Trade Price | Open Interest | Volume |
|---|---|---|---|---|---|---|---|---|---|---|---|
| RIVN | PUT | SWEEP | BEARISH | 12/20/24 | $1.22 | $1.02 | $1.22 | $10.00 | $60.2K | 25.8K | 1 |
| RIVN | PUT | SWEEP | BULLISH | 12/20/24 | $1.11 | $1.08 | $1.08 | $10.00 | $54.0K | 25.8K | 1.0K |
| RIVN | CALL | SWEEP | BEARISH | 03/21/25 | $0.7 | $0.65 | $0.66 | $15.00 | $53.8K | 7.5K | 1.6K |
| RIVN | CALL | TRADE | BULLISH | 09/19/25 | $2.93 | $2.93 | $2.93 | $10.00 | $49.8K | 3.4K | 177 |
| RIVN | PUT | TRADE | BULLISH | 11/15/24 | $2.55 | $2.54 | $2.54 | $12.50 | $38.1K | 614 | 152 |
About Rivian Automotive
Rivian Automotive Inc designs, develops, and manufactures category-defining electric vehicles and accessories. In the consumer market, the company launched the R1 platform with the first generation of consumer vehicles: the R1T, a two-row, five-passenger pickup truck, and the R1S, a three-row, seven-passenger sport utility vehicle (SUV).
Having examined the options trading patterns of Rivian Automotive, our attention now turns directly to the company. This shift allows us to delve into its present market position and performance
Present Market Standing of Rivian Automotive
- With a volume of 42,000,347, the price of RIVN is up 4.38% at $10.13.
- RSI indicators hint that the underlying stock is currently neutral between overbought and oversold.
- Next earnings are expected to be released in 0 days.
Expert Opinions on Rivian Automotive
A total of 5 professional analysts have given their take on this stock in the last 30 days, setting an average price target of $13.2.
Unusual Options Activity Detected: Smart Money on the Move
Benzinga Edge’s Unusual Options board spots potential market movers before they happen. See what positions big money is taking on your favorite stocks. Click here for access.
* An analyst from Guggenheim persists with their Buy rating on Rivian Automotive, maintaining a target price of $18.
* An analyst from JP Morgan has decided to maintain their Underweight rating on Rivian Automotive, which currently sits at a price target of $12.
* Maintaining their stance, an analyst from Wells Fargo continues to hold a Equal-Weight rating for Rivian Automotive, targeting a price of $11.
* Maintaining their stance, an analyst from Barclays continues to hold a Equal-Weight rating for Rivian Automotive, targeting a price of $13.
* Maintaining their stance, an analyst from Mizuho continues to hold a Neutral rating for Rivian Automotive, targeting a price of $12.
Options trading presents higher risks and potential rewards. Astute traders manage these risks by continually educating themselves, adapting their strategies, monitoring multiple indicators, and keeping a close eye on market movements. Stay informed about the latest Rivian Automotive options trades with real-time alerts from Benzinga Pro.
Market News and Data brought to you by Benzinga APIs
© 2024 Benzinga.com. Benzinga does not provide investment advice. All rights reserved.


