Social Commerce Market to Grow at a CAGR of 31.60%, Says Straits Research
New York, United States, Nov. 07, 2024 (GLOBE NEWSWIRE) — E-commerce plays a crucial role in retail and reshapes the social commerce market. Since the turn of the century, online shopping has expanded significantly as internet access has spread to every corner of the globe, and smartphones have become an integral part of the lives of billions of people. Social commerce has ushered in an entirely new realm of shopping, granting consumers access to a vastly expanded selection and helping to meet the growing demand for convenience. Due to the increasing popularity of online shopping and the convenience it offers, social commerce is gaining momentum. Customers can now order products with minimal effort from the comfort of their own homes. Social commerce platform sellers offer discounts, cashback, same-day or next-day deliveries, click-and-collect services, ESR options, and other services that make online shopping more convenient and profitable than offline shopping. Businesses are investing in technologies such as artificial intelligence, chatbots, machine learning, and augmented reality, among others, to improve the customer experience. During the forecast period, the increasing convenience of online shopping is anticipated to be a significant market growth driver. Infrastructures for Social Commerce Market leaders in social commerce platforms include Facebook, Twitter, and Pinterest.
Download Free Sample Report PDF @ https://straitsresearch.com/report/social-commerce-market/request-sample
Market Dynamics
The rise of Social Media and E-Commerce and Social Networking Sites Encouraging Businesses to Grow Drives the Global Market
Many businesses are using social commerce to reach out to existing and prospective new customers. This trend is influenced by several factors, including the fact that individuals are spending more time on social media platforms; according to studies, the average person spends over two hours per day on social media platforms. In addition, these platforms serve as effective marketing tools, contributing to the steady growth of online shopping via social media platforms because they allow customers to make purchases more interactively than traditional e-commerce platforms. In the preceding decade, social media networks have attracted extraordinary attention and experienced exponential growth in user base. Access to social networking sites such as Facebook, Twitter, Instagram, LinkedIn, and YouTube is currently effortless. The exponential growth of these and other social networking sites’ user bases encourages companies to connect with customers through these platforms.
Moreover, the convergence of content sharing, shopping, payment, and messaging features has facilitated the growth of social commerce in recent years. Social commerce, defined as using a social media platform to drive and process e-commerce transactions, has spawned new shopping methods in tandem with online environments. Consequently, the increasing adoption of e-commerce and social media platforms for shopping and information exchange is anticipated to drive market expansion over the next few years.
Exposure to Big Data Analytics and Artificial IntelligenceMarket Creates Tremendous Opportunities
Over the past few years, the evolution and rapid adoption of big data and artificial intelligence (AI). Companies engaged in social commerce are aggressively adopting AI and big data technologies to optimize their service offerings. Big data, a vast collection of online and offline data, has evolved into a valuable resource for analyzing past trends and gaining valuable insights into customer behavior, thereby facilitating higher levels of customer satisfaction. By integrating big data into social commerce, businesses can gain access to data that can be used to increase revenue, acquire new customers, and streamline operations. AI enables e-commerce businesses to improve the customer experience, optimize brand competitiveness, and foster brand loyalty. It provides buyers with accurate product recommendations and enhanced search results, enabling them to find what they desire with the fewest clicks possible. The increased adoption of AI in social commerce has enabled businesses to meet rising customer demands precisely and effectively.
AI and big data are the next major transformative technologies that will influence how businesses interact with data and business processes. The technologies facilitate the development of digital data models and data collection. Utilizing data from multiple sources as a knowledge repository results in an accurate forecast of customer needs. Numerous advantages of these technologies for the social commerce industry compel businesses to leverage big data- and AI-based applications to enhance customer experience and convert dissatisfied customers into loyal customers. In addition to AI and big data analytics, cloud computing and the Internet of Things (IoT) are promising technologies that are anticipated to assist businesses shortly in enhancing their customer relationships and customer satisfaction.
Regional Analysis
Asia-Pacific held a market share of 69.5% and is anticipated to grow steadily over the forecast period. Rising investments in the telecommunication infrastructure, the proliferation of the internet and smartphones, and the widespread use of social media websites such as Facebook, Instagram, and Twitter are primarily responsible for the expansion of this region. In addition, the increasing number of smartphone and social media users in countries such as China largely favors regional market expansion.
North America has emerged as the second-largest market and is anticipated to grow incredibly during the forecast period. Compared to developing countries, the U.S. e-commerce and social commerce landscapes are significantly more fragmented, with different consumer attitudes and behaviors toward social media consumption, digital shopping, payments, and online privacy. According to GWI, 51 percent of U.K. and U.S. consumers will use YouTube to find products and conduct additional research before making a purchase.
To Gather Additional Insights on the Regional Analysis of the Social Commerce Market
@ https://straitsresearch.com/report/social-commerce-market/request-sample
Competitive Players
The global cryogenic pump market’s major players are –Etsy, Inc.; Fashnear Technologies Private Limited (Meesho); Meta Platforms, Inc. (Facebook); Pinduoduo Inc.; Pinterest, Inc.; Poshmark; Roposo; Snap, Inc.; Taobao; TikTok (Douyin); Trell Shop; Twitter, Inc.; WeChat (Weixin); Xiaohongshu; Yunji Sharing Technology Co., Ltd
Market Players
- May 2022– Twitter to pay USD 150 million penalties over protecting the privacy of users’ data.
- May 2022– Meta announces new privacy policies for Facebook, Instagram, and Messenger
- May 2022– The company, then known as Facebook, began its latest eCommerce push when it launched Facebook and Instagram Shops
Global Social Commerce Market: Segmentation
By Business Model
- Business to Consumer
- Business to Business
- Consumer to Consumer
By Product Type
- Personal and Beauty Care
- Apparel
- Accessories
- Home Products
- Health Supplements
- Food and Beverages
By Regions
- North America
- Europe
- Asia-Pacific
- Latin America
- The Middle East and Africa
Get Detailed Market Segmentation @ https://straitsresearch.com/report/social-commerce-market/segmentation
About Straits Research Pvt. Ltd.
Straits Research is a market intelligence company providing global business information reports and services. Our exclusive blend of quantitative forecasting and trends analysis provides forward-looking insight for thousands of decision-makers. Straits Research Pvt. Ltd. provides actionable market research data, especially designed and presented for decision making and ROI.
Whether you are looking at business sectors in the next town or crosswise over continents, we understand the significance of being acquainted with the client’s purchase. We overcome our clients’ issues by recognizing and deciphering the target group and generating leads with utmost precision. We seek to collaborate with our clients to deliver a broad spectrum of results through a blend of market and business research approaches.
Phone: +1 646 905 0080 (U.S.)
+44 203 695 0070 (U.K.)
Email: sales@straitsresearch.com
Follow Us: LinkedIn | Facebook | Instagram | Twitter

© 2024 Benzinga.com. Benzinga does not provide investment advice. All rights reserved.
Human Papillomavirus Vaccine Market Size on Track to Surpass USD 9.1 Billion by 2031 at a 9.4% CAGR, Aiding Global Cancer Prevention| Transparency Market Research, Inc.
Wilmington, Delaware, United States, Transparency Market Research Inc. , Nov. 07, 2024 (GLOBE NEWSWIRE) — The global human papillomavirus vaccine market (سوق لقاحات فيروس الورم الحليمي البشري) was projected to attain US$ 4 billion in 2022. It is anticipated to garner a 9.4% CAGR from 2023 to 2031 and by 2031, the market is likely to attain US$ 9.1 billion by 2031.
Human papillomavirus (HPV) is a widespread virus that affects many different regions of the body. Over two hundred viruses make up the HPV category, of which over forty types are transmitted during intercourse. Sexually transmitted infections (STIs) such as HPV that affect the genitalia are often spread through physical contact.
Request Sample PDF Report: Empower Your Industry Understanding with Invaluable Insights-https://www.transparencymarketresearch.com/sample/sample.php?flag=S&rep_id=37085
Throughout the forecast period, a rise in government efforts is anticipated to support the size of the global market for human papillomavirus vaccines. The creation of new compounds that target HPV presents market participants with profitable potential. To get a larger market share, manufacturers are heavily investing in the creation of novel HPV vaccinations for all age groups.

Global Human Papillomavirus Vaccine Market: Key Players
The primary objective of major companies is to enhance the efficiency of the adult human papillomavirus vaccination by investing in research and development and launching new products.
These firms are pursuing profitable revenue prospects by staying up to date with the newest developments in the human papillomavirus vaccine industry. The following companies are well-known participants in the global human papillomavirus vaccine market:
- Merck & Co. Inc.
- GlaxoSmithKline plc
- Sanofi
- AstraZeneca
- Serum Institute of India Pvt. Ltd.
- Xiame Innovax Biotech CO. LTD.
- General Incorporated Foundation
- Chemo-Sero-Therapeutic Research Institute (Kaketsuken)
- Bharat Biotech
Key Findings of the Market Report
- To stop the spread of the human papillomavirus, governments everywhere are launching a number of campaigns and efforts for the creation and distribution of HPV vaccinations.
- Global distribution of HPV vaccinations as well as screening and immunization programs are funded by both private and public entities.
- According to a January 2023 Vaccines Journal article, Switzerland completely funds the HPV vaccination for girls between the ages of 15 and 26 and for boys between the ages of 11 and 14.
Market Trends for Human Papillomavirus Vaccine Market
- The most prevalent sexually transmitted infection (STI) globally is HPV. It is believed that 80% of those who engage in sexual activity have had HPV infection at some point in their life. Over the course of the projection period, an increase in the incidence of HPV-related illnesses such as vaginal, anal, and cervical cancer is anticipated to support demand for the human papillomavirus vaccines globally.
- Cervical cancer is the second most common disease among Indian women, and the second most common among women aged 15 to 44, according to the HPV and Related Cancers report 2023. According to the same source, India diagnoses 123,907 women with cervical cancer annually.
Global Market for Human Papillomavirus Vaccine: Regional Outlook
Various reasons are propelling the growth of human papillomavirus vaccine throughout the region. These are:
- In terms of global market share for human papillomavirus vaccines in 2022, North America held the majority of the share. This is attributed to the population’s increased incidence of cervical cancer and other HPV-related malignancies as well as the enhanced healthcare infrastructure.
- In the United States, 9,440 new cases of anal cancer were discovered in 2022, according to research released by the American Cancer Society. Furthermore, 1,450 Canadian women had a cervical cancer diagnosis in 2022, according to the Canadian Cancer Society.
- An article in the Human Vaccine and Immunotherapeutic Journal from February 2023 states that HPV vaccinations in the United States can begin as early as age nine and continue until age 26.
- Approximately 77% of teens, aged 13 to 17 have gotten one or more doses of the HPV vaccination, with roughly 62% completing the whole series. The human papillomavirus vaccine market is anticipated to develop significantly in the area due to significant coverage for the HPV vaccination and early screening programs.
Unlock Growth Potential in Your Industry! Download PDF Brochure @ https://www.transparencymarketresearch.com/sample/sample.php?flag=S&rep_id=37085
Some key developments by the players in this market are:
- To begin a cervical cancer screening program in India, Roche Diagnostics India and the Cancer Awareness Prevention and Early Detection Trust (CAPED) signed a Memorandum of Understanding (MoU) in March 2023.
- Health Canada approved the expanded use of GARDASIL 9 (Human Papillomavirus 9-valent Vaccine, Recombinant) in April 2022 for people 9 to 45 years old in order to protect against infection with Human Papillomavirus (HPV) types 6, 11, 16, 18, 31, 33, 45, 52, and 58. Merck Canada received this approval.
Global Human Papillomavirus Vaccine Market Segmentation
Valence
- Bivalent
- Quadrivalent and Nonavalent
Indication
- Cervical Cancer
- Anal Cancer
- Vaginal Cancer
- Penile Cancer
- Vulvar Cancer
- Oropharyngeal Cancer
- Genital Warts
- Others
Distribution Channel
- Physicians
- Wholesalers
- Physician Distributors
- Government Entities
- Public and Private Alliances
Region
- North America
- Latin America
- Europe
- Asia Pacific
- Middle East & Africa
Elevate Your Business Strategy! Purchase the Report for Market-Driven Insights https://www.transparencymarketresearch.com/checkout.php?rep_id=37085<ype=S
More Trending Report by Transparency Market Research:
- Vaccines Market – The global vaccines market (سوق اللقاحات) was estimated at a value of US$ 119.1 billion in 2022. It is anticipated to register a 4.2% CAGR from 2022 to 2031 and by 2031, the market is likely to attain US$ 99.3 billion by 2031.
- Neurotoxin Market – The global neurotoxin market (سوق السموم العصبية) stood at US$ 7.78 billion in 2023 and is projected to reach US$ 13.3 billion in 2031. The global neurotoxin market is anticipated to expand at a CAGR of 6.8% between 2023 and 2031.
About Transparency Market Research
Transparency Market Research, a global market research company registered at Wilmington, Delaware, United States, provides custom research and consulting services. Our exclusive blend of quantitative forecasting and trends analysis provides forward-looking insights for thousands of decision makers. Our experienced team of Analysts, Researchers, and Consultants use proprietary data sources and various tools & techniques to gather and analyses information.
Our data repository is continuously updated and revised by a team of research experts, so that it always reflects the latest trends and information. With a broad research and analysis capability, Transparency Market Research employs rigorous primary and secondary research techniques in developing distinctive data sets and research material for business reports.
Contact:
Transparency Market Research Inc.
CORPORATE HEADQUARTER DOWNTOWN,
1000 N. West Street,
Suite 1200, Wilmington, Delaware 19801 USA
Tel: +1-518-618-1030
USA – Canada Toll Free: 866-552-3453
Website: https://www.transparencymarketresearch.com
Email: sales@transparencymarketresearch.com
Follow Us: LinkedIn| Twitter| Blog | YouTube

Market News and Data brought to you by Benzinga APIs
© 2024 Benzinga.com. Benzinga does not provide investment advice. All rights reserved.
Almost 90% of Metro Areas Posted Home Price Increases in Third Quarter of 2024
Key Highlights
- Single-family existing-home sales prices climbed in 87% of measured metro areas – 196 of 226 – in the third quarter, down from 89% in the prior quarter. The national median single-family existing-home price grew 3.1% from a year ago to $418,700.
- Fifteen markets (7%) experienced double-digit annual price appreciation (down from 13% in the previous quarter).
- The monthly mortgage payment on a typical, existing single-family home with a 20% down payment was $2,137 – down 2.4% from one year ago.
WASHINGTON (November 7, 2024) – Approximately 90% of metro markets (196 out of 226, or 87%) registered home price gains in the third quarter of 2024, as the 30-year fixed mortgage rate ranged from 6.08% to 6.95%, according to the National Association of Realtors®‘ latest quarterly report. Seven percent of the 226 tracked metro areas recorded double-digit price gains over the same period, down from 13% in the second quarter.
“Home prices remain on solid ground as reflected by the vast number of markets experiencing gains,” said NAR Chief Economist Lawrence Yun. “A typical homeowner accumulated $147,000 in housing wealth in the last five years. Even with the rapid price appreciation over the last few years, the likelihood of a market crash is minimal. Distressed property sales and the number of people defaulting on mortgage payments are both at historic lows.”
Compared to one year ago, the national median single-family existing-home price ascended 3.1% to $418,700. In the prior quarter, the year-over-year national median price increased 4.9%.
Among the major U.S. regions, the South registered the largest share of single-family existing-home sales (45.1%) in the third quarter, with year-over-year price appreciation of 0.8%. Prices also increased 7.8% in the Northeast, 4.3% in the Midwest and 1.8% in the West.[1]
The top 10 metro areas with the largest year-over-year median price increases, which can be influenced by the types of homes sold during the quarter, all experienced gains of at least 10.6%. Four of the markets were in Illinois. Overall, those markets were Racine, Wis. (13.7%); Youngstown-Warren-Boardman, Ohio-Pa. (13.1%); Syracuse, N.Y. (13.0%); Peoria, Ill. (12.4%); Springfield, Ill. (12.3%); Burlington-South Burlington, Vt. (11.7%); Shreveport-Bossier City, La. (11.5%); Rockford, Ill. (11.1%); Decatur, Ill. (10.9%); and Norwich-New London, Conn. (10.6%).
Eight of the top 10 most expensive markets in the U.S. were in California. Overall, those markets were San Jose-Sunnyvale-Santa Clara, Calif. ($1,900,000; 2.7%); Anaheim-Santa Ana-Irvine, Calif. ($1,398,500; 7.2%); San Francisco-Oakland-Hayward, Calif. ($1,309,000; 0.7%); Urban Honolulu, Hawaii ($1,138,000; 7.2%); San Diego-Carlsbad, Calif. ($1,010,000; 3.2%); Salinas, Calif. ($959,800; 1.5%); San Luis Obispo-Paso Robles, Calif. ($949,800; 6.7%); Los Angeles-Long Beach-Glendale, Calif. ($947,500; 5.6%); Oxnard-Thousand Oaks-Ventura, Calif. ($947,400; 2.8%); and Boulder, Colo. ($832,200; -3.0%).
Nearly 13% of markets (29 of 226) experienced home price declines in the third quarter, up from almost 10% in the second quarter.
Housing affordability slightly improved in the third quarter as mortgage rates trended lower. The monthly mortgage payment on a typical existing single-family home with a 20% down payment was $2,137, down 5.5% from the second quarter ($2,262) and 2.4% – or $52 – from one year ago. Families typically spent 25.2% of their income on mortgage payments, down from 26.9% in the prior quarter and 27.1% one year ago.
“Housing affordability has been a challenge, but the worst appears to be over,” Yun said. “Rising wages are outpacing home price increases. Despite some short-term swings, mortgage rates are set to stabilize below last year’s levels. More inventory is reaching the market and providing additional options for consumers.”
First-time buyers found marginally better affordability conditions compared to the previous quarter. For a typical starter home valued at $355,900 with a 10% down payment loan, the monthly mortgage payment declined to $2,097, down 5.5% from the prior quarter ($2,218). That was a decrease of $49, or 2.3%, from one year ago ($2,146). First-time buyers typically spent 38% of their family income on mortgage payments, down from 40.6% in the previous quarter.
A family needed a qualifying income of at least $100,000 to afford a 10% down payment mortgage in 42.5% of markets, down from 48% in the prior quarter. Yet, a family needed a qualifying income of less than $50,000 to afford a home in 2.2% of markets, down from 2.7% in the previous quarter.
About the National Association of Realtors®
The National Association of Realtors® is America’s largest trade association, representing 1.5 million members involved in all aspects of the residential and commercial real estate industries. The term Realtor® is a registered collective membership mark that identifies a real estate professional who is a member of the National Association of Realtors® and subscribes to its strict Code of Ethics. For free consumer guides about navigating the homebuying and selling transaction processes – from written buyer agreements to negotiating compensation – visit facts.realtor.
# # #
Information about NAR is available at nar.realtor. This and other news releases are posted in the newsroom at nar.realtor/newsroom. Statistical data in this release, as well as other tables and surveys, are posted in the “Research and Statistics” tab.
Data tables for MSA home prices (single-family and condo) are posted at https://www.nar.realtor/research-and-statistics/housing-statistics/metropolitan-median-area-prices-and-affordability. If insufficient data is reported for an MSA in a particular quarter, it is listed as N/A. For areas not covered in the tables, please contact the local association of Realtors®.
NOTE: NAR releases quarterly median single-family price data for approximately 220 Metropolitan Statistical Areas (MSAs). In some cases, the MSA prices may not coincide with data released by state and local Realtor® associations. Any discrepancy may be due to differences in geographic coverage, product mix, and timing. In the event of discrepancies, Realtors® are advised that for business purposes, local data from their association may be more relevant.
[1] Areas are generally metropolitan statistical areas as defined by the U.S. Office of Management and Budget. NAR adheres to the OMB definitions, although in some areas an exact match is not possible from the available data. A list of counties included in MSA definitions is available at: https://www.census.gov/geographies/reference-files/time-series/demo/metro-micro/delineation-files.html.
Regional median home prices are from a separate sampling that includes rural areas and portions of some smaller metros that are not included in this report; the regional percentage changes do not necessarily parallel changes in the larger metro areas. The only valid comparisons for median prices are with the same period a year earlier due to seasonality in buying patterns. Quarter-to-quarter comparisons do not compensate for seasonal changes, especially for the timing of family buying patterns.
Median price measurement reflects the types of homes that are selling during the quarter and can be skewed at times by changes in the sales mix. For example, changes in the level of distressed sales, which are heavily discounted, can vary notably in given markets and may affect percentage comparisons. Annual price measures generally smooth out any quarterly swings.
NAR began tracking of metropolitan area median single-family home prices in 1979; the metro area condo price series dates back to 1989.
The seasonally adjusted annual rate for a particular quarter represents what the total number of actual sales for a year would be if the relative sales pace for that quarter was maintained for four consecutive quarters. Total home sales include single-family, townhomes, condominiums and co-operative housing.

Troy Green
National Association of Realtors®
tgreen@nar.realtor
© 2024 Benzinga.com. Benzinga does not provide investment advice. All rights reserved.
Rotogravure Printing Machine Market Size Expected to Hit USD 2.8 Billion by 2031, Expanding at a 3.5% CAGR: Transparency Market Research, Inc.
Wilmington, Delaware, United States, Transparency Market Research Inc. , Nov. 07, 2024 (GLOBE NEWSWIRE) — The global rotogravure printing machine market was projected to attain US$ 2 billion in 2022. It is anticipated to garner a 3.5% CAGR from 2023 to 2031 and by 2031, the market is likely to attain US$ 2.8 billion by 2031.
Newspapers, periodicals, and flex printing may be printed in large quantities using a gravure printing press. To guarantee excellent prints, the rotogravure printing method uses sophisticated cylinder engraving.
The packaging industry uses high-volume printing machines to boost output while preserving print quality in line with brand specifications. Businesses are able to print their desired logos, brand pictures, and other content on packaging materials with an industrial rotogravure press that is customized.
Request for a Sample PDF of this Research Report: https://www.transparencymarketresearch.com/sample/sample.php?flag=S&rep_id=36734

Global Rotogravure Printing Machine Market: Key Players
With modern technology, businesses operating in the global environment are making significant investments in product innovation. To expedite the packaging of products, businesses in the packaging industry are using automated printing equipment.
To increase their worldwide presence, they are entering into commercial contracts with well-known companies in the rotogravure printing machine industry. The following companies are well-known participants in the global rotogravure printing machine market:
- Bobst Group SA.
- Windmoeller & Hoelscher Corporation
- Comexi Group S.L.
- DCM-ATN
- KKA GmbH
- ROTATEK S.A.
- Uteco Converting SpA
- Shaanxi Beiren Printing Machinery Co., Ltd.
- Pelican Rotoflex Pvt Ltd.
- Fuji Kikai Kogyo Co Ltd
- Officine Meccaniche Giovanni Cerutti SpA
Key Findings of the Market Report
- In the food and beverage sectors, there is an increasing need for visually appealing and reasonably priced packaging.
- The cost of printing on substrates with rotogravure printing is cheap per unit.
- Businesses in the food and beverage industry favor it.
- With the use of precise rotogravure printing technology, businesses may efficiently communicate product specifications to their clientele through labels and tags.
- The market statistics for rotogravure printing machines are supported by the rise in demand for gravure printing in the e-commerce industry.
- High accuracy and print quality bulk printing is made possible by rotogravure printing machines.
Market Trends for Rotogravure Printing Machines
- Flexible packaging is utilized in a variety of end-use sectors, such as food and beverage, pharmaceuticals, cosmetics and personal care, industrial, and consumer products. Since rotogravure printing uses high-quality ink, it is often utilized in commercial packaging.
- The rotogravure printing machine market is growing because of the increase in demand for flexible packaging solutions in many sectors due to its efficient, long-lasting, and high-quality packaging.
- The packaging industry is seeing a rise in expenditures in technical improvements, which is changing the dynamics of the market. Leading manufacturers use high-speed rotogravure printing machines for flexible packaging in order to boost production through automated printing processes. These devices can print excellent designs on a variety of surfaces, including paper, metal, glass, and plastic.
Global Market for Rotogravure Printing Machine: Regional Outlook
Various reasons are propelling the growth of rotogravure printing machines throughout the region. These are:
- In 2022, Europe constituted the largest portion of the world’s landmass. From 2023 to 2031, the industry in the region is expected to grow at a CAGR of 2.1%.
- Over the next few years, Europe’s market share for rotogravure printing machines is expected to grow due to the continent’s high volume of magazine production and growing need for bulk printing solutions. Market expansion in the region is also being aided by the packaging industry’s rapid rise.
- The population’s growing consumption of packaged food is also fueling the need for rotogravure printing equipment in Europe’s food and beverage industry.
- Ultra-Processed Foods (UFDs) account for 12.0% of the average adult daily food intake amount in Europe, according to the National Institutes of Health, where adult consumption of UFDs is 328 g/day.
Unlock Growth Potential in Your Industry! Download PDF Brochure: https://www.transparencymarketresearch.com/sample/sample.php?flag=S&rep_id=36734
Key developments by the players in this market are:
- The multinational manufacturer of flexible packaging Takigawa Corporation expanded their operations in Bardstown, Kentucky, in October 2022 by adding a second HELIOSTAR gravure press from Windmoeller & Hoelscher Corporation. The 10-color HELIOSTAR gravure press allows for excellent mass printing on various materials.
- Berkshire Labels, a well-known producer of creative and superior self-adhesive labels, sticker sheets, and shrink sleeves in the United Kingdom, inked a deal with BOBST Group in October 2022 to acquire the BOBST DIGITAL MASTER 340 label press, an entirely automated and digitalized production line.
Global Rotogravure Printing Machine Market Segmentation
Ink Type
Substrate
- Plastic
- Aluminum Foil
- Paper & Paperboard
Drying Source
- Electrical
- Thermal Fluid
- Gas
Automation Type
- Automatic Rotogravure Machine
- Manual Rotogravure Machine
End Use
- Newspaper
- Security Printing
- Food & Beverages
- Pharmaceuticals
- Consumer Goods
- Industrial
- Others
Region
- North America
- Latin America
- Europe
- Asia Pacific
- Middle East & Africa
Get an Exclusive Discount Now to Access Industry Forecasts: https://www.transparencymarketresearch.com/checkout.php?rep_id=36734<ype=S
Explore Trending Reports of Packaging:
- Aerosol Cans Market – The global aerosol cans market stood at US$ 3.0 billion in 2022 and is projected to reach US$ 4.9 billion in 2031. The global aerosol cans market is anticipated to expand at a CAGR of 5.5% between 2023 and 2031.
- Flexible Packaging Market – The global flexible packaging market is projected to flourish at a CAGR of 4.9% from 2023 to 2031.
About Transparency Market Research
Transparency Market Research, a global market research company registered at Wilmington, Delaware, United States, provides custom research and consulting services. Our exclusive blend of quantitative forecasting and trends analysis provides forward-looking insights for thousands of decision makers. Our experienced team of Analysts, Researchers, and Consultants use proprietary data sources and various tools & techniques to gather and analyses information.
Our data repository is continuously updated and revised by a team of research experts, so that it always reflects the latest trends and information. With a broad research and analysis capability, Transparency Market Research employs rigorous primary and secondary research techniques in developing distinctive data sets and research material for business reports.
Contact:
Transparency Market Research Inc.
CORPORATE HEADQUARTER DOWNTOWN,
1000 N. West Street,
Suite 1200, Wilmington, Delaware 19801 USA
Tel: +1-518-618-1030
USA – Canada Toll Free: 866-552-3453
Website: https://www.transparencymarketresearch.com
Email: sales@transparencymarketresearch.com
Follow Us: LinkedIn| Twitter| Blog | YouTube

Market News and Data brought to you by Benzinga APIs
© 2024 Benzinga.com. Benzinga does not provide investment advice. All rights reserved.
Why Trump's Boost To Treasury Yields, Inflation Expectations May Weaken Fed's Efforts To Cut Interest Rates
Rising U.S. Treasury yields and a strengthening in the value of the dollar in the wake of Donald Trump’s return to the White House are threatening to counteract the Federal Reserve’s efforts to lower interest rates.
The Federal Reserve is expected to cut its benchmark interest rate by 25 basis points on Thursday, marking a back-to-back reduction and bringing the policy rate to a range of 4.5%-4.75%, the lowest since February 2023.
The bond market appears less influenced by the Fed’s dovish stance and more by the fiscal and inflationary implications of Trump’s victory in the 2024 presidential election.
Trump’s Fiscal Plans Drive Deficit Concerns
Trump’s proposed fiscal policies are expected to add significantly to the U.S. national debt.
According to the nonprofit Committee for a Responsible Federal Budget (CRFB), Trump’s tax and spending plans could increase the federal deficit by approximately $7.75 trillion between 2026 and 2035 in a baseline scenario.
This would push the debt-to-GDP ratio from 102% to a staggering 143%, or 18% higher than current law projections.
In a high-deficit scenario, the CRFB estimates that deficits could swell by $15.55 trillion, elevating the debt-to-GDP ratio to 157%.
Such a sharp rise in the national debt would necessitate a sharp increase in Treasury issuance by the government in the upcoming years, putting upward pressure on yields as investors demand higher returns to offset heightened risks of fiscal instability.
On top of that, Trump’s pledge to raise import tariffs — by 60% on goods from China and 10% on imports from other countries — is widely viewed by economists as an inflationary move.
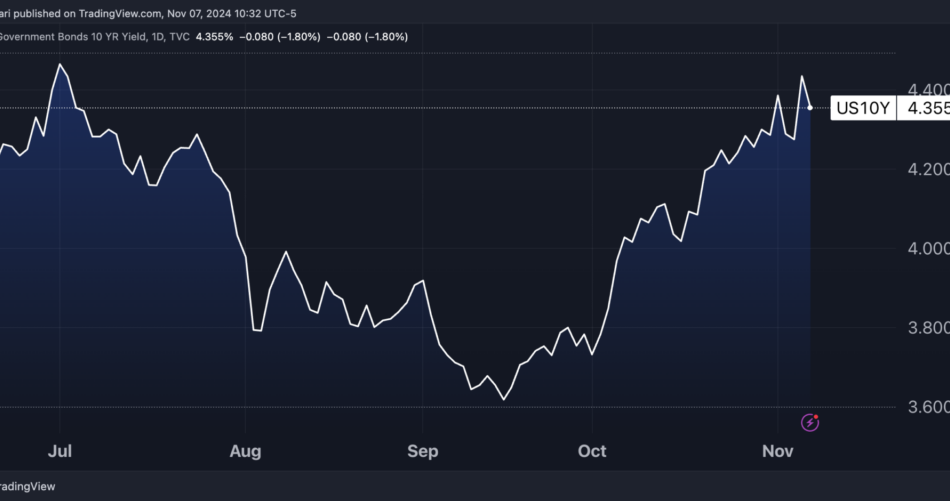
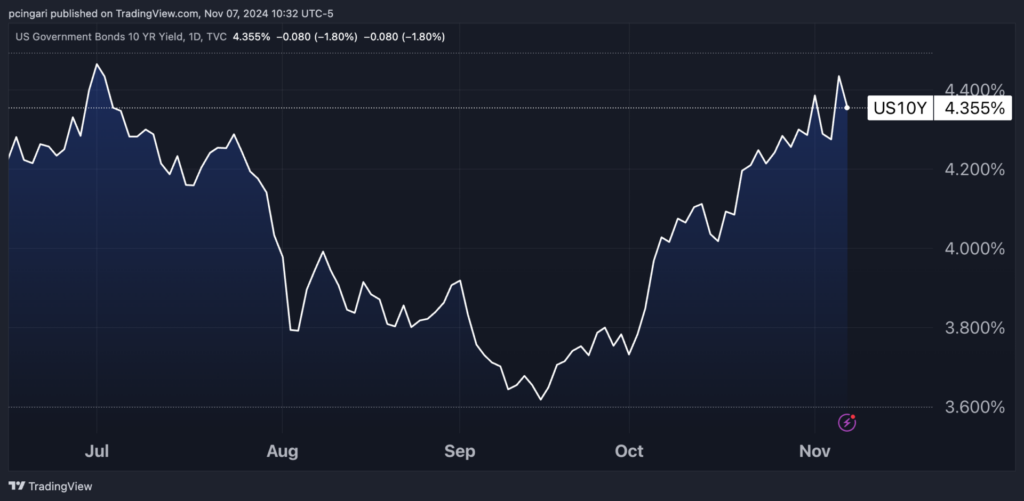
Treasury yields have surged sharply in under two months, with the 10-year yield climbing from 3.6% to 4.35%. As a result, the U.S. 10 Year Treasury Note ETF UTEN has fallen by over 5% since its September highs.
Chart: 10-Year Treasury Yields Spike, Anticipate Worsening Debt Path After 2024 Elections
Rising Yields Complicate Fed’s Easing Path
In the meantime, the Fed cut interest rates by 50 basis points in September and guided investors toward a further cut in November, a stance that would typically lower borrowing costs and ease financial conditions.
The bond market’s reaction has been the opposite, creating tighter financial conditions that investors wouldn’t normally expect under a Fed easing bias.
In addition to rising yields, the U.S. dollar has also strengthened significantly.
“Bond yields are rising for a good reason, as the economy is holding up stronger than expected and markets are also pricing in continued government spending and the potential for widening deficits,” said Glen Smith, chief investment officer at GDS Wealth Management.
The recent spike in yields is undermining the Fed’s attempts to ease financial conditions, the CIO said.
“Rising bond yields are reversing the Fed’s efforts to loosen policy, as bond yields determine the interest rates that consumers pay on mortgages and credit cards,” he said.
Smith suggested Thursday’s expected rate cut could be the last for a while, as the Fed might pause its rate cuts in December and into 2025 if the economy remains resilient and disinflation slows.
Inflation Expectations Spike With Trump Win
Trump’s return to the White House has heightened inflationary concerns.
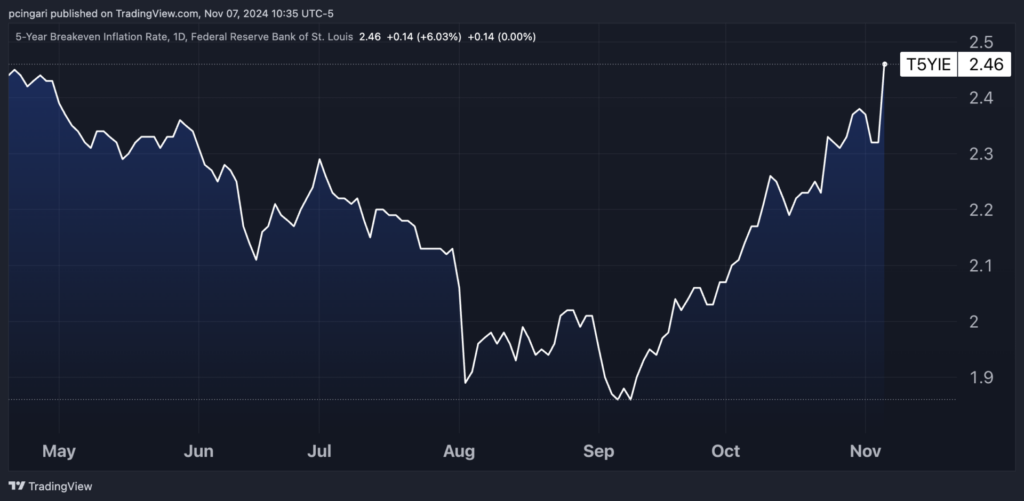
The five-year breakeven inflation rate, a widely watched gauge of inflation expectations derived from Treasury yields, rose by 14 basis points to 2.46% on Wednesday.
This shift indicates that investors are now anticipating inflation to average 2.5% over the next five years, well above the Fed’s 2% target.
Russell Shor, senior market specialist at Jefferies-owned trading platform Tradu, warned that Trump’s policies could push inflation even higher.
“With Trump’s return to the White House, the Fed may feel pressure to tighten its stance on inflation. His tariff and immigration plans could drive up prices, and the central bank will be watching closely for any inflation resurgence,” Shor said.
Chart: 5-Year Breakeven Inflation Rate Spikes To Nearly 2.5% After Trump’s Election Victory
Read Next:
Image created using Shutterstock and Fed photos with a background created using artificial intelligence via MidJourney.
© 2024 Benzinga.com. Benzinga does not provide investment advice. All rights reserved.
MLL Legal Selects Anaqua's AQX Law Firm Platform to Enhance IP Management and Drive Operational Efficiency
BOSTON, Nov. 07, 2024 (GLOBE NEWSWIRE) — Anaqua, the leading provider of innovation and intellectual property (IP) management technology, today announced that MLL Legal, one of Switzerland’s largest law firms, has selected Anaqua’s AQX® Law Firm platform to enhance its IP management capabilities for its clients.
MLL Legal is known for its expertise in innovative sectors such as fintech, blockchain, artificial intelligence, and life sciences. With over 250 professionals, including 150 lawyers, MLL Legal operates from offices in Zurich, Geneva, Lausanne, Zug, as well as international locations in London and Madrid. The firm is consistently recognized in prestigious legal publications and rankings for its extensive knowledge in commercial law. MLL Legal has been one of Switzerland’s leading law firms in the field of IP for decades.
By adopting Anaqua’s AQX Law Firm platform, MLL Legal will replace its current IP management system with a unified, scalable solution that integrates email archiving, document sharing, and workflow enhancements—all with an emphasis on design and trademark management. The platform’s multi-tiered access controls offer customizable security ensuring the safe handling of sensitive client data, while its collaborative features facilitate seamless teamwork both within the firm and with external clients.
“We chose Anaqua primarily for three reasons: its robust reporting tools, the intuitive user experience, and the out-of-the-box system functionality,” said Franziska Schweizer, head of the IP Prosecution Team at MLL Legal. “The AQX platform’s reporting tools enable us to quickly generate clear and comprehensible reports without the need for manual processing. This efficiency allows our team to focus more on delivering high-quality legal advice.”
Bob Romeo, CEO of Anaqua, added: “MLL Legal’s decision underscores the growing demand for innovative IP solutions within the European legal market. Our platform’s capabilities are designed to ensure increased efficiency and flexibility, enabling law firms like MLL Legal to better manage their clients’ IP portfolios while providing exceptional service.”
About Anaqua
Anaqua, Inc. is a premium provider of integrated technology solutions and services for the management of intellectual property (IP). Anaqua’s AQX® and PATTSY WAVE® IP management solutions combine best practice workflows with big data analytics and technology-enabled services to create an intelligent environment that informs IP strategies, enables IP decisions and streamlines IP processes. Today, nearly half of the 100 largest U.S. patent applicants and global brands, as well as a growing number of law firms worldwide, use Anaqua’s solutions. Over one million IP executives, lawyers, paralegals, administrators and innovators use the platform for their IP management. The company is headquartered in Boston, with additional offices in the United States, Europe, Asia, and Australia. For more information, please visit anaqua.com or LinkedIn.

Market News and Data brought to you by Benzinga APIs
© 2024 Benzinga.com. Benzinga does not provide investment advice. All rights reserved.
Bonds And Fed Front And Center As Bonds Approach Bottom Support Zone After Trump Win
To gain an edge, this is what you need to know today.
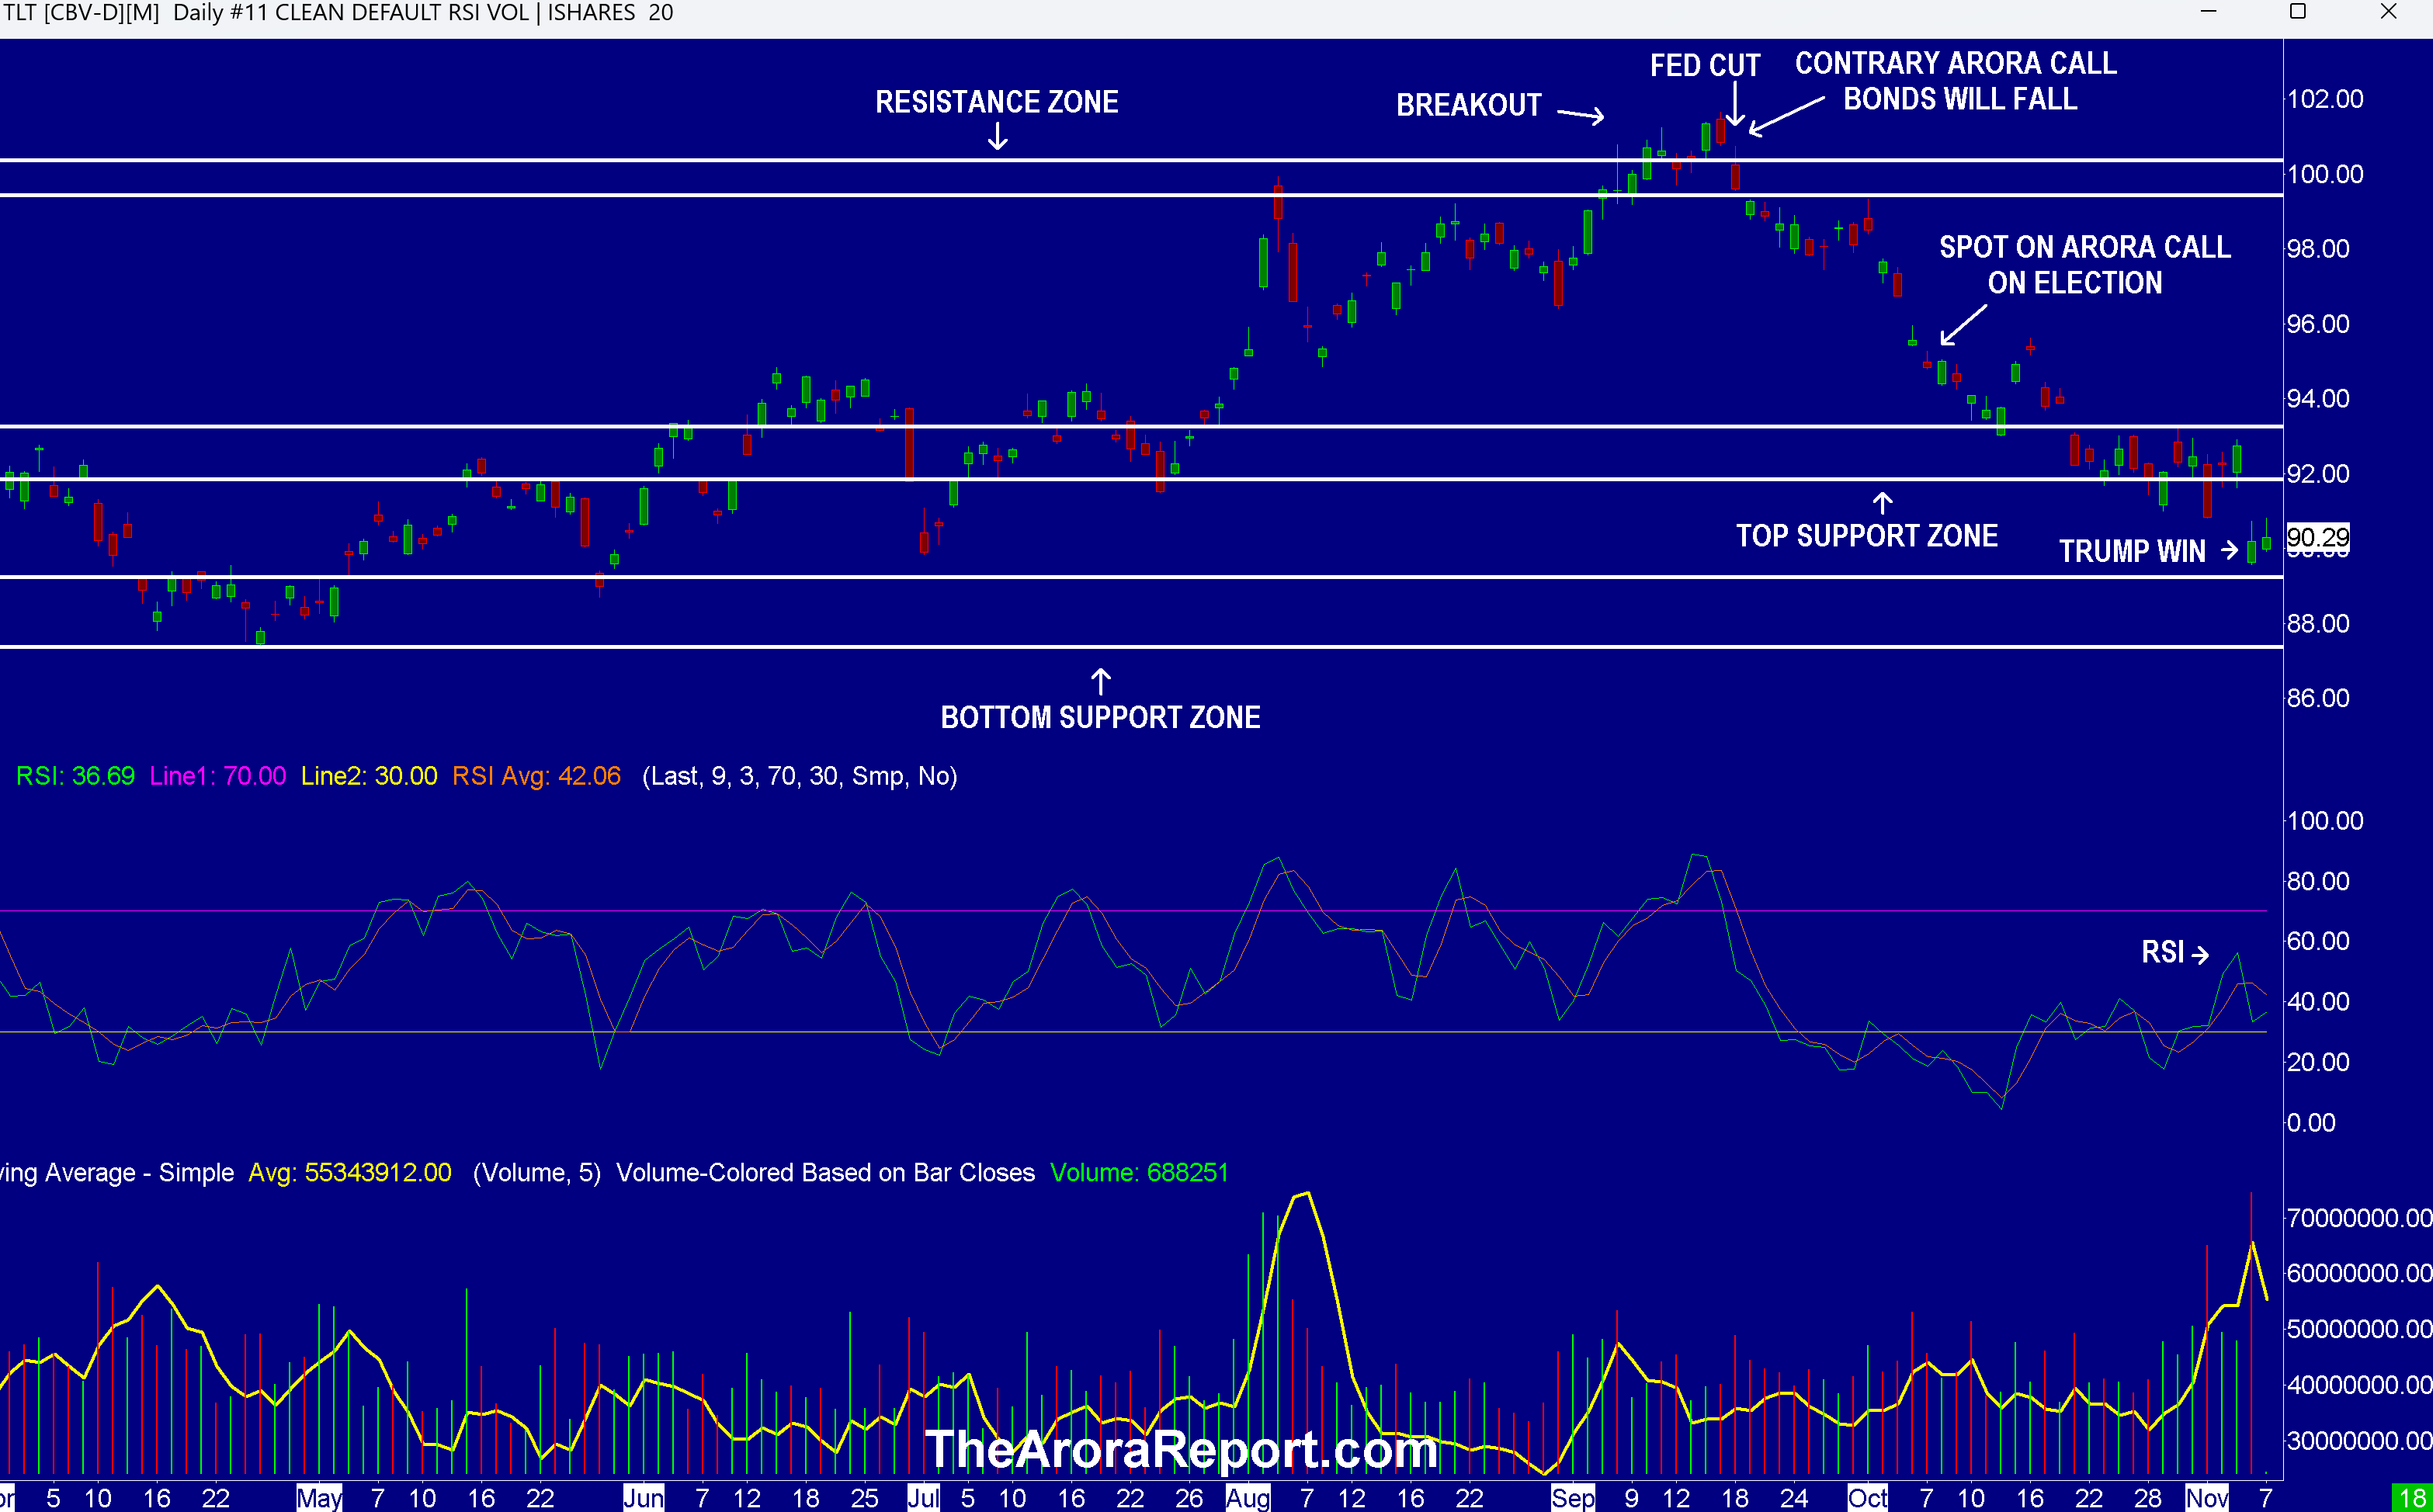
Bonds Fall On Trump Win
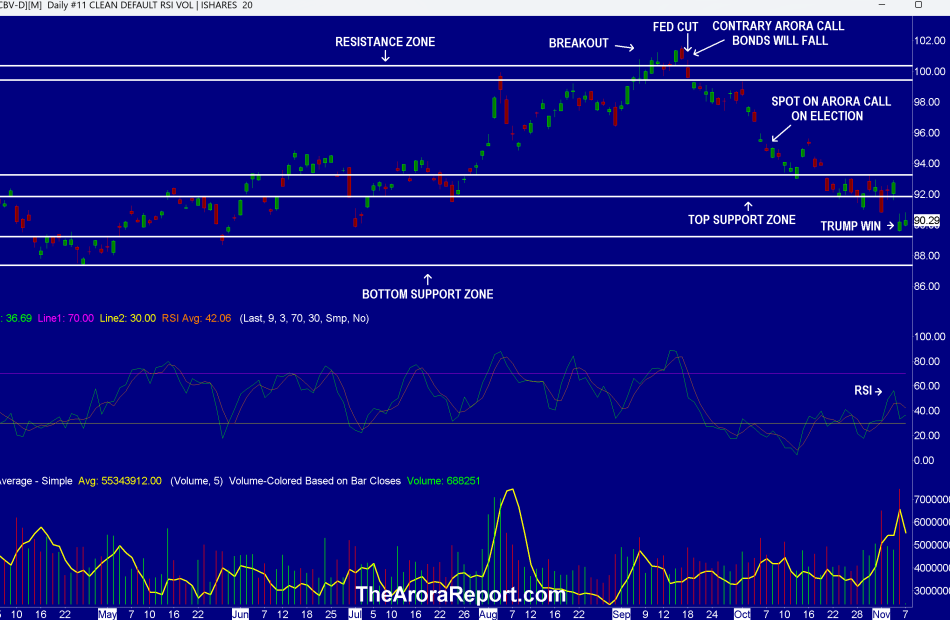
Please click here for an enlarged chart of iShares 20+ Year Treasury Bond ETF TLT.
Note the following:
- After Trump’s win, bonds are front and center.
- The chart shows when the contrary Arora call was made that bonds would fall. That call was made at a time when everyone was predicting that bonds would rise.
- The chart shows when the Arora call was made about the election. We wrote in the Morning Capsule on October 8, “In the event of a one party sweep, TLT can potentially fall to the bottom support zone.”
- The chart shows that the second Arora call on bonds has proven accurate after Trump’s win.
- The chart shows when Trump won the election.
- The chart shows that on Trump’s win, TLT gapped down and opened close to the top and of the bottom support zone. Yesterday’s bar does not show premarket data. In the premarket, TLT touched the top band of the support zone. On The Arora Report charts, premarket data is included on the current day, but not on the previous days. This methodology provides the most clarity.
- The FOMC will announce its rate decision at 2pm ET, followed by Powell’s press conference at 2:30pm ET.
- The consensus is that the Fed will cut rates by 25 bps.
- In The Arora Report analysis, the Fed could not possibly be happy about the large drop in bonds after the last rate cut. We will be paying careful attention to what Powell says about the drop in bonds in his press conference. If Powell says anything about this subject, it will be the most important new information that can be gleaned today.
- Most institutional investors and many retail investors have suffered massive losses in bonds. It is important to remember that the largest amount of money is still managed using the 60/40 portfolio as a starting point. This means 60% in stocks and 40% in bonds. The Arora Report has long shown that following the protection band is heads and shoulders above following the 60/40 portfolio. Nonetheless, the dogma of 60/40 remains popular. This is the reason we publish information on 60/40 portfolios. For those following the 60/40 portfolio, The Arora Report call has been to limit the duration to less than five years. The Arora Report call on duration has been consistent at a time when a vast majority of money managers were significantly increasing duration. The longer the bond duration, the larger the losses investors have suffered.
- In The Arora Report analysis, after Trump’s election the Fed is faced with two important issues:
- In The Arora Report analysis, depending upon how Trump implements his tariff plan, it may add 0.5% – 1% to inflation.
- According to the nonpartisan Committee for a Responsible Federal Budget, Trump’s tax plans will increase the national deficit by $7.8T over the next 10 years. All of this deficit will have to be financed by borrowing. This will increase the supply of Treasuries. A higher supply of Treasuries will lead to higher interest rates on the long end, unless the Fed decides to manipulate it with quantitative easing or some other artificial method.
- At a time when the stock market is at an all time high and bonds are suffering major losses, there is not good news on the economic data front.
- Unit labor costs are spiking. Q3 Unite Labor Costs – Preliminary came at 1.9% vs. 0.5% consensus.
- As of this writing, the momo crowd is oblivious. However, expect smart money to pay attention to this important, highly inflationary data. Also expect the Fed to pay attention to this data.
- Initial jobless claims came at 221K vs. 222K consensus. This indicates that the employment picture remains strong, especially at the low end.
- In The Arora Report analysis, there is another important question that the Fed will have to face. Trump plans to deport undocumented immigrants. According to the Department of Homeland Security, there are about 11M undocumented immigrants in the U.S. What happens to labor supply at the low end if 11M workers are taken out of the workforce? What does it do to inflation? What does it do to economic growth, and in turn the stock and bond markets?
England
The Bank of England has cut interest rates. The key interest has been reduced to 4.75% from 5%.
This is the first cut by a major central bank after Trump’s election. Investors should keep an eye on how the European Central Bank and the Bank of Japan act after Trump’s election. Remember, the U.S. economy is intertwined with the global economy.
Magnificent Seven Money Flows
In the early trade, money flows are positive in Apple Inc AAPL, Amazon.com, Inc. AMZN, Alphabet Inc Class C GOOG, Meta Platforms Inc META, Microsoft Corp MSFT, and NVIDIA Corp NVDA.
In the early trade, money flows are negative in Tesla Inc TSLA.
In the early trade, money flows are positive in SPDR S&P 500 ETF Trust SPY and Invesco QQQ Trust Series 1 QQQ.
Momo Crowd And Smart Money In Stocks
Investors can gain an edge by knowing money flows in SPY and QQQ. Investors can get a bigger edge by knowing when smart money is buying stocks, gold, and oil. The most popular ETF for gold is SPDR Gold Trust GLD. The most popular ETF for silver is iShares Silver Trust SLV. The most popular ETF for oil is United States Oil ETF USO.
Bitcoin
Bitcoin BTC/USD is range bound.
Protection Band And What To Do Now
It is important for investors to look ahead and not in the rearview mirror. The proprietary protection band from The Arora Report is very popular. The protection band puts all of the data, all of the indicators, all of the news, all of the crosscurrents, all of the models, and all of the analysis in an analytical framework that is easily actionable by investors.
Consider continuing to hold good, very long term, existing positions. Based on individual risk preference, consider a protection band consisting of cash or Treasury bills or short-term tactical trades as well as short to medium term hedges and short term hedges. This is a good way to protect yourself and participate in the upside at the same time.
You can determine your protection bands by adding cash to hedges. The high band of the protection is appropriate for those who are older or conservative. The low band of the protection is appropriate for those who are younger or aggressive. If you do not hedge, the total cash level should be more than stated above but significantly less than cash plus hedges.
A protection band of 0% would be very bullish and would indicate full investment with 0% in cash. A protection band of 100% would be very bearish and would indicate a need for aggressive protection with cash and hedges or aggressive short selling.
It is worth reminding that you cannot take advantage of new upcoming opportunities if you are not holding enough cash. When adjusting hedge levels, consider adjusting partial stop quantities for stock positions (non ETF); consider using wider stops on remaining quantities and also allowing more room for high beta stocks. High beta stocks are the ones that move more than the market.
Traditional 60/40 Portfolio
Probability based risk reward adjusted for inflation does not favor long duration strategic bond allocation at this time.
Those who want to stick to traditional 60% allocation to stocks and 40% to bonds may consider focusing on only high quality bonds and bonds of five year duration or less. Those willing to bring sophistication to their investing may consider using bond ETFs as tactical positions and not strategic positions at this time.
The Arora Report is known for its accurate calls. The Arora Report correctly called the big artificial intelligence rally before anyone else, the new bull market of 2023, the bear market of 2022, new stock market highs right after the virus low in 2020, the virus drop in 2020, the DJIA rally to 30,000 when it was trading at 16,000, the start of a mega bull market in 2009, and the financial crash of 2008. Please click here to sign up for a free forever Generate Wealth Newsletter.
Market News and Data brought to you by Benzinga APIs
© 2024 Benzinga.com. Benzinga does not provide investment advice. All rights reserved.
Interra Capital Group Successfully Closes on the Acquisition of Remington Square
HOUSTON, Nov. 7, 2024 /PRNewswire/ — Interra Capital Group, a leader in commercial real estate investments, is pleased to announce the successful acquisition of Remington Square, a distinguished three-building class A office portfolio strategically located in Houston, Texas. The financial terms of the transaction remain undisclosed, underscoring the private nature of this significant real estate deal.
Jack Polatsek, CEO of Interra Capital Group, expressed his enthusiasm about the acquisition, stating, “Closing on Remington Square comes at a pivotal time when we see a strengthening trend of return to office that aligns with the Federal Reserve cutting their benchmark rates, enhancing the intrinsic value of well-located office properties. This property represents not just an investment in real estate but an opportunity to capitalize on market dynamics that favor well-positioned assets like Remington Square.”
Judah Westreich, Chief Financial Officer at Interra Capital Group, also shared his insights: “This acquisition reflects our strategic initiative to enhance our portfolio’s quality and performance. Remington Square stands out as a prime example of the type of asset that can deliver robust returns in the current economic climate, where discerning investment and proactive management are key.”
Anita Kundaje, Director of Acquisitions at Interra Capital Group, highlighted the company’s strategy in the real estate market. “Interra is decisively in acquisition mode, aggressively pursuing opportunities to expand our portfolio with assets that demonstrate significant upside potential and strategic value,” said Kundaje. “We are actively seeking properties that align with our rigorous criteria for sustainable growth and investment returns. Our recent acquisition of Remington Square is a testament to this focused approach, as we continue to capitalize on favorable market conditions to enhance our holdings.”
About Remington Square Remington Square is a premium office complex totaling 392,357 square feet across approximately 16.96 acres in Houston, Texas. It serves as a hub for diverse businesses, featuring state-of-the-art amenities such as an on-site restaurant, a modern fitness center, tenant lounges, and ample parking with a ratio of 4.57/1,000 SF. Its strategic location affords excellent regional accessibility and proximity to Houston’s rapidly growing residential areas, making it a coveted location for existing and prospective tenants.
About Interra Capital Group Interra Capital Group is a prominent real estate investment firm specializing in the acquisition and management of commercial properties across the United States. Interra is committed to creating value through strategic investments and diligent asset management.
![]() View original content:https://www.prnewswire.com/news-releases/interra-capital-group-successfully-closes-on-the-acquisition-of-remington-square-302296998.html
View original content:https://www.prnewswire.com/news-releases/interra-capital-group-successfully-closes-on-the-acquisition-of-remington-square-302296998.html
SOURCE Interra Capital Group
Market News and Data brought to you by Benzinga APIs
© 2024 Benzinga.com. Benzinga does not provide investment advice. All rights reserved.


