Evaluating Vistra Against Peers In Independent Power and Renewable Electricity Producers Industry
In the fast-paced and highly competitive business world of today, conducting thorough company analysis is essential for investors and industry observers. In this article, we will conduct an extensive industry comparison, evaluating Vistra VST in relation to its major competitors in the Independent Power and Renewable Electricity Producers industry. Through a detailed examination of key financial metrics, market standing, and growth prospects, our objective is to provide valuable insights and illuminate company’s performance in the industry.
Vistra Background
Vistra Energy is one of the largest power producers and retail energy providers in the us Following the 2024 Energy Harbor acquisition, Vistra owns 41 gigawatts of nuclear, coal, natural gas, and solar power generation along with one of the largest utility-scale battery projects in the world. Its retail electricity business serves 5 million customers in 20 states, including almost a third of all Texas electricity consumers. Vistra emerged from the Energy Future Holdings bankruptcy as a stand-alone entity in 2016. It acquired Dynegy in 2018.
| Company | P/E | P/B | P/S | ROE | EBITDA (in billions) | Gross Profit (in billions) | Revenue Growth |
|---|---|---|---|---|---|---|---|
| Vistra Corp | 87.88 | 13.17 | 3.07 | 10.2% | $1.29 | $1.62 | 20.57% |
| The AES Corp | 10.22 | 3.18 | 0.85 | 15.73% | $1.01 | $0.72 | -4.22% |
| Central Puerto SA | 10.16 | 1.09 | 4.70 | 0.43% | $70.68 | $59.33 | 9.64% |
| Average | 10.19 | 2.14 | 2.77 | 8.08% | $35.85 | $30.02 | 2.71% |
When conducting a detailed analysis of Vistra, the following trends become clear:
-
At 87.88, the stock’s Price to Earnings ratio significantly exceeds the industry average by 8.62x, suggesting a premium valuation relative to industry peers.
-
It could be trading at a premium in relation to its book value, as indicated by its Price to Book ratio of 13.17 which exceeds the industry average by 6.15x.
-
The Price to Sales ratio of 3.07, which is 1.11x the industry average, suggests the stock could potentially be overvalued in relation to its sales performance compared to its peers.
-
With a Return on Equity (ROE) of 10.2% that is 2.12% above the industry average, it appears that the company exhibits efficient use of equity to generate profits.
-
The Earnings Before Interest, Taxes, Depreciation, and Amortization (EBITDA) of $1.29 Billion is 0.04x below the industry average, suggesting potential lower profitability or financial challenges.
-
The gross profit of $1.62 Billion is 0.05x below that of its industry, suggesting potential lower revenue after accounting for production costs.
-
With a revenue growth of 20.57%, which surpasses the industry average of 2.71%, the company is demonstrating robust sales expansion and gaining market share.
Debt To Equity Ratio
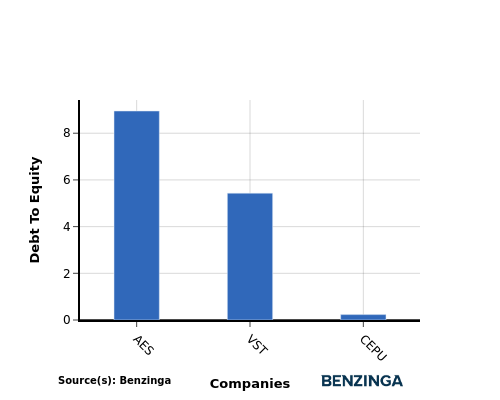
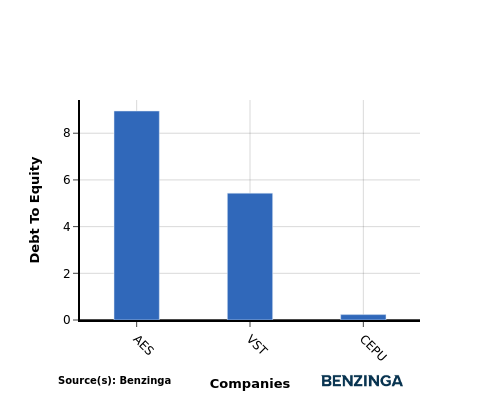
The debt-to-equity (D/E) ratio is a financial metric that helps determine the level of financial risk associated with a company’s capital structure.
Considering the debt-to-equity ratio in industry comparisons allows for a concise evaluation of a company’s financial health and risk profile, aiding in informed decision-making.
By analyzing Vistra in relation to its top 4 peers based on the Debt-to-Equity ratio, the following insights can be derived:
-
Among its top 4 peers, Vistra is placed in the middle with a moderate debt-to-equity ratio of 5.43.
-
This implies a balanced financial structure, with a reasonable proportion of debt and equity.
Key Takeaways
For Vistra, the PE, PB, and PS ratios are all high compared to its peers in the Independent Power and Renewable Electricity Producers industry, indicating potentially overvalued stock. On the other hand, Vistra’s high ROE and revenue growth suggest strong performance relative to its competitors. However, the low EBITDA and gross profit levels may raise concerns about the company’s operational efficiency and profitability compared to industry peers.
This article was generated by Benzinga’s automated content engine and reviewed by an editor.
Market News and Data brought to you by Benzinga APIs
© 2024 Benzinga.com. Benzinga does not provide investment advice. All rights reserved.
Fannie Mae Announces the Results of its Thirty-third Reperforming Loan Sale Transaction
WASHINGTON, Nov. 4, 2024 /PRNewswire/ — Fannie Mae FNMA today announced the results of its thirty-third reperforming loan sale transaction. The deal, announced on October 8, 2024, included the sale of 8,678 loans totaling $1,424,118,043 in unpaid principal balance (UPB), offered in three pools. The winning bidder for Pool 1 and Pool 2 was Pacific Investment Management Company LLC, and for Pool 3 was JP Morgan Mortgage Acquisitions Corp. The transaction is expected to close by December 20, 2024. The pools were marketed with Citigroup Global Markets Inc. as advisor.
The loan pool awarded in this most recent transaction includes:
- Pool 1: 2,924 loans with an aggregate UPB of $510,578,698; average loan size of $174,617; weighted average note rate of 3.82%; and weighted average broker’s price opinion (BPO) loan-to-value ratio of 47%.
- Pool 2: 3,311 loans with an aggregate UPB of $524,573,434; average loan size of $158,434; weighted average note rate of 4.03%; and weighted average broker’s price opinion (BPO) loan-to-value ratio of 48%.
- Pool 3: 2,443 loans with an aggregate UPB of $388,965,911; average loan size of $159,217; weighted average note rate of 3.96%; and weighted average broker’s price opinion (BPO) loan-to-value ratio of 49%.
The cover bid, which is the second highest bid for the pool, was 83.55% of UPB (32.26% of BPO) for Pool 1, 84.375% of UPB (31.73% of BPO) for Pool 2, and 82.09% of UPB (31.98% of BPO) for Pool 3.
Reperforming loans are loans that have been or are currently delinquent but have reperformed for a period of time. The terms of Fannie Mae’s reperforming loan sale require the buyer to offer loss mitigation options to any borrower who may re-default within five years following the closing of the reperforming loan sale. All purchasers are required to honor any approved or in-process loss mitigation efforts at the time of sale, including loan modifications. In addition, purchasers must offer delinquent borrowers a waterfall of loss mitigation options, including loan modifications, which may include principal forgiveness or payment deferral prior to initiating foreclosure on any loan.
Interested bidders can register for ongoing announcements, training, and other information here. Fannie Mae will also post information about specific pools available for purchase on that page.
About Fannie Mae
Fannie Mae advances equitable and sustainable access to homeownership and quality, affordable rental housing for millions of people across America. We enable the 30-year fixed-rate mortgage and drive responsible innovation to make homebuying and renting easier, fairer, and more accessible. To learn more, visit: fanniemae.com | X (formerly Twitter) | Facebook | LinkedIn | Instagram | YouTube | Blog
Fannie Mae Newsroom
https://www.fanniemae.com/news
Photo of Fannie Mae
https://www.fanniemae.com/resources/img/about-fm/fm-building.tif
Fannie Mae Resource Center
1-800-2FANNIE
![]() View original content to download multimedia:https://www.prnewswire.com/news-releases/fannie-mae-announces-the-results-of-its-thirty-third-reperforming-loan-sale-transaction-302295665.html
View original content to download multimedia:https://www.prnewswire.com/news-releases/fannie-mae-announces-the-results-of-its-thirty-third-reperforming-loan-sale-transaction-302295665.html
SOURCE Fannie Mae
Market News and Data brought to you by Benzinga APIs
© 2024 Benzinga.com. Benzinga does not provide investment advice. All rights reserved.
'Messi Of AI': Wall Street Analyst Gushes Over 'Robust' Earnings From Palantir
Wedbush analyst Dan Ives is out with an early reaction to Palantir Technologies Inc.’s PLTR “eye-popping” results, featuring beats across the board.
What To Know: Palantir, which Ives calls “The Messi of AI,” beat analyst estimates on the top and bottom lines when it reported third-quarter financial results after the market close on Monday.
Total revenue jumped 30% year-over-year as the company’s customer count grew 39%. Palantir issued fourth-quarter guidance above estimates and raised its full-year outlook across all metrics, citing “unrelenting AI demand that won’t slow down.”
“Palantir delivered another robust quarter featuring beats across the board as the company continues to see accelerated deal momentum with AIP front and center,” Ives wrote in a new note to clients following the print.
The Wedbush analyst noted that potential re-ratings are focused on U.S. Commercial strength, which remained robust in the quarter. Ives also noted U.S. Government revenue was a bright spot in the quarter with 40% year-over-year growth.
“Despite the skeptics honing in on valuation for the past year, this was a major quarter to prove that PLTR’s partner ecosystem expansion and AIP bootcamps hit another gear,” Ives said.
Palantir said it closed 104 deals worth over $1 million during the quarter. Ives explained that more and more companies are turning to Palantir to meet the rising demand for enterprise-scale generative AI solutions. He also noted Palantir is gaining share in the AI revolution.
Ives sees Palantir’s strong forward guidance as evidence that the company continues to drive pipeline growth for its AI platform AIP. Palantir guided for fourth-quarter revenue of $767 million to $771 million, which Ives said is “well ahead” of Street estimates. He also highlighted that the full-year guidance raise indicates that demand for Palantir solutions continues to accelerate, especially on the commercial side of the business.
The Wedbush analyst maintained an Outperform rating on Palantir stock following the print. It’s likely that the firm will update its price target after it digests all of the reported information for Palantir’s latest quarter.
“We look forward to hearing more on the conference call tonight regarding further momentum around AIP conversion, U.S. commercial strength, government deal cycles, and more details about its Warp Speed product,” Ives said.
PLTR Price Action: Palantir shares were up 12.77% in after-hours, trading at $46.70 at the time of publication Monday, according to Benzinga Pro.
Read Next:
Photo: Shutterstock.
Market News and Data brought to you by Benzinga APIs
© 2024 Benzinga.com. Benzinga does not provide investment advice. All rights reserved.
While Stellantis Performed Below Its Potential, Li Auto Reported Strong And Record Numbers
On Thursday, both Stellantis STLA and Li Auto Inc LI issued their third quarter results and they told quite different tales. While Stellantis reported a disappointing performance, Li Auto topped estimates with record deliveries and strong financials, however, its stock fell nevertheless.
Stellantis reported weak financials, but this was expected.
Considering that the trans-Atlantic automaker issued a profit warning back in September as it trimmed its annual guidance in response to the deteriorating global industry dynamics and needing to fix its performance in North America. Unfortunately, shipments fell in Europe as well with stringent quality requirements delaying the start of a few high-volume items.
Jeep, Dodge, Fiat, Chrysler and Peugeot owner said that net revenues for the September quarter came in at 33 billion euros, which is about $35.8 billion and largely below LSEG’s consensus estimate of 36.6 billion euros as it slumped 27%. However, Stellantis reaffirmed that it remains on track to deliver about 20 new models this year, adding that it was making good progress on slashing bloated inventories, especially in the U.S.
CFO Doug Ostermann admitted that the quarterly performance was below the automaker’s potential but also emphasized that U.S. inventories had been meaningfully reduced and reaffirmed that targets will be hit. However, with progress resolving challenges Stellantis expects to soon benefit from its significantly expanded reach with the new product wave, from 2025 and beyond.
According to Cox Automotive, Stellantis has some of the highest inventories of vehicles on dealer lots out of all brands in the U.S. In addition, Stellantis escalated its long battle with the UAW with a lawsuit over strike threats. Like many of its peers, Stellantis has been struggling with a perfect storm of challenges on the EV road, including faltering global EV demand and severe competition from China.
Meanwhile, Li Auto’s financials reflected its emerging NEV leader position in China.
Having grown deliveries by as much as 45.4%, Li Auto also grew its revenues by 23.6% as they reached $6.1 billion. Its NEV market share grew to 17.3%.
CEO, Xiang Li also revealed that cumulative vehicle deliveries have surpassed 1 million units, which means that LI Auto achieved this milestone achieved faster than its NEV peers.
However, its outlook was not as shiny considering the delayed entry to Western Europe and North America, as the focus remains on the Middle East and Central Asia. Li Auto plans to continue advancing on the autonomous driving front, with significant enhancements on the three to five years horizon.
The EV landscape continues to evolve
Also this week, Worksport Ltd. WKSP, an established innovative manufacturer of clean energy solutions for light trucks and the consumer goods sector, announced an upgrade of its solar-powered tonneau cover SOLIS. Worksport initated the alpha launch of its revolutionary off-grid power on the go duo, the SOLIS and the COR, a portable battery system back in September. Worksport now revealed that the SOLIS will be meaningfully improved to operate at 60V, which should result in substantial cost savings to the end- consumer of up to $400, while expand its addressable market size, and simplifying integration with a wider range of existing battery generator systems. Generating clean and portable power for both recreational and professional use, Worksport positioned itself in a rapidly growing market whose value surpasses $4 billion. Also in September, Worksport announced successful lab test results of its COR battery system as a Level 1 power source for Tesla Inc TSLA EVs. More precisely, the COR added approximately 7 miles of range to Tesla Model 3. By extending range, Worksport addressed a significant EV concern. Therefore, with Worksport’s intellectual portfolio, a moving clean energy microgrid made of pickup trucks powered by solar panels is no longer a dream but a preview of the EV era.
This new era brings an entirely new set of rules so even one’s legacy isn’t enough of a resource for an automaker to get to shape a new reality that is in the making.
DISCLAIMER: This content is for informational purposes only. It is not intended as investing advice.
This article is from an unpaid external contributor. It does not represent Benzinga’s reporting and has not been edited for content or accuracy.
Market News and Data brought to you by Benzinga APIs
© 2024 Benzinga.com. Benzinga does not provide investment advice. All rights reserved.
Nursing Home Operator PACS Sinks After Hindenburg Short Report
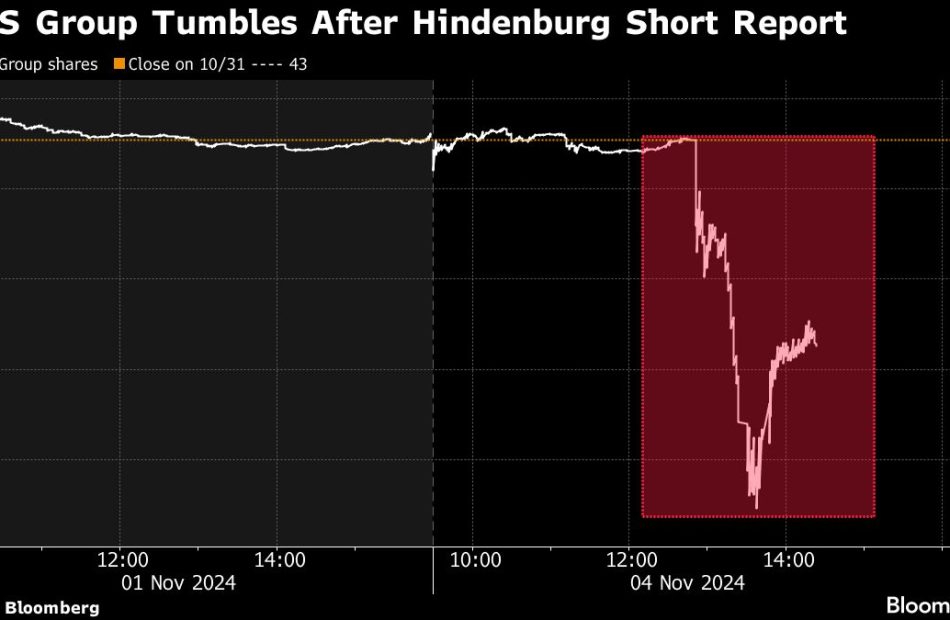
(Bloomberg) — Shares of nursing home operator PACS Group Inc. tumbled 28% on Monday after Hindenburg Research released a short report alleging that the company has been — among other things — “systematically scamming taxpayers.”
Most Read from Bloomberg
The drop triggered volatility halts in the shares of the health-care firm, and had PACS notching its worst day since its debut as a publicly traded stock in April. The stock had closed at a record high of $42.94 on Friday, more than double the initial public offering price of $21.
PACS, which is based in Farmington, Utah, didn’t respond to a Bloomberg News request for comment.
PACS manages about 284 nursing facilities across 16 states and serves more than 27,000 patients daily, according to a recent filing. Last week, PACS said it had closed the acquisition of eight nursing homes in Pennsylvania, with four of the facilities being leased from CareTrust REIT Inc.
Shares of CareTrust fell 4%, the worst one-day drop since September 2022.
Last month, Hindenburg took aim at Roblox Corp., saying in a report that the company inflated key metrics and alleging that it doesn’t have sufficient safety screens to protect children using the platform. Earlier this year, Hindenburg released a report on Super Micro Computer Inc., saying an investigation revealed “glaring accounting red flags.” Super Micro delayed filing its annual financial disclosures following the report.
Shares of PACS, which were valued at about $6.7 billion at Friday’s market close, had rallied on the back of two quarterly earnings reports that topped estimates as well as a boost to its revenue and profit guidance for the year.
PACS is scheduled to report its third quarter results Thursday after the market close.
(Updates with closing prices throughout.)
Most Read from Bloomberg Businessweek
©2024 Bloomberg L.P.
Inquiry Into Danaher's Competitor Dynamics In Life Sciences Tools & Services Industry
In the fast-paced and highly competitive business world of today, conducting thorough company analysis is essential for investors and industry observers. In this article, we will conduct an extensive industry comparison, evaluating Danaher DHR in relation to its major competitors in the Life Sciences Tools & Services industry. Through a detailed examination of key financial metrics, market standing, and growth prospects, our objective is to provide valuable insights and illuminate company’s performance in the industry.
Danaher Background
In 1984, Danaher’s founders transformed a real estate organization into an industrial-focused manufacturing company. Through a series of mergers, acquisitions, and divestitures, Danaher now focuses primarily on manufacturing scientific instruments and consumables in the life science and diagnostic industries after the late 2023 divesititure of its environmental and applied solutions group, Veralto.
| Company | P/E | P/B | P/S | ROE | EBITDA (in billions) | Gross Profit (in billions) | Revenue Growth |
|---|---|---|---|---|---|---|---|
| Danaher Corp | 46.75 | 3.49 | 7.74 | 1.62% | $1.66 | $3.4 | 3.09% |
| Thermo Fisher Scientific Inc | 34.98 | 4.36 | 5.06 | 3.38% | $2.91 | $4.35 | 0.54% |
| Agilent Technologies Inc | 28.46 | 6.66 | 6.19 | 4.65% | $0.43 | $0.85 | -5.62% |
| IQVIA Holdings Inc | 27.48 | 5.45 | 2.52 | 4.17% | $0.8 | $1.38 | 4.28% |
| Waters Corp | 36.95 | 14.34 | 7.92 | 10.71% | $0.24 | $0.42 | 4.02% |
| West Pharmaceutical Services Inc | 46.96 | 8.33 | 8.15 | 5.1% | $0.21 | $0.26 | -0.07% |
| Avantor Inc | 49.58 | 2.73 | 2.23 | 1.05% | $0.23 | $0.56 | -0.34% |
| Revvity Inc | 75.65 | 1.90 | 5.52 | 0.7% | $0.22 | $0.39 | -2.45% |
| Bio-Techne Corp | 79.27 | 5.59 | 10.32 | 1.6% | $0.07 | $0.2 | -5.44% |
| Medpace Holdings Inc | 27.98 | 11.27 | 4.94 | 11.72% | $0.12 | $0.17 | 8.29% |
| Charles River Laboratories International Inc | 21.65 | 2.51 | 2.29 | 2.44% | $0.24 | $0.35 | -3.19% |
| Bruker Corp | 24.81 | 5.02 | 2.79 | 0.47% | $0.08 | $0.38 | 17.42% |
| Stevanato Group SpA | 39.22 | 4.39 | 4.43 | 1.55% | $0.05 | $0.07 | 1.67% |
| Sotera Health Co | 113.29 | 10.62 | 4.10 | 2.05% | $0.1 | $0.15 | 8.35% |
| Average | 46.64 | 6.4 | 5.11 | 3.81% | $0.44 | $0.73 | 2.11% |
Upon a comprehensive analysis of Danaher, the following trends can be discerned:
-
The Price to Earnings ratio of 46.75 for this company is 1.0x above the industry average, indicating a premium valuation associated with the stock.
-
With a Price to Book ratio of 3.49, significantly falling below the industry average by 0.55x, it suggests undervaluation and the possibility of untapped growth prospects.
-
The stock’s relatively high Price to Sales ratio of 7.74, surpassing the industry average by 1.51x, may indicate an aspect of overvaluation in terms of sales performance.
-
The company has a lower Return on Equity (ROE) of 1.62%, which is 2.19% below the industry average. This indicates potential inefficiency in utilizing equity to generate profits, which could be attributed to various factors.
-
With higher Earnings Before Interest, Taxes, Depreciation, and Amortization (EBITDA) of $1.66 Billion, which is 3.77x above the industry average, the company demonstrates stronger profitability and robust cash flow generation.
-
Compared to its industry, the company has higher gross profit of $3.4 Billion, which indicates 4.66x above the industry average, indicating stronger profitability and higher earnings from its core operations.
-
The company is experiencing remarkable revenue growth, with a rate of 3.09%, outperforming the industry average of 2.11%.
Debt To Equity Ratio
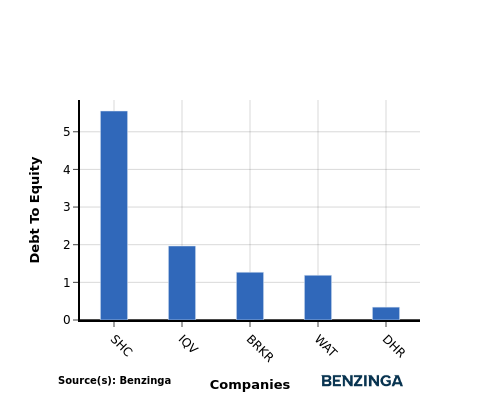
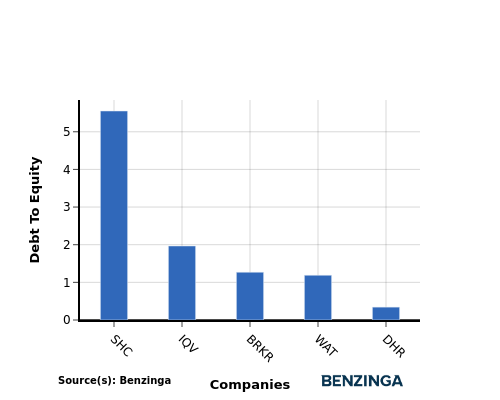
The debt-to-equity (D/E) ratio indicates the proportion of debt and equity used by a company to finance its assets and operations.
Considering the debt-to-equity ratio in industry comparisons allows for a concise evaluation of a company’s financial health and risk profile, aiding in informed decision-making.
When assessing Danaher against its top 4 peers using the Debt-to-Equity ratio, the following comparisons can be made:
-
Danaher exhibits a stronger financial position compared to its top 4 peers in the sector, as indicated by its lower debt-to-equity ratio of 0.34.
-
This suggests that the company has a more favorable balance between debt and equity, which can be seen as a positive aspect for investors.
Key Takeaways
For Danaher in the Life Sciences Tools & Services industry, the PE ratio is high compared to peers, indicating potential overvaluation. The PB ratio is low, suggesting a possible undervaluation relative to industry standards. The PS ratio is high, signaling a premium valuation based on sales. In terms of ROE, Danaher shows lower profitability compared to peers. However, its high EBITDA, gross profit, and revenue growth reflect strong operational performance within the industry sector.
This article was generated by Benzinga’s automated content engine and reviewed by an editor.
Market News and Data brought to you by Benzinga APIs
© 2024 Benzinga.com. Benzinga does not provide investment advice. All rights reserved.
Graphene Battery Market is Set to Reach US$ 1.9 Billion, with CAGR of 26.4% by 2034 | Fact.MR Report
Rockville, MD , Nov. 04, 2024 (GLOBE NEWSWIRE) — According to a revised industry report released by Fact.MR, a market research and competitive intelligence provider, the Global Graphene Battery Market is analyzed to generate a revenue of US$ 182.4 million in 2024 and has been projected to increase at a double-digit CAGR of 26.4% to touch a US$ 1.9 billion by 2034.
Globally rising sales of electric vehicles are one of the key trends in the market that is favorably influencing graphene batteries demand. High-storage and high-capacity batteries are therefore becoming more necessary. Global manufacturers are focusing their manufacturing of electric vehicles, such as cars, bikes, scooters, and bicycles, on producing models with greater range and quicker charging periods. Graphene battery technology allows energy to be stored and distributed over an extended time.
Graphene batteries are continuously gaining traction in the automotive industry because they allow electric vehicles to have a greater driving range and faster charging periods. Compared to traditional lithium-ion batteries, graphene batteries are safer, less prone to explosions, and have a faster charging speed.
North America is projected to hold a leading position throughout the projection period. The growing demand for graphene batteries from the consumer electronics and electric vehicle (EV) industries makes North America one of the key markets for graphene batteries. The region’s market is experiencing growth due to government initiatives that promote sustainable energy and cutting-edge battery technology.
For More Insights into the Market, Request a Sample of this Report: https://www.factmr.com/connectus/sample?flag=S&rep_id=8492

Key Takeaways from Market Study:
- The global market for graphene batteries is forecasted to reach a value of US$ 1.9 billion by the end of 2034.
- North America is analyzed to account for 26.4% of the global market share in 2024.
- The market in Japan is evaluated to expand at 26.7% CAGR from 2024 to 2034.
- By 2034, the market in China is projected to touch a value of US$ 205.1 million.
- Based on type, lithium-ion batteries are forecasted to generate revenue worth US$ 976 million by 2034-end.
- Revenue from graphene batteries in East Asia is analyzed to reach US$ 429.1 million by the end of 2034.
- The United States is estimated to hold 84.4% market share of the North American region in 2024.
- Demand for graphene batteries in the automotive industry is projected to reach US$ 653.2 million by 2034.
“More businesses are focusing on creating new uses for graphene batteries, such as flexible batteries for wearable technology or large-capacity batteries for electric vehicles (EVs),” says a Fact.MR analyst.
Leading Players Driving Innovation in the Graphene Batteries Market:
Vorbeck Materials Corp.; Cabot Corporation; Hybrid Kinetic Group Ltd.; Cambridge Nanosystems Ltd.; Nanotech Energy; G6 Materials Corp.; Log 9 Materials; Graphenano S.L.; Huawei; Graphene NanoChem plc; Samsung Electronics; Graphenea S.A.; XG Sciences Inc.; NanoXplore Inc.; Real Graphene USA.
Lithium-ion Batteries Gaining Traction All Over the World:
Higher performance attributes provided by graphene-enhanced technology are leading to a global increase in the demand for lithium-ion batteries. Due to the addition of graphene, which also improves the energy density, lifetime, and charging speed of lithium-ion batteries, these batteries are thought to be more effective in high-demand applications including consumer electronics, renewable energy storage, and automotive EVs.
Global efforts toward energy efficiency, long-lasting batteries, and sustainable solutions are supported by these ongoing improvements. Growing numbers of companies are implementing improved battery technology to meet the increasing needs for performance and sustainability, which has led to the popularity of lithium-ion batteries with graphene components.
Graphene Batteries Industry News:
- EnyGy, a Melbourne-based firm founded on research by Prof. Dan Li and Dr. Yufei Wang at Monash University, launched an ultracapacitor that utilizes the most recent advancements in graphene technology.
- The S1 Lite is an electric scooter launched by iVOOMi, an Indian EV startup. It comes with two battery options: graphene and lithium-ion.
Get Customization on this Report for Specific Research Solutions: https://www.factmr.com/connectus/sample?flag=S&rep_id=8492
More Valuable Insights on Offer
Fact.MR, in its new offering, presents an unbiased analysis of the graphene battery market, presenting historical demand data (2019 to 2023) and forecast statistics for 2024 to 2034.
The study divulges essential insights into the market based on type (lithium-ion, lithium-sulphur, lead-acid) and end-use industry (aerospace & defense, life science & scientific research, medical, industrial, telecom, semiconductor & electronics, oil & gas), across seven major regions of the world (North America, Western Europe, Eastern Europe, East Asia, Latin America, South Asia & Pacific, and MEA).
Segmentation of Graphene Battery Market Research:
- By Type :
- Lithium-ion
- Lithium-sulphur
- Lead-acid
- By End-Use Industry :
- Aerospace & Defense
- Life Science & Scientific Research
- Medical
- Industrial
- Telecom
- Semiconductor & Electronics
- Oil & Gas
Checkout More Related Studies Published by Fact.MR Research:
The global HVAC relay market is valued at US$ 4 billion in 2023 and is predicted to reach a market size of US$ 7.2 billion by the end of 2033. Global demand for HVAC relays is estimated to increase at a CAGR of 6% from 2023 to 2033.
The wind turbine drone inspection market is projected to reach a valuation of US$ 418.8 million in 2024 and will top US$ 1,608.0 million by 2034, growing with a CAGR of around 14.4% from 2024-2034.
Expanding at a CAGR of 6.3%, the global marine turbochargers market is projected to increase from a valuation of US$ 635.6 million in 2022 to US$ 1.17 billion by 2032.
The 3D Printer Filament Recycler Market is estimated to be around US$ 161.6 million in 2024. 3D printer filament recycler sales are projected to increase at a CAGR of 3.6%, reaching over US$ 230.2 million by 2034.
The global vertical mast lifts market size stands at US$ 1.54 billion and is predicted to expand at a CAGR of 4.8% to reach a value of US$ 2.46 billion by the end of 2032.
Europe loader claw market is anticipated to project a valuation of US$ 108.0 million in 2023 and further expand at a CAGR of 4.1% to reach US$ 162.0 million by the end of 2033.
About Us:
Fact.MR is a distinguished market research company renowned for its comprehensive market reports and invaluable business insights. As a prominent player in business intelligence, we deliver deep analysis, uncovering market trends, growth paths, and competitive landscapes. Renowned for its commitment to accuracy and reliability, we empower businesses with crucial data and strategic recommendations, facilitating informed decision-making and enhancing market positioning.
With its unwavering dedication to providing reliable market intelligence, FACT.MR continues to assist companies in navigating dynamic market challenges with confidence and achieving long-term success. With a global presence and a team of experienced analysts, FACT.MR ensures its clients receive actionable insights to capitalize on emerging opportunities and stay ahead in the competitive landscape.
Contact:
US Sales Office:
11140 Rockville Pike
Suite 400
Rockville, MD 20852
United States
Tel: +1 (628) 251-1583
Sales Team: sales@factmr.com
Follow Us: LinkedIn | Twitter | Blog

© 2024 Benzinga.com. Benzinga does not provide investment advice. All rights reserved.
Cool Roof Coating Market is Projected to Reach a US$ 9.51 Billion with 6.8% CAGR by 2034 | Fact.MR Report
Rockville, MD , Nov. 04, 2024 (GLOBE NEWSWIRE) — With energy prices rising, the need reduce usage has never been greater before. Worldwide Demand for Cool Roof Coatings Market is poised to reach a market value of US$ 4.92 billion in 2024, as mentioned in the revised market research analysis published by Fact.MR, a market research and competitive intelligence provider. The market for cool roof coatings is projected to expand at 6.8% CAGR from 2024 to 2034.
In recent years, there has been an increase in the demand for energy-saving building materials. They are used for new homes and the renovation of commercial and residential buildings. Cool roof coatings offer improved and secure structures, which are estimated to promote economic and environmental stability. Further, cool roof coatings also assist in minimizing energy costs as they transfer comparatively less heat to buildings and therefore remain cooler. This ultimately leads to the use of less energy in air conditioning systems.
For More Insights into the Market, Request a Sample of this Report: https://www.factmr.com/connectus/sample?flag=S&rep_id=2364
 Key Takeaway from Market Study:
- Sales of cool roof coatings are estimated to reach US$ 4.92 billion in 2024.
- The global cool roof coating market is projected to reach a value of US$ 9.51 billion by the end of 2034.
- The market has been projected to expand at a CAGR of 6.8% from 2024 to 2034.
- Demand for cool roof coatings in South Korea is projected to rise at 8.1% CAGR through 2034.
- The healthcare sector is set to account for 52% share of the global market by 2034-end.
- East Asia is approximated to contribute 24.6% share of global market revenue by the end of 2034.
“Increasing consumer inclination toward energy saving solutions, implementation of green building codes, and rising global warming are contributing to growing use of cool roof coatings,” says a Fact.MR analyst.
Leading Players Driving Innovation in the Cool Roof Coating Market:
Leading manufacturers of cool roof coatings are Sherwin Williams, Kansai Paints Co. Ltd., Valspar Corporation, National Coatings Corporation, BASF SE, Nippon Paints, Monarch Industries, Sika AG, GAF Materials, Akzo Nobel, PPG Industries Inc., DowDupont, Excel Coatings, and Nutech Paints.
Expansion of Construction Sector Means High Cool Roof Coating Use in China:
Demand for cool roof coatings in China is projected to increase at a CAGR of 6.4% and reach a market valuation of US$ 1.34 billion by 2034-end. The rising demand for cool roof coatings in the country is attributed to the growing count of infrastructure activities. In addition, the increasing population is generating demand for living space, which contributes to the expansion of the construction sector, subsequently, an increase in the demand for cool roof coatings is experienced.
More Valuable Insights on Offer:
Fact.MR, in its new offering, presents an unbiased analysis of the cool roof coating market, presenting historical demand data (2018 to 2023) and forecast statistics for the period (2024 to 2034).
The study divulges essential insights into the market based on roof type (low-slope, steep-slope), material (elastomeric plastic, silicon, tiles, metal), technology (water-based, solvent-based), and application (residential, commercial, hospitality, healthcare), across six major regions of the world (North America, Europe, East Asia, Latin America, South Asia & Oceania, and MEA).
Get Customization on this Report for Specific Research Solutions: https://www.factmr.com/connectus/sample?flag=S&rep_id=2364
Country-wise Insights:
The demand outlook for cool roof coatings in the United States is strong, with the market value expected to reach US$ 759.3 million in 2024, growing at a compound annual growth rate (CAGR) of 4.9% from 2024 to 2034. By 2034, the market is projected to be worth US$ 1.22 billion.
The U.S. is anticipated to hold 73.5% of the North American market by the end of 2034. With buildings and homes accounting for a significant share of total energy use, increasing consumer awareness about energy consumption, alongside the implementation of LEED (Leadership in Energy and Environmental Design) initiatives for green building certification, is set to positively influence the market trends for cool roof coatings in the United States.
Segmentation of Cool Roof Coating Market Research:
- By Roof Type :
- By Material Type :
- Elastomeric Plastic
- Silicon
- Tiles
- Metal
- By Technology :
- By Region :
- Residential
- Commercial
- Hospitality
- Healthcare
Checkout More Related Studies Published by Fact.MR Research:
Roofing Market: Global demand for roofing materials is expected to increase at a CAGR of 5.5% from 2023 to 2033. The global roofing market is valued at US$ 82.2 billion in 2023 and is this expected to reach US$ 140.4 billion by the end of 2033.
Waterproofing Membranes Market: The waterproofing membrane market is estimated to be valued at US$ 31.5 billion in 2023. Waterproofing material is a thin impermeable membrane that functions along with asphalt to provide protection to the underlying structure of the buildings.
Roofing Adhesives Market: The global roofing adhesives market has reached a valuation of US$ 6.6 billion in 2023 and is projected to climb to US$ 16 billion by 2033-end, expanding at a noteworthy CAGR of 9.2% over the next 10 years (2023 to 2033, according to a detailed industry analysis by Fact. MR.
Steep Slope Roofing Material Market: The global steep slope roofing material market size is set to reach a valuation of US$ 15.12 billion in 2024. As per this latest industry analysis by Fact.MR, the market has been projected to expand at a CAGR of 3.3% to end up at US$ 20.92 billion by 2034.
Waterproofing Chemical Market: The global waterproofing chemical market size is expected to reach a valuation of US$ 4.43 billion in 2024 and climb to a size of US$ 6.49 billion by the end of 2034. The market is forecasted to expand at 3.9% CAGR from 2024 to 2034.
About Us:
Fact.MR is a distinguished market research company renowned for its comprehensive market reports and invaluable business insights. As a prominent player in business intelligence, we deliver deep analysis, uncovering market trends, growth paths, and competitive landscapes. Renowned for its commitment to accuracy and reliability, we empower businesses with crucial data and strategic recommendations, facilitating informed decision-making and enhancing market positioning.
With its unwavering dedication to providing reliable market intelligence, FACT.MR continues to assist companies in navigating dynamic market challenges with confidence and achieving long-term success. With a global presence and a team of experienced analysts, FACT.MR ensures its clients receive actionable insights to capitalize on emerging opportunities and stay ahead in the competitive landscape.
Contact:
US Sales Office:
11140 Rockville Pike
Suite 400
Rockville, MD 20852
United States
Tel: +1 (628) 251-1583
Sales Team: sales@factmr.com

© 2024 Benzinga.com. Benzinga does not provide investment advice. All rights reserved.

