Spotlight on HCA Healthcare: Analyzing the Surge in Options Activity
Benzinga’s options scanner just detected over 8 options trades for HCA Healthcare HCA summing a total amount of $532,222.
At the same time, our algo caught 6 for a total amount of 637,251.
Predicted Price Range
Taking into account the Volume and Open Interest on these contracts, it appears that whales have been targeting a price range from $315.0 to $335.0 for HCA Healthcare over the last 3 months.
Volume & Open Interest Trends
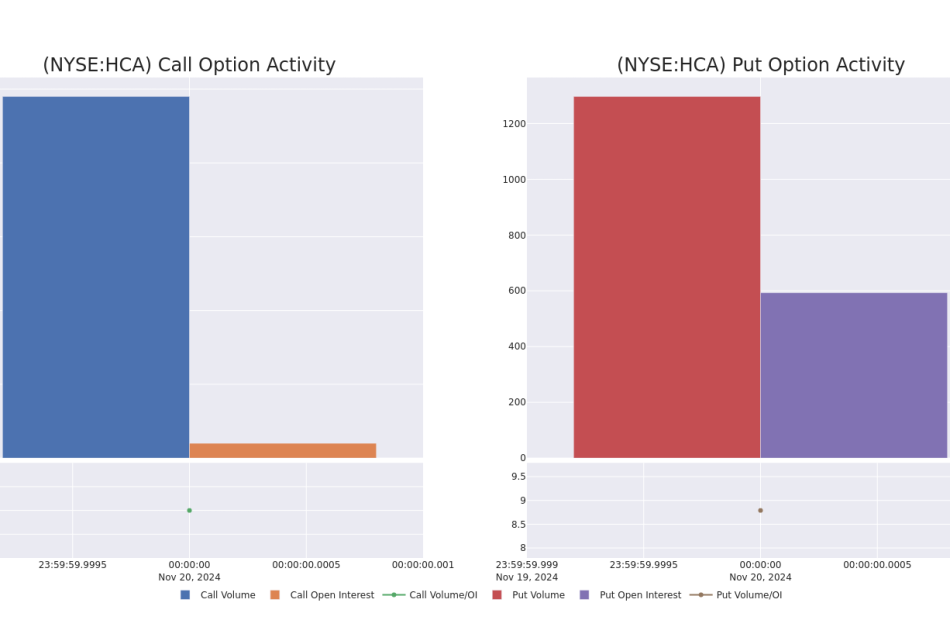
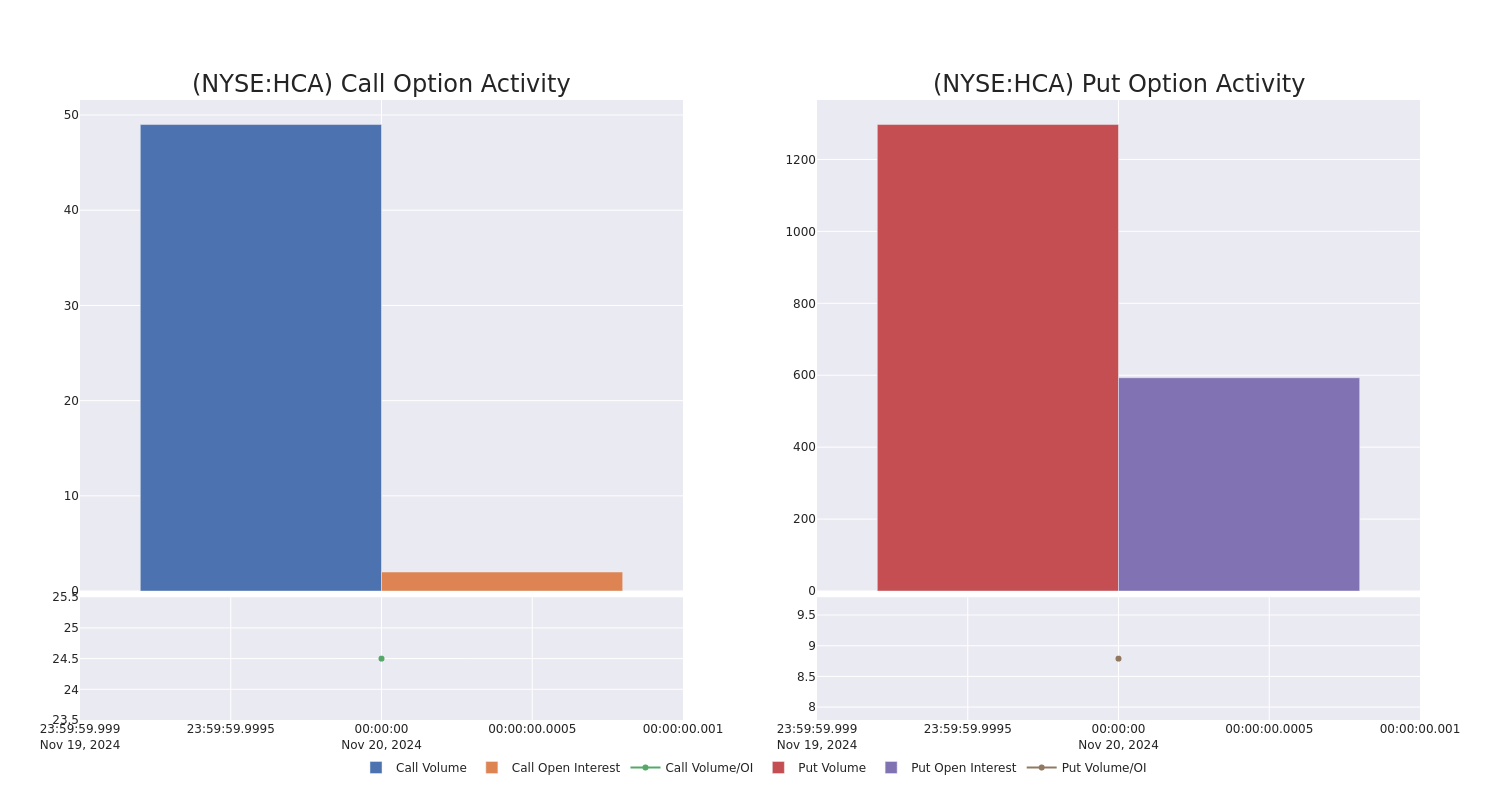
Looking at the volume and open interest is a powerful move while trading options. This data can help you track the liquidity and interest for HCA Healthcare’s options for a given strike price. Below, we can observe the evolution of the volume and open interest of calls and puts, respectively, for all of HCA Healthcare’s whale trades within a strike price range from $315.0 to $335.0 in the last 30 days.
HCA Healthcare Option Activity Analysis: Last 30 Days
Biggest Options Spotted:
| Symbol | PUT/CALL | Trade Type | Sentiment | Exp. Date | Ask | Bid | Price | Strike Price | Total Trade Price | Open Interest | Volume |
|---|---|---|---|---|---|---|---|---|---|---|---|
| HCA | PUT | SWEEP | BEARISH | 12/20/24 | $8.6 | $8.4 | $8.6 | $325.00 | $215.7K | 86 | 262 |
| HCA | PUT | SWEEP | BULLISH | 12/20/24 | $9.6 | $9.5 | $9.5 | $330.00 | $139.7K | 97 | 150 |
| HCA | PUT | SWEEP | BULLISH | 12/20/24 | $9.7 | $9.7 | $9.7 | $330.00 | $95.9K | 97 | 259 |
| HCA | CALL | SWEEP | BULLISH | 02/21/25 | $18.4 | $18.3 | $18.4 | $335.00 | $80.9K | 2 | 36 |
| HCA | PUT | SWEEP | BULLISH | 01/17/25 | $7.8 | $7.2 | $7.2 | $315.00 | $72.7K | 410 | 222 |
About HCA Healthcare
HCA Healthcare is a Nashville-based healthcare provider organization operating the largest collection of acute-care hospitals in the United States. As of June 2024, the firm owned and operated 188 hospitals, 123 freestanding outpatient surgery centers, and a broad network of physician offices, urgent-care clinics, and freestanding emergency rooms across 20 states and a small foothold in England.
Following our analysis of the options activities associated with HCA Healthcare, we pivot to a closer look at the company’s own performance.
Where Is HCA Healthcare Standing Right Now?
- With a volume of 505,703, the price of HCA is down -1.79% at $329.1.
- RSI indicators hint that the underlying stock may be oversold.
- Next earnings are expected to be released in 69 days.
What The Experts Say On HCA Healthcare
In the last month, 5 experts released ratings on this stock with an average target price of $401.4.
Turn $1000 into $1270 in just 20 days?
20-year pro options trader reveals his one-line chart technique that shows when to buy and sell. Copy his trades, which have had averaged a 27% profit every 20 days. Click here for access.
* An analyst from Wells Fargo has decided to maintain their Equal-Weight rating on HCA Healthcare, which currently sits at a price target of $395.
* An analyst from Barclays has decided to maintain their Overweight rating on HCA Healthcare, which currently sits at a price target of $392.
* Maintaining their stance, an analyst from Keybanc continues to hold a Overweight rating for HCA Healthcare, targeting a price of $420.
* An analyst from Oppenheimer persists with their Outperform rating on HCA Healthcare, maintaining a target price of $400.
* An analyst from Wells Fargo persists with their Equal-Weight rating on HCA Healthcare, maintaining a target price of $400.
Options trading presents higher risks and potential rewards. Astute traders manage these risks by continually educating themselves, adapting their strategies, monitoring multiple indicators, and keeping a close eye on market movements. Stay informed about the latest HCA Healthcare options trades with real-time alerts from Benzinga Pro.
Market News and Data brought to you by Benzinga APIs
© 2024 Benzinga.com. Benzinga does not provide investment advice. All rights reserved.
A Look Ahead: Ross Stores's Earnings Forecast
Ross Stores ROST is set to give its latest quarterly earnings report on Thursday, 2024-11-21. Here’s what investors need to know before the announcement.
Analysts estimate that Ross Stores will report an earnings per share (EPS) of $1.40.
The announcement from Ross Stores is eagerly anticipated, with investors seeking news of surpassing estimates and favorable guidance for the next quarter.
It’s worth noting for new investors that guidance can be a key determinant of stock price movements.
Past Earnings Performance
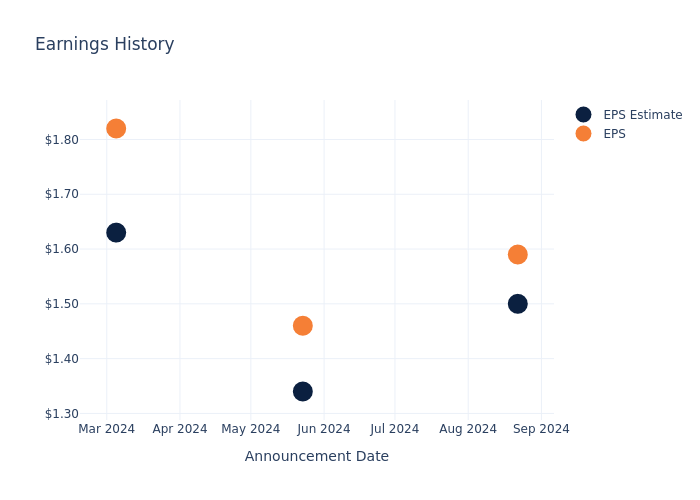
The company’s EPS beat by $0.09 in the last quarter, leading to a 1.76% increase in the share price on the following day.
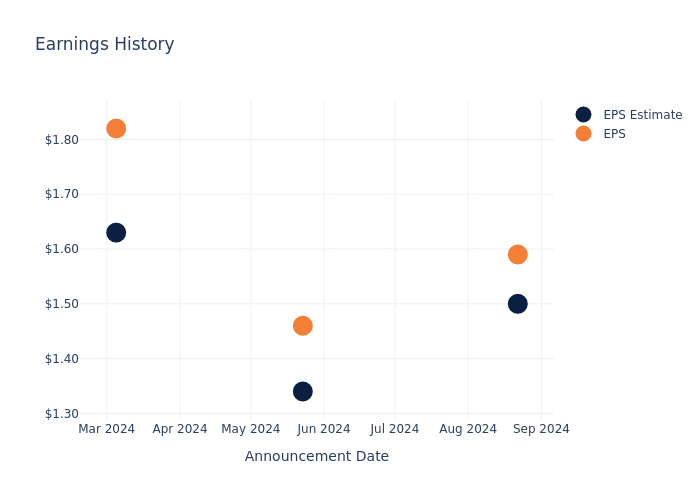
Here’s a look at Ross Stores’s past performance and the resulting price change:
| Quarter | Q2 2024 | Q1 2024 | Q4 2023 | Q3 2023 |
|---|---|---|---|---|
| EPS Estimate | 1.50 | 1.34 | 1.63 | 1.21 |
| EPS Actual | 1.59 | 1.46 | 1.82 | 1.33 |
| Price Change % | 2.0% | 8.0% | -1.0% | 7.000000000000001% |
Performance of Ross Stores Shares
Shares of Ross Stores were trading at $139.26 as of November 19. Over the last 52-week period, shares are up 5.61%. Given that these returns are generally positive, long-term shareholders should be satisfied going into this earnings release.
Analyst Insights on Ross Stores
For investors, staying informed about market sentiments and expectations in the industry is paramount. This analysis provides an exploration of the latest insights on Ross Stores.
Ross Stores has received a total of 14 ratings from analysts, with the consensus rating as Neutral. With an average one-year price target of $174.93, the consensus suggests a potential 25.61% upside.
Peer Ratings Comparison
The following analysis focuses on the analyst ratings and average 1-year price targets of Burlington Stores, Gap and Abercrombie & Fitch, three prominent industry players, providing insights into their relative performance expectations and market positioning.
- Burlington Stores received a Outperform consensus from analysts, with an average 1-year price target of $309.85, implying a potential 122.5% upside.
- Gap received a Neutral consensus from analysts, with an average 1-year price target of $27.17, implying a potential 80.49% downside.
- As per analysts’ assessments, Abercrombie & Fitch is favoring an Neutral trajectory, with an average 1-year price target of $185.62, suggesting a potential 33.29% upside.
Comprehensive Peer Analysis Summary
In the peer analysis summary, key metrics for Burlington Stores, Gap and Abercrombie & Fitch are highlighted, providing an understanding of their respective standings within the industry and offering insights into their market positions and comparative performance.
| Company | Consensus | Revenue Growth | Gross Profit | Return on Equity |
|---|---|---|---|---|
| Ross Stores | Neutral | 7.15% | $1.50B | 10.46% |
| Burlington Stores | Outperform | 13.37% | $1.06B | 7.02% |
| Gap | Neutral | 4.85% | $1.58B | 7.35% |
| Abercrombie & Fitch | Neutral | 21.24% | $736.26M | 11.65% |
Key Takeaway:
Ross Stores ranks in the middle for Consensus rating among its peers. It ranks at the bottom for Revenue Growth. It is at the top for Gross Profit. It is in the middle for Return on Equity.
About Ross Stores
Ross Stores operates as an off-price apparel and accessories retailer with the majority of its sales derived from its Ross Dress for Less banner. The firm opportunistically procures excess brand-name merchandise made available via manufacturing overruns and retail liquidation sales at a 20%-60% discount to full prices. As such, its stores are often filled with a vast array of stock-keeping units, each with minimal product depth that creates a treasure hunt shopping experience. The firm’s more than 1,750 Ross Dress for Less stores are primarily located in densely populated suburban communities and typically serve middle-income consumers. Ross also operates about 350 DD’s Discounts chains targeting lower-income shoppers.
Key Indicators: Ross Stores’s Financial Health
Market Capitalization: Exceeding industry standards, the company’s market capitalization places it above industry average in size relative to peers. This emphasizes its significant scale and robust market position.
Revenue Growth: Ross Stores displayed positive results in 3 months. As of 31 July, 2024, the company achieved a solid revenue growth rate of approximately 7.15%. This indicates a notable increase in the company’s top-line earnings. When compared to others in the Consumer Discretionary sector, the company excelled with a growth rate higher than the average among peers.
Net Margin: Ross Stores’s net margin surpasses industry standards, highlighting the company’s exceptional financial performance. With an impressive 9.97% net margin, the company effectively manages costs and achieves strong profitability.
Return on Equity (ROE): Ross Stores’s ROE surpasses industry standards, highlighting the company’s exceptional financial performance. With an impressive 10.46% ROE, the company effectively utilizes shareholder equity capital.
Return on Assets (ROA): Ross Stores’s ROA surpasses industry standards, highlighting the company’s exceptional financial performance. With an impressive 3.61% ROA, the company effectively utilizes its assets for optimal returns.
Debt Management: Ross Stores’s debt-to-equity ratio is below the industry average. With a ratio of 1.14, the company relies less on debt financing, maintaining a healthier balance between debt and equity, which can be viewed positively by investors.
To track all earnings releases for Ross Stores visit their earnings calendar on our site.
This article was generated by Benzinga’s automated content engine and reviewed by an editor.
Market News and Data brought to you by Benzinga APIs
© 2024 Benzinga.com. Benzinga does not provide investment advice. All rights reserved.
According To Dave Ramsey, Answering These Two Questions Could Be The Difference Between Living Wealthy Or Struggling Financially
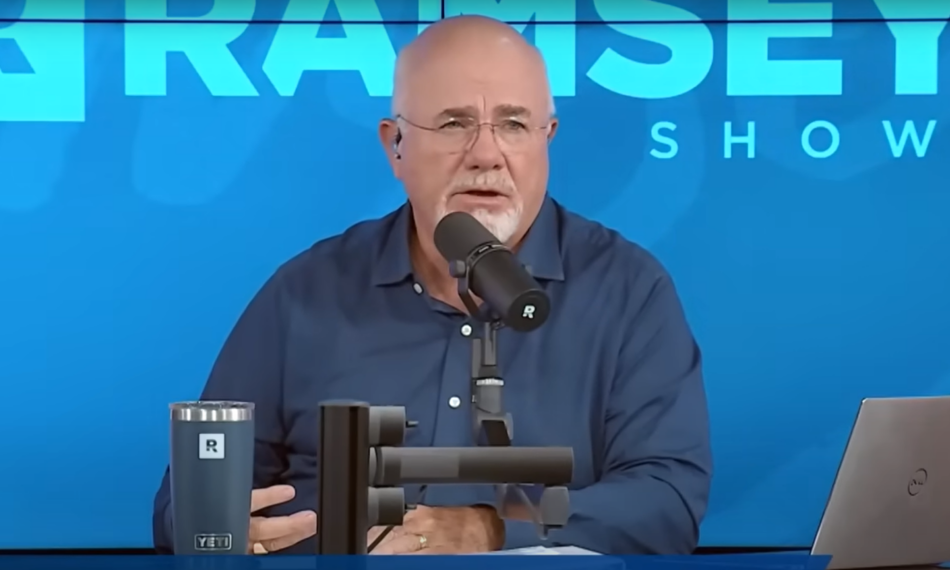
Dave Ramsey, the popular personal finance expert, believes that two simple questions could be a game-changer for anyone hoping to build wealth: “How much does it cost?” and “How much is the down payment?”
Ramsey says those with a healthy financial mindset tend to ask the first question, while others struggling financially often ask the second. He argues that this subtle difference is more important than many realize.
Don’t Miss:
Ramsey’s point hits home, given some eye-opening statistics on American debt and spending habits. According to a recent study by Debt.com, roughly 80% of U.S. workers live paycheck to paycheck, with nearly a quarter unable to save anything month-to-month.
In addition, about 37% of Americans would be unable to cover $400 in emergency expenses. These numbers show the impact of taking on too many high monthly payments without thinking through the long-term consequences, as Ramsey cautions.
As personal debt levels soar, Ramsey’s advice on credit cards resonates with many. Experian research shows that one in three Americans has maxed out their credit cards and the average American carries about $104,215 in total debt across mortgages, credit cards and other loans.
Trending: The number of ‘401(k)’ Millionaires is up 43% from last year — Here are three ways to join the club.
Credit card debt alone has hit record highs, reaching over $1 trillion in the third quarter of 2024. Debt.com also found that 45% of Americans have relied on credit cards for everyday expenses due to inflation, with many unable to pay off their balances fully.
The rise in debt is not just a concern for households but also a boon for credit card companies. Visa and Mastercard stocks have seen considerable gains, with Visa nearing its 52-week high. These companies are thriving partly due to Americans’ increasing dependence on credit.
Ramsey’s advice, while straightforward, has its critics. They argue that worrying about the total cost is not always possible. Many people are just trying to make ends meet. For lower-income families, prioritizing immediate cash flow may sometimes be the only option, despite Ramsey’s call to “think bigger” financially.
See Also: Deloitte’s fastest-growing software company partners with Amazon, Walmart & Target – You can still get 4,000 of its pre-IPO shares for with $1,000 for just $0.25/share
Ramsey suggests a few practical steps for those determined to break free from debt: creating a weekly budget and being strict about need versus want. A small emergency fund, he adds, can be invaluable in avoiding debt during unexpected expenses.
Check Out What Whales Are Doing With Home Depot
Financial giants have made a conspicuous bullish move on Home Depot. Our analysis of options history for Home Depot HD revealed 9 unusual trades.
Delving into the details, we found 44% of traders were bullish, while 44% showed bearish tendencies. Out of all the trades we spotted, 2 were puts, with a value of $69,300, and 7 were calls, valued at $255,371.
What’s The Price Target?
After evaluating the trading volumes and Open Interest, it’s evident that the major market movers are focusing on a price band between $365.0 and $420.0 for Home Depot, spanning the last three months.
Insights into Volume & Open Interest
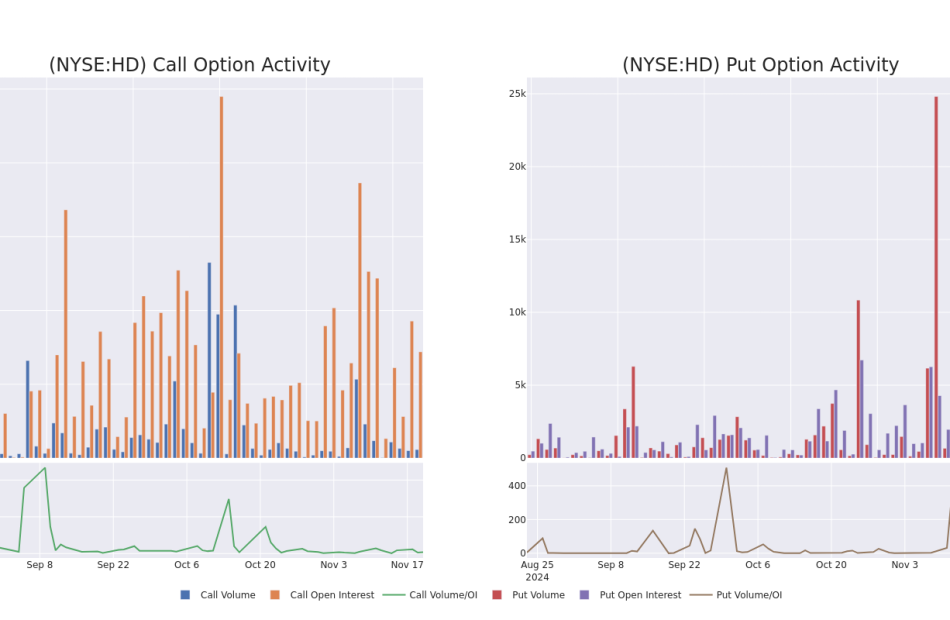
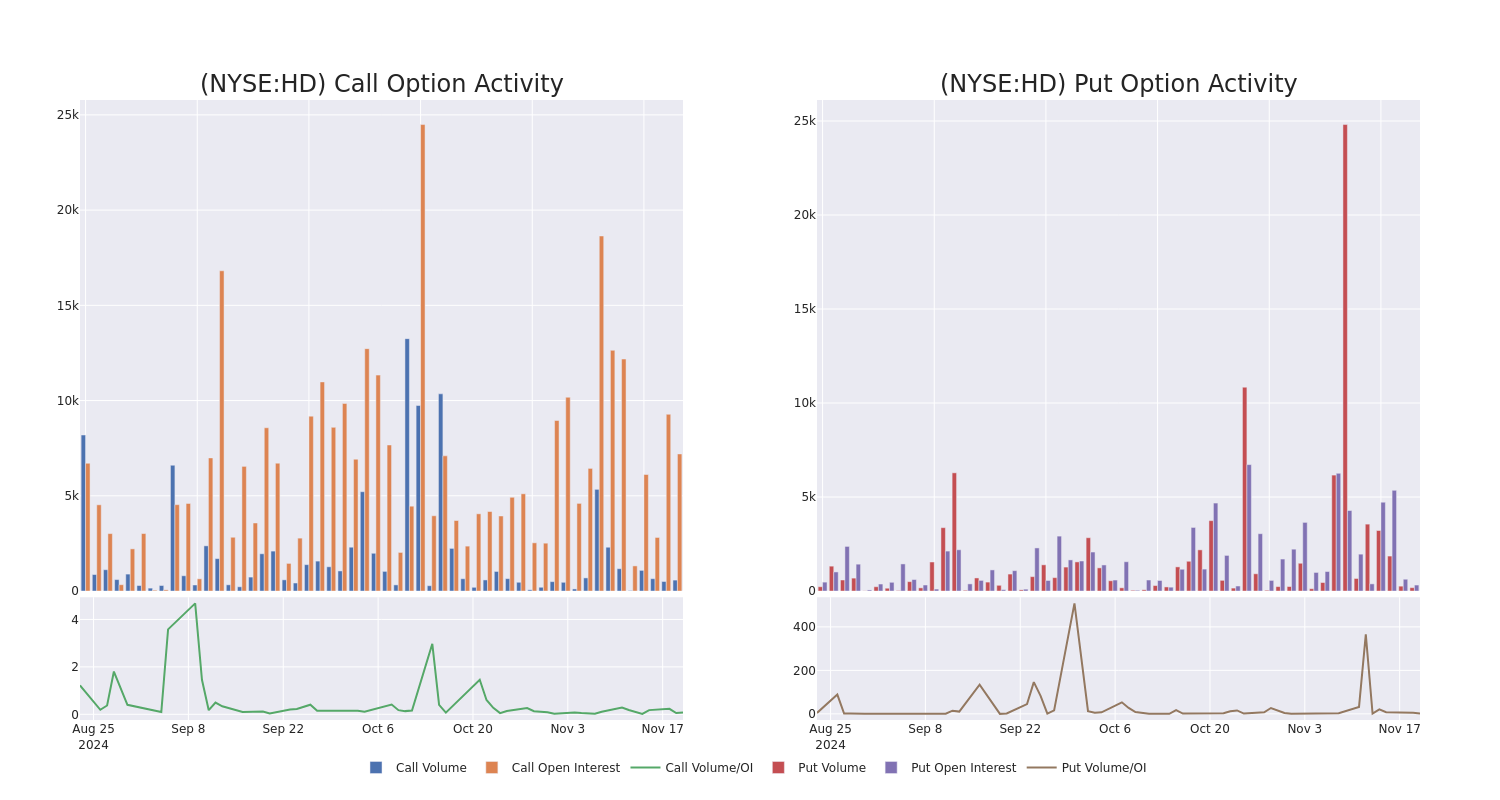
Assessing the volume and open interest is a strategic step in options trading. These metrics shed light on the liquidity and investor interest in Home Depot’s options at specified strike prices. The forthcoming data visualizes the fluctuation in volume and open interest for both calls and puts, linked to Home Depot’s substantial trades, within a strike price spectrum from $365.0 to $420.0 over the preceding 30 days.
Home Depot 30-Day Option Volume & Interest Snapshot
Largest Options Trades Observed:
| Symbol | PUT/CALL | Trade Type | Sentiment | Exp. Date | Ask | Bid | Price | Strike Price | Total Trade Price | Open Interest | Volume |
|---|---|---|---|---|---|---|---|---|---|---|---|
| HD | CALL | TRADE | BULLISH | 01/17/25 | $41.2 | $39.9 | $41.2 | $365.00 | $53.5K | 30 | 13 |
| HD | PUT | TRADE | BEARISH | 12/27/24 | $4.35 | $2.55 | $4.35 | $385.00 | $43.4K | 122 | 100 |
| HD | CALL | TRADE | NEUTRAL | 02/21/25 | $10.7 | $10.25 | $10.49 | $420.00 | $41.9K | 482 | 46 |
| HD | CALL | TRADE | BULLISH | 06/20/25 | $26.2 | $26.2 | $26.2 | $410.00 | $39.3K | 1.7K | 2 |
| HD | CALL | SWEEP | BEARISH | 11/22/24 | $2.38 | $2.37 | $2.37 | $405.00 | $35.5K | 205 | 337 |
About Home Depot
Home Depot is the world’s largest home improvement specialty retailer, operating more than 2,300 warehouse-format stores offering more than 30,000 products in store and 1 million products online in the US, Canada, and Mexico. Its stores offer numerous building materials, home improvement products, lawn and garden products, and decor products and provide various services, including home improvement installation services and tool and equipment rentals. The acquisition of Interline Brands in 2015 allowed Home Depot to enter the MRO business, which has been expanded through the tie-up with HD Supply (2020). The additions of the Company Store brought textiles to the lineup, and the recent tie-up with SRS will help grow professional demand in roofing, pool and landscaping projects.
Current Position of Home Depot
- With a trading volume of 901,415, the price of HD is down by -1.28%, reaching $401.61.
- Current RSI values indicate that the stock is is currently neutral between overbought and oversold.
- Next earnings report is scheduled for 90 days from now.
Professional Analyst Ratings for Home Depot
A total of 5 professional analysts have given their take on this stock in the last 30 days, setting an average price target of $445.8.
Turn $1000 into $1270 in just 20 days?
20-year pro options trader reveals his one-line chart technique that shows when to buy and sell. Copy his trades, which have had averaged a 27% profit every 20 days. Click here for access.
* Maintaining their stance, an analyst from Wells Fargo continues to hold a Overweight rating for Home Depot, targeting a price of $430.
* An analyst from Truist Securities persists with their Buy rating on Home Depot, maintaining a target price of $459.
* An analyst from Telsey Advisory Group persists with their Outperform rating on Home Depot, maintaining a target price of $455.
* Maintaining their stance, an analyst from Truist Securities continues to hold a Buy rating for Home Depot, targeting a price of $465.
* Maintaining their stance, an analyst from Barclays continues to hold a Overweight rating for Home Depot, targeting a price of $420.
Trading options involves greater risks but also offers the potential for higher profits. Savvy traders mitigate these risks through ongoing education, strategic trade adjustments, utilizing various indicators, and staying attuned to market dynamics. Keep up with the latest options trades for Home Depot with Benzinga Pro for real-time alerts.
Market News and Data brought to you by Benzinga APIs
© 2024 Benzinga.com. Benzinga does not provide investment advice. All rights reserved.
Powell Industries Faces Seasonally Slow Q1 Start After Mixed Q4; Stock Tanks
Powell Industries, Inc. POWL shares are trading lower on Wednesday after the company reported fourth-quarter results after the markets closed on Tuesday.
Revenues surged 32% year over year to $275 million, which missed the consensus of $286.49 million.
The revenue growth was led by the Petrochemical sector (+112% Y/Y), Oil & Gas sector (+23% Y/Y), and Commercial & Other Industrial sector (+66% Y/Y).
New orders rose to $267 million from $171 million a year ago, driven by strong demand in the Oil & Gas, Petrochemical, and Electric Utility sectors.
Gross profit increased 55% Y/Y to $80 million, with a margin of 29.2% vs. 24.9% a year ago quarter. EPS of $3.77 surpassed the consensus of $3.55.
Brett A. Cope, Powell’s Chairman and Chief Executive Officer, said, “We experienced tremendous growth in our largest markets, with our top line growing by 45% in fiscal 2024. We continue to execute at a high standard for both our customers and our shareholders as reflected by our gross margin, which improved 590 basis points compared to the prior year.”
”Having recorded our second consecutive year of more than $1.0 billion in new orders, we continue to grow in our traditional markets of oil & gas, petrochemical and electrical utilities, while further diversifying in markets such as data centers, hydrogen, carbon capture and other alternative fuels.”
As of September 30, 2024, cash and short-term investments totaled $358 million. Backlog remained steady at $1.3 billion as of September 30, 2024, consistent with levels at both June 30, 2024, and September 30, 2023.
Michael Metcalf, Chief Financial Officer, said, “As we look ahead to fiscal 2025, we expect continued strength across most of our end markets spanning across all of the geographies that we compete in.”
”We are pleased with our fiscal 2024 results and remain focused on carrying forward the strong operational execution and commercial momentum that we have experienced this year, into fiscal 2025.”
”Notwithstanding our seasonally slower fiscal first quarter, considering the healthy backdrop, robust backlog, strong liquidity, and a solid balance sheet, we anticipate that fiscal 2025 will be another successful year for Powell.“
Investors can gain exposure to the stock via Innovator IBD 50 ETF FFTY and Tidal ETF Trust Aztlan Global Stock Selection DM SMID ETF AZTD.
Price Action: POWL shares are down 15% at $265.63 at the last check Wednesday.
Image via Shutterstock
Read Next:
Market News and Data brought to you by Benzinga APIs
© 2024 Benzinga.com. Benzinga does not provide investment advice. All rights reserved.
Willis Lease Finance Insider Trades Send A Signal
Making a noteworthy insider sell on November 19, Rae Ann McKeating, Board Member at Willis Lease Finance WLFC, is reported in the latest SEC filing.
What Happened: A Form 4 filing from the U.S. Securities and Exchange Commission on Tuesday showed that McKeating sold 750 shares of Willis Lease Finance. The total transaction amounted to $143,837.
The latest market snapshot at Wednesday morning reveals Willis Lease Finance shares down by 1.78%, trading at $187.7.
Get to Know Willis Lease Finance Better
Willis Lease Finance Corp with its subsidiaries is a lessor and servicer of commercial aircraft and aircraft engines. The company has two reportable business segments namely Leasing and Related Operations which involves acquiring and leasing, pursuant to operating leases, commercial aircraft, aircraft engines and other aircraft equipment and the selective purchase and resale of commercial aircraft engines and other aircraft equipment and other related businesses and Spare Parts Sales segment involves the purchase and resale of after-market engine parts, whole engines, engine modules and portable aircraft components. The company generates the majority of its revenue from leasing and related operations.
Willis Lease Finance: Financial Performance Dissected
Revenue Growth: Willis Lease Finance’s revenue growth over a period of 3 months has been noteworthy. As of 30 September, 2024, the company achieved a revenue growth rate of approximately 38.28%. This indicates a substantial increase in the company’s top-line earnings. When compared to others in the Industrials sector, the company excelled with a growth rate higher than the average among peers.
Navigating Financial Profits:
-
Gross Margin: With a high gross margin of 73.39%, the company demonstrates effective cost control and strong profitability relative to its peers.
-
Earnings per Share (EPS): Willis Lease Finance’s EPS is significantly higher than the industry average. The company demonstrates a robust bottom-line performance with a current EPS of 3.51.
Debt Management: The company faces challenges in debt management with a debt-to-equity ratio higher than the industry average. With a ratio of 3.84, caution is advised due to increased financial risk.
Assessing Valuation Metrics:
-
Price to Earnings (P/E) Ratio: With a lower-than-average P/E ratio of 13.55, the stock indicates an attractive valuation, potentially presenting a buying opportunity.
-
Price to Sales (P/S) Ratio: With a higher-than-average P/S ratio of 2.41, Willis Lease Finance’s stock is perceived as being overvalued in the market, particularly in relation to sales performance.
-
EV/EBITDA Analysis (Enterprise Value to its Earnings Before Interest, Taxes, Depreciation & Amortization): With an EV/EBITDA ratio lower than industry averages at 9.78, Willis Lease Finance could be considered undervalued.
Market Capitalization Perspectives: The company’s market capitalization falls below industry averages, signaling a relatively smaller size compared to peers. This positioning may be influenced by factors such as perceived growth potential or operational scale.
Now trade stocks online commission free with Charles Schwab, a trusted and complete investment firm.
Navigating the Impact of Insider Transactions on Investments
It’s important to note that insider transactions alone should not dictate investment decisions, but they can provide valuable insights.
In the realm of legality, an “insider” is defined as any officer, director, or beneficial owner holding more than ten percent of a company’s equity securities under Section 12 of the Securities Exchange Act of 1934. This includes executives in the c-suite and major hedge funds. These insiders are required to disclose their transactions through a Form 4 filing, to be submitted within two business days of the transaction.
Notably, when a company insider makes a new purchase, it is considered an indicator of their positive expectations for the stock.
Conversely, insider sells may not necessarily signal a bearish stance on the stock and can be motivated by various factors.
A Deep Dive into Insider Transaction Codes
When analyzing transactions, investors tend to focus on those in the open market, detailed in Table I of the Form 4 filing. A P in Box 3 denotes a purchase,while S signifies a sale. Transaction code C signals the conversion of an option, and transaction code A denotes a grant, award, or other acquisition of securities from the company.
Check Out The Full List Of Willis Lease Finance’s Insider Trades.
Insider Buying Alert: Profit from C-Suite Moves
Benzinga Edge reveals every insider trade in real-time. Don’t miss the next big stock move driven by insider confidence. Unlock this ultimate sentiment indicator now. Click here for access.
This article was generated by Benzinga’s automated content engine and reviewed by an editor.
Market News and Data brought to you by Benzinga APIs
© 2024 Benzinga.com. Benzinga does not provide investment advice. All rights reserved.
P/E Ratio Insights for Constellation Energy
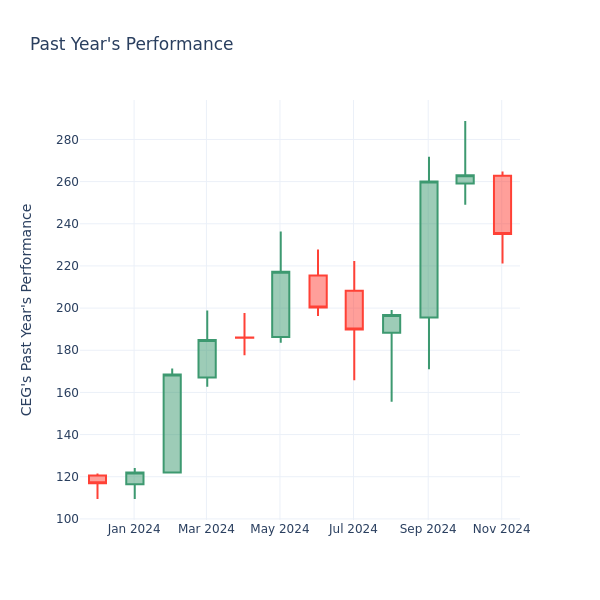
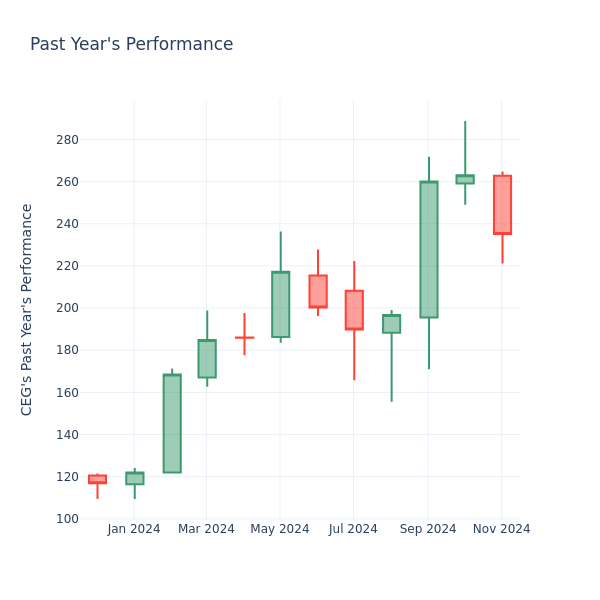
In the current market session, Constellation Energy Inc. CEG share price is at $235.82, after a 0.53% spike. Moreover, over the past month, the stock fell by 11.63%, but in the past year, went up by 89.81%. Shareholders might be interested in knowing whether the stock is overvalued, even if the company is performing up to par in the current session.
Evaluating Constellation Energy P/E in Comparison to Its Peers
The P/E ratio is used by long-term shareholders to assess the company’s market performance against aggregate market data, historical earnings, and the industry at large. A lower P/E could indicate that shareholders do not expect the stock to perform better in the future or it could mean that the company is undervalued.
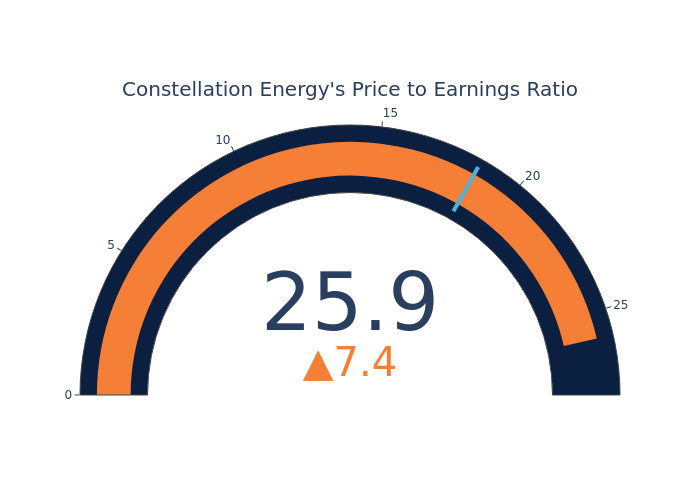
Compared to the aggregate P/E ratio of 18.53 in the Electric Utilities industry, Constellation Energy Inc. has a higher P/E ratio of 25.86. Shareholders might be inclined to think that Constellation Energy Inc. might perform better than its industry group. It’s also possible that the stock is overvalued.
In conclusion, the price-to-earnings ratio is a useful metric for analyzing a company’s market performance, but it has its limitations. While a lower P/E can indicate that a company is undervalued, it can also suggest that shareholders do not expect future growth. Additionally, the P/E ratio should not be used in isolation, as other factors such as industry trends and business cycles can also impact a company’s stock price. Therefore, investors should use the P/E ratio in conjunction with other financial metrics and qualitative analysis to make informed investment decisions.
Market News and Data brought to you by Benzinga APIs
© 2024 Benzinga.com. Benzinga does not provide investment advice. All rights reserved.
Sysco Director Sold $216K In Company Stock
Disclosed on November 19, Sheila Talton, Director at Sysco SYY, executed a substantial insider sell as per the latest SEC filing.
What Happened: Talton’s recent move involves selling 2,900 shares of Sysco. This information is documented in a Form 4 filing with the U.S. Securities and Exchange Commission on Tuesday. The total value is $216,427.
The latest market snapshot at Wednesday morning reveals Sysco shares down by 0.56%, trading at $73.98.
About Sysco
Sysco is the largest US foodservice distributor with 17% share of the highly fragmented $370 billion domestic market. It distributes roughly 500,000 food and nonfood products to restaurants (62% of fiscal 2024 revenue), education and government buildings (7%), travel and leisure (6%), healthcare facilities (7%), and other locations (18%) where individuals consume away-from-home meals. In fiscal 2024, 70% of the firm’s revenue was derived from its US foodservice operations, while its international (18%), quick-service logistics (10%), and other (2%) segments contributed the rest.
Understanding the Numbers: Sysco’s Finances
Revenue Growth: Sysco displayed positive results in 3 months. As of 30 September, 2024, the company achieved a solid revenue growth rate of approximately 4.4%. This indicates a notable increase in the company’s top-line earnings. As compared to its peers, the company achieved a growth rate higher than the average among peers in Consumer Staples sector.
Exploring Profitability:
-
Gross Margin: The company excels with a remarkable gross margin of 18.32%, indicating superior cost efficiency and profitability compared to its industry peers.
-
Earnings per Share (EPS): Sysco’s EPS is significantly higher than the industry average. The company demonstrates a robust bottom-line performance with a current EPS of 1.0.
Debt Management: With a high debt-to-equity ratio of 6.08, Sysco faces challenges in effectively managing its debt levels, indicating potential financial strain.
Valuation Metrics:
-
Price to Earnings (P/E) Ratio: The P/E ratio of 19.13 is lower than the industry average, implying a discounted valuation for Sysco’s stock.
-
Price to Sales (P/S) Ratio: With a higher-than-average P/S ratio of 0.47, Sysco’s stock is perceived as being overvalued in the market, particularly in relation to sales performance.
-
EV/EBITDA Analysis (Enterprise Value to its Earnings Before Interest, Taxes, Depreciation & Amortization): The company’s EV/EBITDA ratio 11.7 is above the industry average, suggesting that the market values the company more highly for each unit of EBITDA. This could be attributed to factors such as strong growth prospects or superior operational efficiency.
Market Capitalization: Positioned above industry average, the company’s market capitalization underscores its superiority in size, indicative of a strong market presence.
Now trade stocks online commission free with Charles Schwab, a trusted and complete investment firm.
Why Pay Attention to Insider Transactions
Investors should view insider transactions as part of a multifaceted analysis and not rely solely on them for decision-making.
Within the legal framework, an “insider” is defined as any officer, director, or beneficial owner holding more than ten percent of a company’s equity securities as per Section 12 of the Securities Exchange Act of 1934. This includes executives in the c-suite and major hedge funds. These insiders are mandated to disclose their transactions through a Form 4 filing, to be submitted within two business days of the transaction.
The initiation of a new purchase by a company insider serves as a strong indication that they expect the stock to rise.
However, insider sells may not always signal a bearish view and can be influenced by various factors.
A Deep Dive into Insider Transaction Codes
For investors, a primary focus lies on transactions occurring in the open market, as indicated in Table I of the Form 4 filing. A P in Box 3 denotes a purchase, while S signifies a sale. Transaction code C signals the conversion of an option, and transaction code A denotes a grant, award, or other acquisition of securities from the company.
Check Out The Full List Of Sysco’s Insider Trades.
Insider Buying Alert: Profit from C-Suite Moves
Benzinga Edge reveals every insider trade in real-time. Don’t miss the next big stock move driven by insider confidence. Unlock this ultimate sentiment indicator now. Click here for access.
This article was generated by Benzinga’s automated content engine and reviewed by an editor.
Market News and Data brought to you by Benzinga APIs
© 2024 Benzinga.com. Benzinga does not provide investment advice. All rights reserved.

