Earnings Outlook For UGI
UGI UGI is gearing up to announce its quarterly earnings on Thursday, 2024-11-21. Here’s a quick overview of what investors should know before the release.
Analysts are estimating that UGI will report an earnings per share (EPS) of $-0.29.
Investors in UGI are eagerly awaiting the company’s announcement, hoping for news of surpassing estimates and positive guidance for the next quarter.
It’s worth noting for new investors that stock prices can be heavily influenced by future projections rather than just past performance.
Historical Earnings Performance
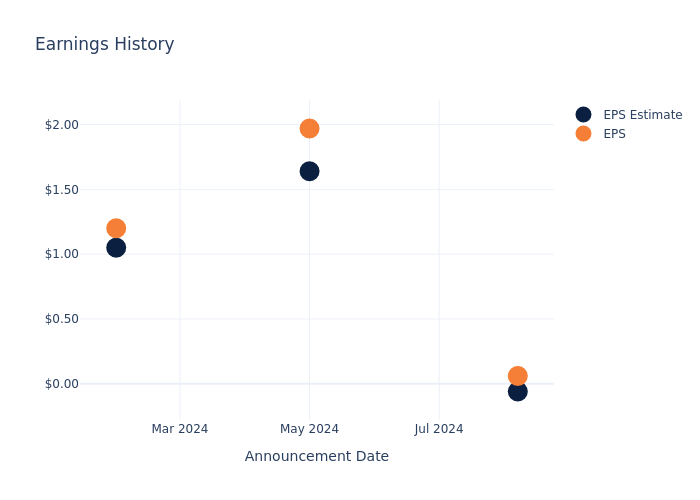
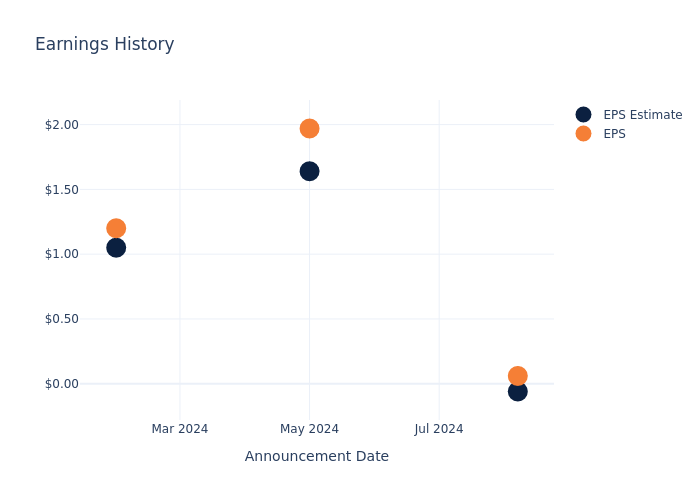
During the last quarter, the company reported an EPS beat by $0.12, leading to a 3.86% drop in the share price on the subsequent day.
Here’s a look at UGI’s past performance and the resulting price change:
| Quarter | Q3 2024 | Q2 2024 | Q1 2024 | Q4 2023 |
|---|---|---|---|---|
| EPS Estimate | -0.06 | 1.64 | 1.05 | -0.06 |
| EPS Actual | 0.06 | 1.97 | 1.20 | 0.03 |
| Price Change % | -4.0% | -6.0% | 13.0% | 4.0% |
Performance of UGI Shares
Shares of UGI were trading at $24.37 as of November 19. Over the last 52-week period, shares are up 10.62%. Given that these returns are generally positive, long-term shareholders are likely bullish going into this earnings release.
Analyst Insights on UGI
Understanding market sentiments and expectations within the industry is crucial for investors. This analysis delves into the latest insights on UGI.
A total of 1 analyst ratings have been received for UGI, with the consensus rating being Neutral. The average one-year price target stands at $27.0, suggesting a potential 10.79% upside.
Analyzing Ratings Among Peers
In this comparison, we explore the analyst ratings and average 1-year price targets of New Jersey Resources, National Fuel Gas and Southwest Gas Hldgs, three prominent industry players, offering insights into their relative performance expectations and market positioning.
- New Jersey Resources received a Neutral consensus from analysts, with an average 1-year price target of $49.0, implying a potential 101.07% upside.
- The prevailing sentiment among analysts is an Neutral trajectory for National Fuel Gas, with an average 1-year price target of $63.0, implying a potential 158.51% upside.
- Southwest Gas Hldgs is maintaining an Neutral status according to analysts, with an average 1-year price target of $78.0, indicating a potential 220.07% upside.
Overview of Peer Analysis
In the peer analysis summary, key metrics for New Jersey Resources, National Fuel Gas and Southwest Gas Hldgs are highlighted, providing an understanding of their respective standings within the industry and offering insights into their market positions and comparative performance.
| Company | Consensus | Revenue Growth | Gross Profit | Return on Equity |
|---|---|---|---|---|
| UGI | Neutral | -16.82% | $741M | -1.03% |
| New Jersey Resources | Neutral | 4.38% | $55.19M | -0.54% |
| National Fuel Gas | Neutral | -10.87% | $170.46M | -5.62% |
| Southwest Gas Hldgs | Neutral | -7.72% | $191.13M | 0.01% |
Key Takeaway:
UGI is positioned in the middle among its peers for revenue growth, with a negative growth rate. It ranks at the bottom for gross profit, indicating lower profitability compared to others. In terms of return on equity, UGI is also at the bottom, showing a negative percentage. Overall, UGI’s performance is relatively weaker compared to its peers in these key financial metrics.
About UGI
UGI Corp is an American holding company that, through its subsidiaries, is involved in the transport and marketing of energy and related services. Its segments include AmeriGas Propane, UGI International, Midstream & Marketing and UGI Utilities. The AmeriGas Propane segment consists of the propane distribution business. The UGI International segment consists of LPG distribution businesses. The Midstream & Marketing segment consists of energy-related businesses. The UGI Utilities segment consists of the regulated natural gas and electric distribution. The company derives a majority of its revenue from the UGI International segment.
Unraveling the Financial Story of UGI
Market Capitalization Analysis: Above industry benchmarks, the company’s market capitalization emphasizes a noteworthy size, indicative of a strong market presence.
Revenue Growth: UGI’s revenue growth over a period of 3 months has faced challenges. As of 30 June, 2024, the company experienced a revenue decline of approximately -16.82%. This indicates a decrease in the company’s top-line earnings. As compared to its peers, the revenue growth lags behind its industry peers. The company achieved a growth rate lower than the average among peers in Utilities sector.
Net Margin: The company’s net margin is below industry benchmarks, signaling potential difficulties in achieving strong profitability. With a net margin of -3.48%, the company may need to address challenges in effective cost control.
Return on Equity (ROE): UGI’s ROE falls below industry averages, indicating challenges in efficiently using equity capital. With an ROE of -1.03%, the company may face hurdles in generating optimal returns for shareholders.
Return on Assets (ROA): UGI’s ROA falls below industry averages, indicating challenges in efficiently utilizing assets. With an ROA of -0.31%, the company may face hurdles in generating optimal returns from its assets.
Debt Management: UGI’s debt-to-equity ratio is notably higher than the industry average. With a ratio of 1.48, the company relies more heavily on borrowed funds, indicating a higher level of financial risk.
To track all earnings releases for UGI visit their earnings calendar on our site.
This article was generated by Benzinga’s automated content engine and reviewed by an editor.
© 2024 Benzinga.com. Benzinga does not provide investment advice. All rights reserved.
P/E Ratio Insights for Palantir Technologies
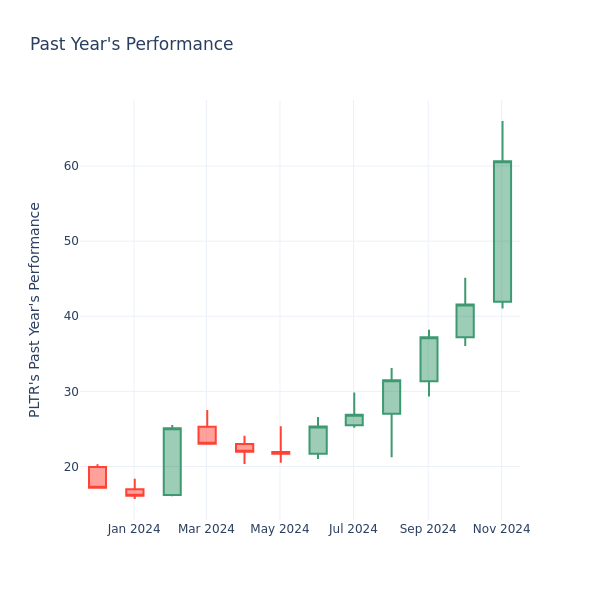
In the current market session, Palantir Technologies Inc. PLTR stock price is at $60.91, after a 3.29% drop. However, over the past month, the company’s stock increased by 42.41%, and in the past year, by 215.90%. Shareholders might be interested in knowing whether the stock is overvalued, even if the company is not performing up to par in the current session.
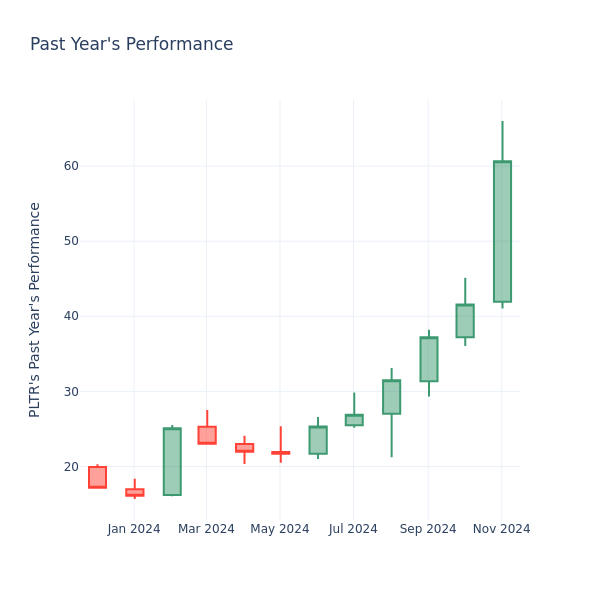
Palantir Technologies P/E Compared to Competitors
The P/E ratio is used by long-term shareholders to assess the company’s market performance against aggregate market data, historical earnings, and the industry at large. A lower P/E could indicate that shareholders do not expect the stock to perform better in the future or it could mean that the company is undervalued.
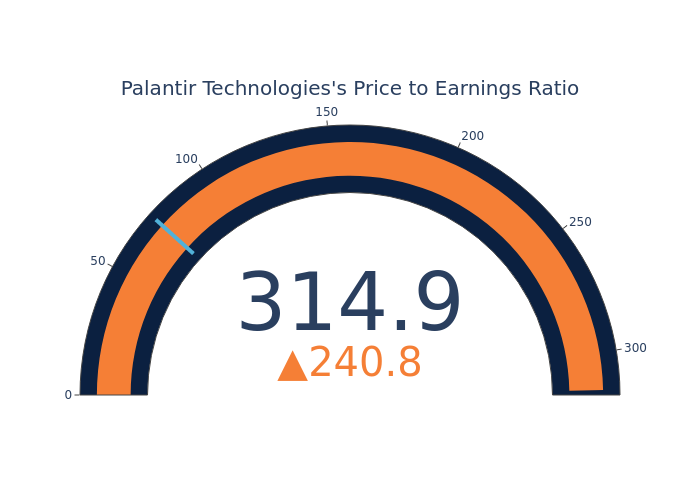
Palantir Technologies has a better P/E ratio of 314.9 than the aggregate P/E ratio of 74.07 of the Software industry. Ideally, one might believe that Palantir Technologies Inc. might perform better in the future than it’s industry group, but it’s probable that the stock is overvalued.
In conclusion, the price-to-earnings ratio is a useful metric for analyzing a company’s market performance, but it has its limitations. While a lower P/E can indicate that a company is undervalued, it can also suggest that shareholders do not expect future growth. Additionally, the P/E ratio should not be used in isolation, as other factors such as industry trends and business cycles can also impact a company’s stock price. Therefore, investors should use the P/E ratio in conjunction with other financial metrics and qualitative analysis to make informed investment decisions.
Market News and Data brought to you by Benzinga APIs
© 2024 Benzinga.com. Benzinga does not provide investment advice. All rights reserved.
Exploring Logility Supply Chain's Earnings Expectations
Logility Supply Chain LGTY is set to give its latest quarterly earnings report on Thursday, 2024-11-21. Here’s what investors need to know before the announcement.
Analysts estimate that Logility Supply Chain will report an earnings per share (EPS) of $0.09.
Logility Supply Chain bulls will hope to hear the company announce they’ve not only beaten that estimate, but also to provide positive guidance, or forecasted growth, for the next quarter.
New investors should note that it is sometimes not an earnings beat or miss that most affects the price of a stock, but the guidance (or forecast).
Past Earnings Performance
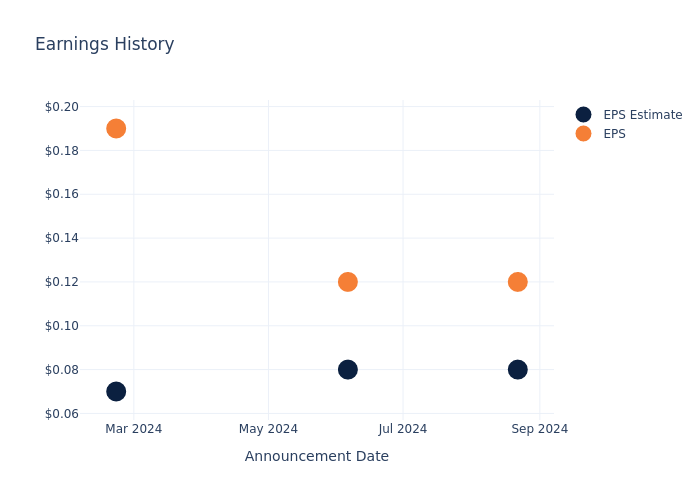
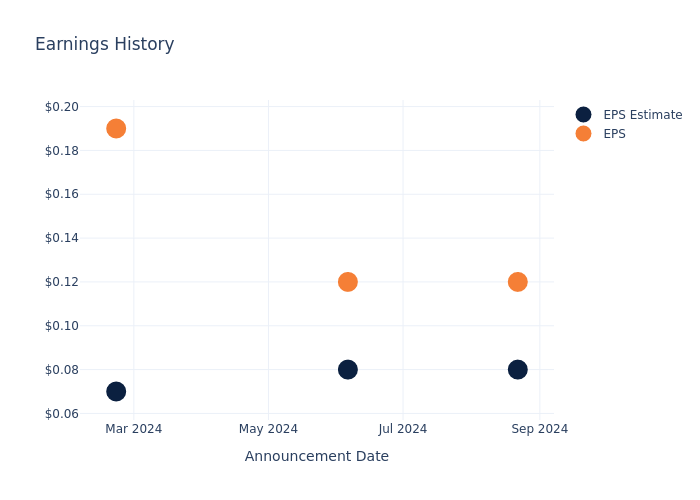
Last quarter the company beat EPS by $0.04, which was followed by a 7.8% increase in the share price the next day.
Here’s a look at Logility Supply Chain’s past performance and the resulting price change:
| Quarter | Q1 2025 | Q4 2024 | Q3 2024 | Q2 2024 |
|---|---|---|---|---|
| EPS Estimate | 0.08 | 0.08 | 0.07 | 0.09 |
| EPS Actual | 0.12 | 0.12 | 0.19 | 0.08 |
| Price Change % | 8.0% | -11.0% | 11.0% | -9.0% |
Stock Performance
Shares of Logility Supply Chain were trading at $11.06 as of November 19. Over the last 52-week period, shares are up 13.4%. Given that these returns are generally positive, long-term shareholders are likely bullish going into this earnings release.
To track all earnings releases for Logility Supply Chain visit their earnings calendar on our site.
This article was generated by Benzinga’s automated content engine and reviewed by an editor.
Market News and Data brought to you by Benzinga APIs
© 2024 Benzinga.com. Benzinga does not provide investment advice. All rights reserved.
Spotlight on Reddit: Analyzing the Surge in Options Activity
Financial giants have made a conspicuous bullish move on Reddit. Our analysis of options history for Reddit RDDT revealed 16 unusual trades.
Delving into the details, we found 43% of traders were bullish, while 37% showed bearish tendencies. Out of all the trades we spotted, 2 were puts, with a value of $55,700, and 14 were calls, valued at $748,243.
What’s The Price Target?
Based on the trading activity, it appears that the significant investors are aiming for a price territory stretching from $60.0 to $170.0 for Reddit over the recent three months.
Analyzing Volume & Open Interest
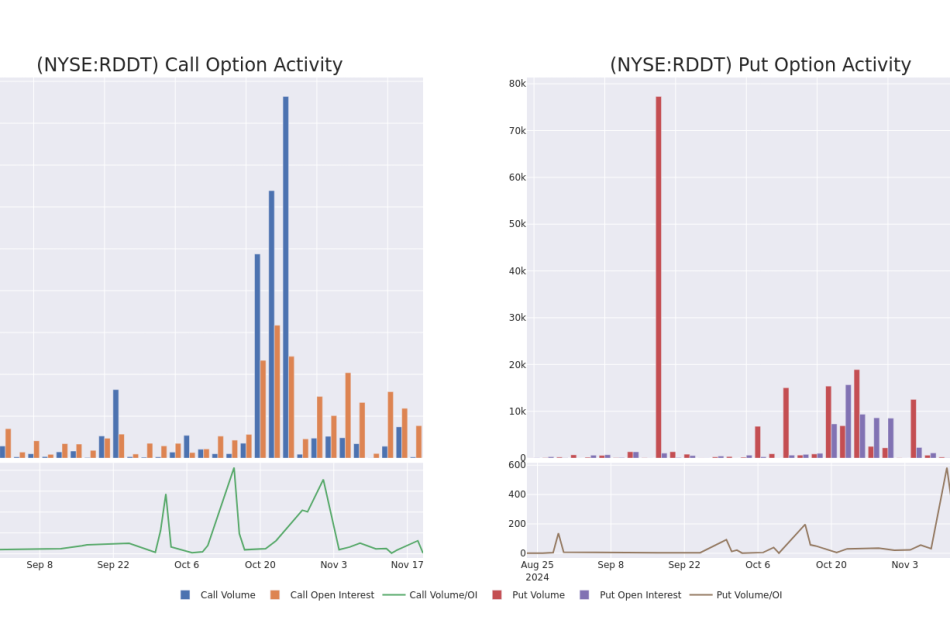
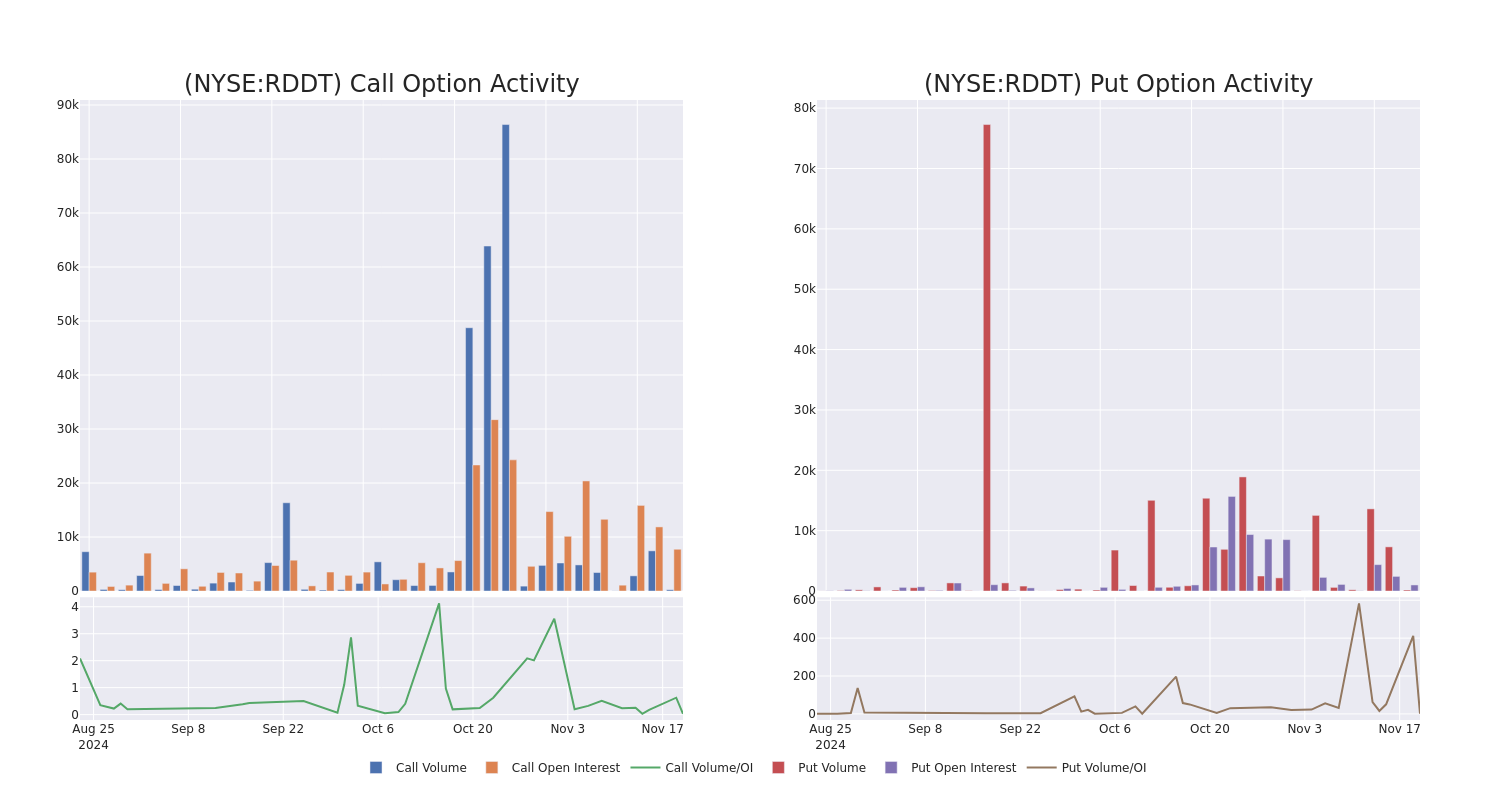
Assessing the volume and open interest is a strategic step in options trading. These metrics shed light on the liquidity and investor interest in Reddit’s options at specified strike prices. The forthcoming data visualizes the fluctuation in volume and open interest for both calls and puts, linked to Reddit’s substantial trades, within a strike price spectrum from $60.0 to $170.0 over the preceding 30 days.
Reddit Option Volume And Open Interest Over Last 30 Days
Noteworthy Options Activity:
| Symbol | PUT/CALL | Trade Type | Sentiment | Exp. Date | Ask | Bid | Price | Strike Price | Total Trade Price | Open Interest | Volume |
|---|---|---|---|---|---|---|---|---|---|---|---|
| RDDT | CALL | SWEEP | BULLISH | 04/17/25 | $23.6 | $21.15 | $23.0 | $135.00 | $230.0K | 334 | 100 |
| RDDT | CALL | SWEEP | BULLISH | 12/20/24 | $14.35 | $14.3 | $14.33 | $130.00 | $113.2K | 1.6K | 0 |
| RDDT | CALL | TRADE | BEARISH | 01/17/25 | $54.4 | $53.3 | $53.3 | $80.00 | $53.3K | 2.6K | 20 |
| RDDT | CALL | TRADE | BULLISH | 01/16/26 | $59.5 | $58.45 | $59.5 | $95.00 | $47.6K | 208 | 0 |
| RDDT | CALL | TRADE | BULLISH | 01/16/26 | $79.5 | $79.5 | $79.5 | $60.00 | $39.7K | 602 | 3 |
About Reddit
Reddit Inc is engaged in providing internet content. The company provides online services that include gaming, sports, business, crypto, television and others.
After a thorough review of the options trading surrounding Reddit, we move to examine the company in more detail. This includes an assessment of its current market status and performance.
Current Position of Reddit
- With a volume of 2,445,583, the price of RDDT is down -2.3% at $134.0.
- RSI indicators hint that the underlying stock may be overbought.
- Next earnings are expected to be released in 125 days.
Professional Analyst Ratings for Reddit
5 market experts have recently issued ratings for this stock, with a consensus target price of $106.0.
Turn $1000 into $1270 in just 20 days?
20-year pro options trader reveals his one-line chart technique that shows when to buy and sell. Copy his trades, which have had averaged a 27% profit every 20 days. Click here for access.
* Maintaining their stance, an analyst from Needham continues to hold a Buy rating for Reddit, targeting a price of $120.
* An analyst from Loop Capital persists with their Buy rating on Reddit, maintaining a target price of $120.
* An analyst from Roth MKM persists with their Buy rating on Reddit, maintaining a target price of $116.
* An analyst from Roth MKM has decided to maintain their Buy rating on Reddit, which currently sits at a price target of $89.
* An analyst from Bernstein persists with their Underperform rating on Reddit, maintaining a target price of $85.
Options are a riskier asset compared to just trading the stock, but they have higher profit potential. Serious options traders manage this risk by educating themselves daily, scaling in and out of trades, following more than one indicator, and following the markets closely.
If you want to stay updated on the latest options trades for Reddit, Benzinga Pro gives you real-time options trades alerts.
Market News and Data brought to you by Benzinga APIs
© 2024 Benzinga.com. Benzinga does not provide investment advice. All rights reserved.
Global-E Soars: Q3 Sales Surge 32%, FY24 Outlook Raised Amid GMV Boom
Global-E Online Ltd. GLBE shares are trading higher after the company reported third-quarter results and raised its FY24 outlook.
Sales grew 32% year over year to $176 million, beating the analyst consensus estimate of $169.16 million.
Gross Merchandise Value (GMV) rose 35% Y/Y to $1.13 billion in the quarter. The company reported $82.6 million in service fees and $93.4 million in fulfillment services revenue in the quarter.
Non-GAAP gross profit increased to $82.3 million (+39% Y/Y), and non-GAAP gross margin expanded 240 basis points Y/Y to 46.8%.
Adjusted EBITDA rose to $31.1 million from $22.1 million a year ago. The company’s operating loss narrowed to $21.0 million from $35.6 million.
Loss per share was $0.13, beating the consensus loss of $0.15.
Outlook: For the fourth quarter, Global-e Online projects GMV of $1.615 billion – $1.685 billion and revenue of $243 million and $255 million vs. $246.27 million estimate.
The company raised its FY24 revenue guidance to $732.9 million – $744.9 million (from $710 million – $750 million), vs. the consensus of $730.72 million.
Founder and CEO Amir Schlachet said, “We report today the results of another very strong quarter, with growth of GMV accelerating to 35% year over year and many new merchants going live ahead of the holiday season, including the iconic luxury department store Harrods.”
“Given the successful merchant launches in the recent months, combined with our new bookings for this year which are at an all-time high, we believe that this strong growth momentum will continue.”
Investors can gain exposure to the stock via Amplify ETF Trust Amplify BlueStar Israel Technology ETF ITEQ and The Alger ETF Trust Alger AI Enablers & Adopters ETF ALAI.
Price Action: GLBE shares are up 12.9% at $48.28 at the last check Wednesday.
Read Next:
Market News and Data brought to you by Benzinga APIs
© 2024 Benzinga.com. Benzinga does not provide investment advice. All rights reserved.
What's Going On With XPeng Stock Today?
XPeng Inc. XPEV shares are trading slightly higher on Wednesday, following mixed third-quarter results from its rival, NIO Inc. NIO.
NIO’s fiscal third quarter revenue totaled 18.67 billion yuan ($2.66 billion), down 2.1% year-over-year but up 7.0% from the previous quarter, missing the consensus estimate of $2.70 billion. The company posted an adjusted loss per share of 2.14 yuan (31 cents), a slight improvement from a 2.28 yuan loss in the same period last year.
China’s $376 billion electric vehicle (EV) market continues to attract new entrants, including companies outside the traditional automotive sector, like makers of vacuum cleaners and hair dryers, according to a report from the South China Morning Post.
Also Read: Sony Eyes Japan’s Kadokawa to Strengthen Gaming and Anime Dominance
Despite optimism, the domestic EV market, the world’s largest, is projected to stagnate over the next two years in terms of revenue growth, the report read.
In contrast, XPeng is projecting robust fourth-quarter vehicle deliveries between 87,000 and 91,000, reflecting year-on-year growth of 44.6% to 51.3%. The company also expects fourth-quarter revenue to range from 15.3 billion to 16.2 billion yuan, a year-on-year increase of 17.2% to 24.1%, surpassing the consensus estimate of 14.77 billion yuan.
XPeng’s flying car subsidiary, Xpeng Aeroht, made significant progress at the 15th China International Aviation and Aerospace Exhibition, securing 2,008 pre-orders for its modular flying car, the Land Aircraft Carrier.
Despite these developments, XPeng’s stock has dropped over 30% in the past year. Investors seeking exposure to XPeng can access the stock through the SPDR S&P Kensho Smart Mobility ETF HAIL.
Price Action: XPEV shares are trading higher by 2.04% to $12.78 at last check Wednesday.
Photo via Shutterstock
Also Read:
Market News and Data brought to you by Benzinga APIs
© 2024 Benzinga.com. Benzinga does not provide investment advice. All rights reserved.
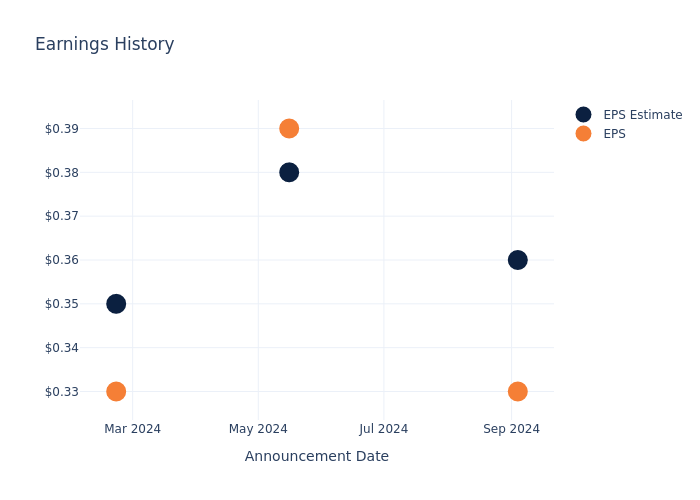
What to Expect from Copart's Earnings
Copart CPRT is preparing to release its quarterly earnings on Thursday, 2024-11-21. Here’s a brief overview of what investors should keep in mind before the announcement.
Analysts expect Copart to report an earnings per share (EPS) of $0.37.
Anticipation surrounds Copart’s announcement, with investors hoping to hear about both surpassing estimates and receiving positive guidance for the next quarter.
New investors should understand that while earnings performance is important, market reactions are often driven by guidance.
Earnings History Snapshot
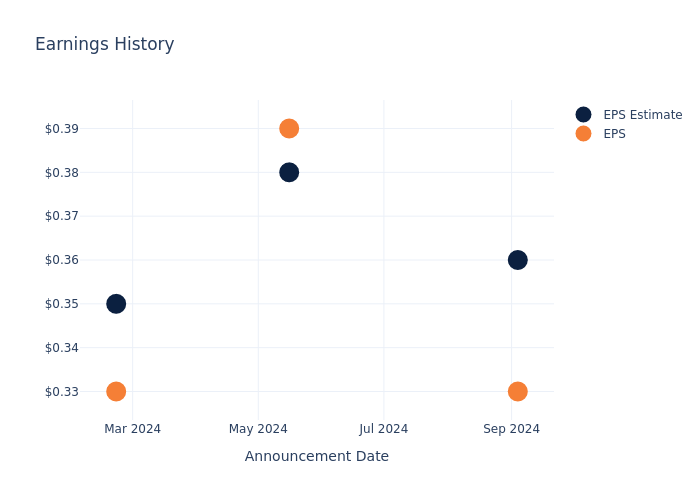
Last quarter the company missed EPS by $0.03, which was followed by a 6.67% drop in the share price the next day.
Here’s a look at Copart’s past performance and the resulting price change:
| Quarter | Q4 2024 | Q3 2024 | Q2 2024 | Q1 2024 |
|---|---|---|---|---|
| EPS Estimate | 0.36 | 0.38 | 0.35 | 0.32 |
| EPS Actual | 0.33 | 0.39 | 0.33 | 0.34 |
| Price Change % | -7.000000000000001% | -0.0% | 4.0% | 2.0% |
Performance of Copart Shares
Shares of Copart were trading at $56.52 as of November 19. Over the last 52-week period, shares are up 11.42%. Given that these returns are generally positive, long-term shareholders should be satisfied going into this earnings release.
Insights Shared by Analysts on Copart
For investors, grasping market sentiments and expectations in the industry is vital. This analysis explores the latest insights regarding Copart.
The consensus rating for Copart is Neutral, derived from 2 analyst ratings. An average one-year price target of $58.0 implies a potential 2.62% upside.
Analyzing Analyst Ratings Among Peers
The below comparison of the analyst ratings and average 1-year price targets of Cintas, RB Global and ACV Auctions, three prominent players in the industry, gives insights for their relative performance expectations and market positioning.
- As per analysts’ assessments, Cintas is favoring an Neutral trajectory, with an average 1-year price target of $211.45, suggesting a potential 274.12% upside.
- Analysts currently favor an Outperform trajectory for RB Global, with an average 1-year price target of $102.3, suggesting a potential 81.0% upside.
- Analysts currently favor an Outperform trajectory for ACV Auctions, with an average 1-year price target of $22.83, suggesting a potential 59.61% downside.
Snapshot: Peer Analysis
Within the peer analysis summary, vital metrics for Cintas, RB Global and ACV Auctions are presented, shedding light on their respective standings within the industry and offering valuable insights into their market positions and comparative performance.
| Company | Consensus | Revenue Growth | Gross Profit | Return on Equity |
|---|---|---|---|---|
| Copart | Neutral | 7.16% | $453.58M | 4.39% |
| Cintas | Neutral | 6.80% | $1.25B | 10.80% |
| RB Global | Outperform | -3.73% | $448.60M | 1.29% |
| ACV Auctions | Outperform | 43.96% | $90.09M | -3.51% |
Key Takeaway:
Copart ranks highest in revenue growth among its peers. It also leads in gross profit margin. However, its return on equity is below average compared to the group.
Unveiling the Story Behind Copart
Based in Dallas, Copart operates an online salvage vehicle auction with operations in 11 countries across North America, Europe, and the Middle East, facilitating over 3.5 million transactions annually. The company utilizes its virtual bidding platform, VB3, to connect vehicle sellers with over 750,000 registered buyers around the world. Buyers primarily consist of vehicle dismantlers, rebuilders, individuals and used vehicle retailers. About 80% of Copart’s vehicle volume is supplied by auto insurance companies holding vehicles deemed a total loss. Copart also offers services such as vehicle transportation, storage, title transfer, and salvage value estimation. The company primarily operates on a consignment basis and collects fees based on the vehicle’s final selling price.
Financial Insights: Copart
Market Capitalization: Exceeding industry standards, the company’s market capitalization places it above industry average in size relative to peers. This emphasizes its significant scale and robust market position.
Revenue Growth: Copart displayed positive results in 3 months. As of 31 July, 2024, the company achieved a solid revenue growth rate of approximately 7.16%. This indicates a notable increase in the company’s top-line earnings. In comparison to its industry peers, the company trails behind with a growth rate lower than the average among peers in the Industrials sector.
Net Margin: Copart’s net margin surpasses industry standards, highlighting the company’s exceptional financial performance. With an impressive 30.17% net margin, the company effectively manages costs and achieves strong profitability.
Return on Equity (ROE): Copart’s ROE is below industry averages, indicating potential challenges in efficiently utilizing equity capital. With an ROE of 4.39%, the company may face hurdles in achieving optimal financial returns.
Return on Assets (ROA): Copart’s financial strength is reflected in its exceptional ROA, which exceeds industry averages. With a remarkable ROA of 3.92%, the company showcases efficient use of assets and strong financial health.
Debt Management: Copart’s debt-to-equity ratio is below industry norms, indicating a sound financial structure with a ratio of 0.02.
To track all earnings releases for Copart visit their earnings calendar on our site.
This article was generated by Benzinga’s automated content engine and reviewed by an editor.
© 2024 Benzinga.com. Benzinga does not provide investment advice. All rights reserved.
WillScot Holdings Recent Insider Activity
On November 19, a recent SEC filing unveiled that Sally Shanks, Chief Accounting Officer at WillScot Holdings WSC made an insider sell.
What Happened: According to a Form 4 filing with the U.S. Securities and Exchange Commission on Tuesday, Shanks sold 14,059 shares of WillScot Holdings. The total transaction value is $487,681.
WillScot Holdings‘s shares are actively trading at $37.07, experiencing a up of 5.49% during Wednesday’s morning session.
Discovering WillScot Holdings: A Closer Look
WillScot Holdings Corp designs, delivers, and services onsite, on-demand space solutions for clients. The company offers turnkey solutions in construction, education, manufacturing, retail, healthcare, and entertainment sectors. The products of the company includes modular office complexes, mobile offices, portable storage containers, and others.
Key Indicators: WillScot Holdings’s Financial Health
Revenue Challenges: WillScot Holdings’s revenue growth over 3 months faced difficulties. As of 30 September, 2024, the company experienced a decline of approximately -0.56%. This indicates a decrease in top-line earnings. As compared to competitors, the company encountered difficulties, with a growth rate lower than the average among peers in the Industrials sector.
Analyzing Profitability Metrics:
-
Gross Margin: With a high gross margin of 53.45%, the company demonstrates effective cost control and strong profitability relative to its peers.
-
Earnings per Share (EPS): WillScot Holdings’s EPS lags behind the industry average, indicating concerns and potential challenges with a current EPS of -0.37.
Debt Management: WillScot Holdings’s debt-to-equity ratio stands notably higher than the industry average, reaching 3.69. This indicates a heavier reliance on borrowed funds, raising concerns about financial leverage.
Financial Valuation Breakdown:
-
Price to Earnings (P/E) Ratio: WillScot Holdings’s current Price to Earnings (P/E) ratio of 292.83 is higher than the industry average, indicating that the stock may be overvalued according to market sentiment.
-
Price to Sales (P/S) Ratio: With a relatively high Price to Sales ratio of 2.78 as compared to the industry average, the stock might be considered overvalued based on sales performance.
-
EV/EBITDA Analysis (Enterprise Value to its Earnings Before Interest, Taxes, Depreciation & Amortization): At 16.0, WillScot Holdings’s EV/EBITDA ratio reflects a below-par valuation compared to industry averages signalling undervaluation
Market Capitalization Analysis: Reflecting a smaller scale, the company’s market capitalization is positioned below industry averages. This could be attributed to factors such as growth expectations or operational capacity.
Now trade stocks online commission free with Charles Schwab, a trusted and complete investment firm.
The Importance of Insider Transactions
Insider transactions serve as a piece of the puzzle in investment decisions, rather than the entire picture.
From a legal standpoint, the term “insider” pertains to any officer, director, or beneficial owner holding more than ten percent of a company’s equity securities as outlined in Section 12 of the Securities Exchange Act of 1934. This encompasses executives in the c-suite and significant hedge funds. These insiders are mandated to inform the public of their transactions through a Form 4 filing, to be submitted within two business days of the transaction.
A company insider’s new purchase is a indicator of their positive anticipation for a rise in the stock.
While insider sells may not necessarily reflect a bearish view and can be motivated by various factors.
The Insider’s Guide to Important Transaction Codes
Navigating through the landscape of transactions, investors often prioritize those unfolding in the open market, precisely detailed in Table I of the Form 4 filing. A P in Box 3 denotes a purchase, while S signifies a sale. Transaction code C signals the conversion of an option, and transaction code A denotes a grant, award, or other acquisition of securities from the company.
Check Out The Full List Of WillScot Holdings’s Insider Trades.
Insider Buying Alert: Profit from C-Suite Moves
Benzinga Edge reveals every insider trade in real-time. Don’t miss the next big stock move driven by insider confidence. Unlock this ultimate sentiment indicator now. Click here for access.
This article was generated by Benzinga’s automated content engine and reviewed by an editor.
Market News and Data brought to you by Benzinga APIs
© 2024 Benzinga.com. Benzinga does not provide investment advice. All rights reserved.

