Fannie Mae Announces Changes to Appraisal Alternatives Requirements
WASHINGTON, Oct. 28, 2024 /PRNewswire/ — Fannie Mae FNMA today announced changes to the eligibility requirements for Value Acceptance (previously known as appraisal waivers) and Value Acceptance + Property Data (also known as inspection-based appraisal waivers), two key components of the company’s valuation modernization options. The changes are part of Fannie Mae’s ongoing efforts to offer a balance of traditional appraisals and appraisal alternatives to confirm a property’s value in order to meet the needs of the market.
Beginning in Q1 2025, for purchase loans for primary residences and second homes, the eligible loan-to-value (LTV) ratios for Value Acceptance will increase from 80% to 90% and Value Acceptance + Property Data will increase from 80% to the program limits. Both options are designed to match the risk of the collateral and the loan transaction.
“Fannie Mae is on a journey of continuous improvement to make the home valuation process more effective, efficient, and impartial for lenders, appraisers, and secondary mortgage market participants while maintaining Fannie Mae’s safety and soundness,” said Jake Williamson, Senior Vice President of Single-Family Collateral & Quality Risk Management, Fannie Mae. “Responsibly increasing the eligibility for valuation options that leverage data- and technology-driven approaches can also help reduce costs for borrowers.”
Since early 2020, Fannie Mae estimates the use of appraisal alternatives such as Value Acceptance and Value Acceptance + Property Data on loans Fannie Mae has acquired saved mortgage borrowers more than $2.5 billion.
Value Acceptance leverages a robust data and modeling framework to confirm the validity of a property’s value and sale price. Alternatively, Value Acceptance + Property Data utilizes trained and vetted third-party property data collectors, such as appraisers, real estate agents, and insurance inspectors, who conduct interior and exterior data collection on the subject property. Lenders are notified of transactions that are eligible for Value Acceptance or Value Acceptance + Property Data via Fannie Mae’s Desktop Underwriter®.
About Fannie Mae
Fannie Mae advances equitable and sustainable access to homeownership and quality, affordable rental housing for millions of people across America. We enable the 30-year fixed-rate mortgage and drive responsible innovation to make homebuying and renting easier, fairer, and more accessible. To learn more, visit:
fanniemae.com | X (formerly Twitter) | Facebook | LinkedIn | Instagram | YouTube | Blog
Fannie Mae Newsroom
https://www.fanniemae.com/news
Photo of Fannie Mae
https://www.fanniemae.com/resources/img/about-fm/fm-building.tif
Fannie Mae Resource Center
1-800-2FANNIE (800-232-6643)
![]() View original content to download multimedia:https://www.prnewswire.com/news-releases/fannie-mae-announces-changes-to-appraisal-alternatives-requirements-302288881.html
View original content to download multimedia:https://www.prnewswire.com/news-releases/fannie-mae-announces-changes-to-appraisal-alternatives-requirements-302288881.html
SOURCE Fannie Mae
Market News and Data brought to you by Benzinga APIs
© 2024 Benzinga.com. Benzinga does not provide investment advice. All rights reserved.
Unifi Earnings Preview
Unifi UFI is preparing to release its quarterly earnings on Wednesday, 2024-10-30. Here’s a brief overview of what investors should keep in mind before the announcement.
Analysts expect Unifi to report an earnings per share (EPS) of $-0.11.
The market awaits Unifi’s announcement, with hopes high for news of surpassing estimates and providing upbeat guidance for the next quarter.
It’s important for new investors to understand that guidance can be a significant driver of stock prices.
Past Earnings Performance
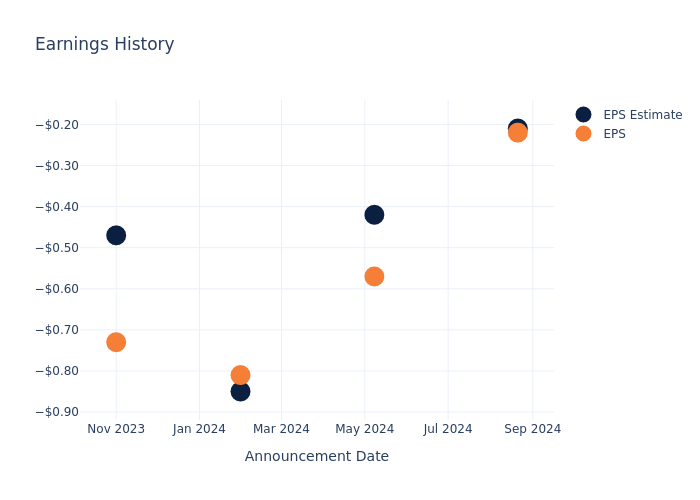
The company’s EPS missed by $0.01 in the last quarter, leading to a 17.09% increase in the share price on the following day.
Here’s a look at Unifi’s past performance and the resulting price change:
| Quarter | Q4 2024 | Q3 2024 | Q2 2024 | Q1 2024 |
|---|---|---|---|---|
| EPS Estimate | -0.21 | -0.42 | -0.85 | -0.47 |
| EPS Actual | -0.22 | -0.57 | -0.81 | -0.73 |
| Price Change % | 17.0% | 16.0% | -4.0% | -8.0% |

Market Performance of Unifi’s Stock
Shares of Unifi were trading at $6.9 as of October 28. Over the last 52-week period, shares are up 4.43%. Given that these returns are generally positive, long-term shareholders should be satisfied going into this earnings release.
To track all earnings releases for Unifi visit their earnings calendar on our site.
This article was generated by Benzinga’s automated content engine and reviewed by an editor.
Market News and Data brought to you by Benzinga APIs
© 2024 Benzinga.com. Benzinga does not provide investment advice. All rights reserved.
GE Aero Unusual Options Activity
Financial giants have made a conspicuous bullish move on GE Aero. Our analysis of options history for GE Aero GE revealed 28 unusual trades.
Delving into the details, we found 46% of traders were bullish, while 46% showed bearish tendencies. Out of all the trades we spotted, 22 were puts, with a value of $1,064,694, and 6 were calls, valued at $934,110.
Expected Price Movements
Analyzing the Volume and Open Interest in these contracts, it seems that the big players have been eyeing a price window from $115.0 to $210.0 for GE Aero during the past quarter.
Insights into Volume & Open Interest
Looking at the volume and open interest is an insightful way to conduct due diligence on a stock.
This data can help you track the liquidity and interest for GE Aero’s options for a given strike price.
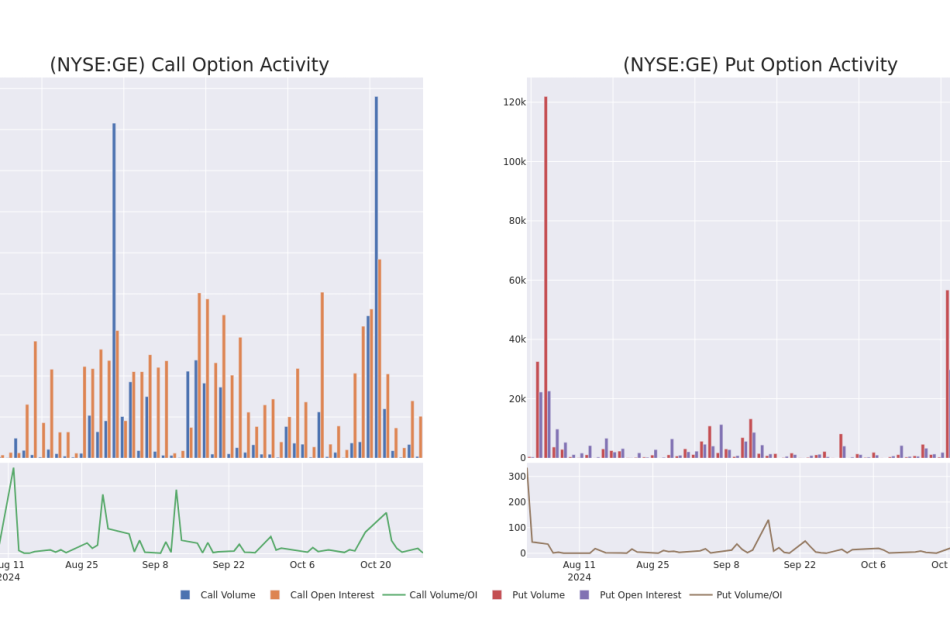
Below, we can observe the evolution of the volume and open interest of calls and puts, respectively, for all of GE Aero’s whale activity within a strike price range from $115.0 to $210.0 in the last 30 days.
GE Aero Option Activity Analysis: Last 30 Days

Biggest Options Spotted:
| Symbol | PUT/CALL | Trade Type | Sentiment | Exp. Date | Ask | Bid | Price | Strike Price | Total Trade Price | Open Interest | Volume |
|---|---|---|---|---|---|---|---|---|---|---|---|
| GE | CALL | TRADE | BULLISH | 12/20/24 | $3.75 | $3.55 | $3.74 | $185.00 | $729.3K | 5.2K | 150 |
| GE | PUT | SWEEP | BEARISH | 01/17/25 | $8.9 | $8.85 | $8.85 | $175.00 | $92.9K | 2.2K | 123 |
| GE | CALL | TRADE | BULLISH | 01/17/25 | $60.0 | $59.65 | $60.0 | $115.00 | $60.0K | 42 | 10 |
| GE | PUT | TRADE | BEARISH | 12/20/24 | $18.0 | $15.7 | $18.0 | $190.00 | $54.0K | 669 | 30 |
| GE | PUT | SWEEP | BEARISH | 12/20/24 | $13.85 | $13.55 | $13.74 | $185.00 | $50.8K | 893 | 324 |
About GE Aero
GE Aerospace is the global leader in designing, manufacturing, and servicing large aircraft engines, along with partner Safran in their CFM joint venture. With its massive global installed base of nearly 70,000 commercial and military engines, GE Aerospace earns most of its profits on recurring service revenue of that equipment, which operates for decades. GE Aerospace is the remaining core business of the company formed in 1892 with historical ties to American inventor Thomas Edison; that company became a storied conglomerate with peak revenue of $130 billion in 2000. GE spun off its appliance, finance, healthcare, and wind and power businesses between 2016 and 2024.
Present Market Standing of GE Aero
- Trading volume stands at 3,150,620, with GE’s price down by -0.63%, positioned at $174.25.
- RSI indicators show the stock to be may be approaching oversold.
- Earnings announcement expected in 84 days.
What The Experts Say On GE Aero
Over the past month, 5 industry analysts have shared their insights on this stock, proposing an average target price of $213.0.
Unusual Options Activity Detected: Smart Money on the Move
Benzinga Edge’s Unusual Options board spots potential market movers before they happen. See what positions big money is taking on your favorite stocks. Click here for access.
* Maintaining their stance, an analyst from UBS continues to hold a Buy rating for GE Aero, targeting a price of $230.
* An analyst from B of A Securities persists with their Buy rating on GE Aero, maintaining a target price of $200.
* Consistent in their evaluation, an analyst from Bernstein keeps a Outperform rating on GE Aero with a target price of $225.
* Consistent in their evaluation, an analyst from RBC Capital keeps a Outperform rating on GE Aero with a target price of $200.
* Maintaining their stance, an analyst from Wells Fargo continues to hold a Overweight rating for GE Aero, targeting a price of $210.
Options trading presents higher risks and potential rewards. Astute traders manage these risks by continually educating themselves, adapting their strategies, monitoring multiple indicators, and keeping a close eye on market movements. Stay informed about the latest GE Aero options trades with real-time alerts from Benzinga Pro.
Market News and Data brought to you by Benzinga APIs
© 2024 Benzinga.com. Benzinga does not provide investment advice. All rights reserved.
An Overview of NN's Earnings
NN NNBR will release its quarterly earnings report on Wednesday, 2024-10-30. Here’s a brief overview for investors ahead of the announcement.
Analysts anticipate NN to report an earnings per share (EPS) of $-0.03.
The announcement from NN is eagerly anticipated, with investors seeking news of surpassing estimates and favorable guidance for the next quarter.
It’s worth noting for new investors that guidance can be a key determinant of stock price movements.
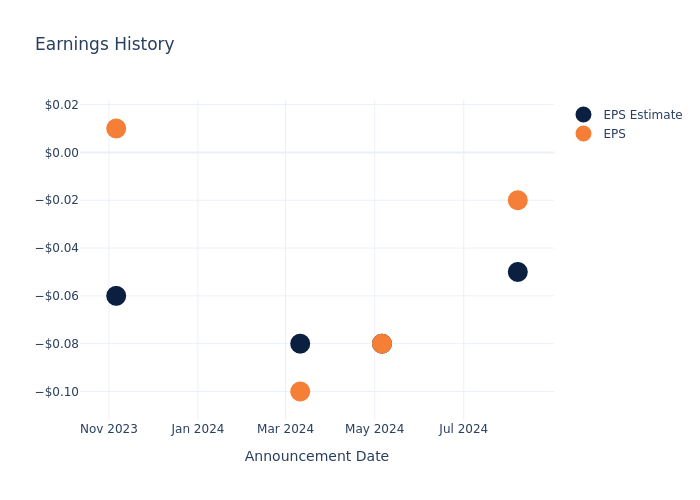
Earnings Track Record
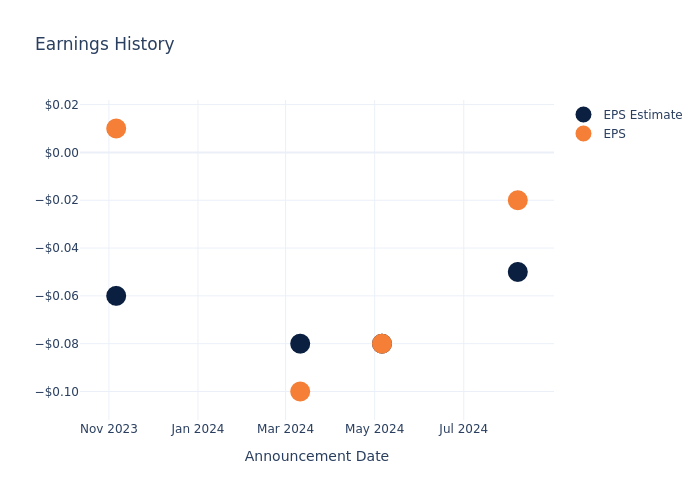
The company’s EPS beat by $0.03 in the last quarter, leading to a 1.51% increase in the share price on the following day.
Here’s a look at NN’s past performance and the resulting price change:
| Quarter | Q2 2024 | Q1 2024 | Q4 2023 | Q3 2023 |
|---|---|---|---|---|
| EPS Estimate | -0.05 | -0.08 | -0.08 | -0.06 |
| EPS Actual | -0.02 | -0.08 | -0.10 | 0.01 |
| Price Change % | 2.0% | -10.0% | -18.0% | 0.0% |
Tracking NN’s Stock Performance
Shares of NN were trading at $3.95 as of October 28. Over the last 52-week period, shares are up 118.72%. Given that these returns are generally positive, long-term shareholders should be satisfied going into this earnings release.
To track all earnings releases for NN visit their earnings calendar on our site.
This article was generated by Benzinga’s automated content engine and reviewed by an editor.
Market News and Data brought to you by Benzinga APIs
© 2024 Benzinga.com. Benzinga does not provide investment advice. All rights reserved.
Market Whales and Their Recent Bets on Dollar Gen Options
High-rolling investors have positioned themselves bearish on Dollar Gen DG, and it’s important for retail traders to take note.
This activity came to our attention today through Benzinga’s tracking of publicly available options data. The identities of these investors are uncertain, but such a significant move in DG often signals that someone has privileged information.
Today, Benzinga’s options scanner spotted 9 options trades for Dollar Gen. This is not a typical pattern.
The sentiment among these major traders is split, with 22% bullish and 66% bearish. Among all the options we identified, there was one put, amounting to $265,014, and 8 calls, totaling $905,522.
Predicted Price Range
Taking into account the Volume and Open Interest on these contracts, it appears that whales have been targeting a price range from $60.0 to $120.0 for Dollar Gen over the last 3 months.
Volume & Open Interest Development
In terms of liquidity and interest, the mean open interest for Dollar Gen options trades today is 1017.88 with a total volume of 835.00.
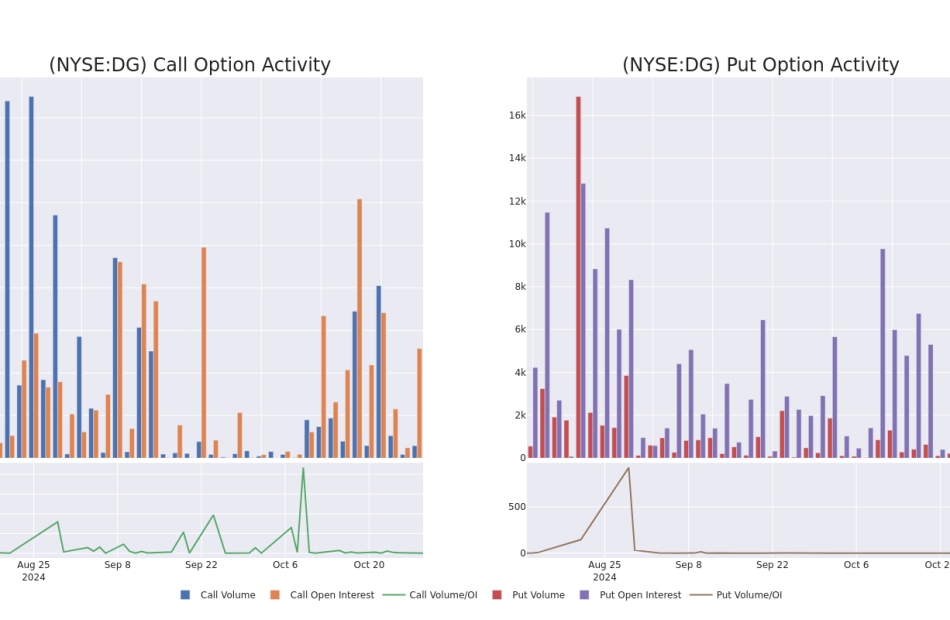
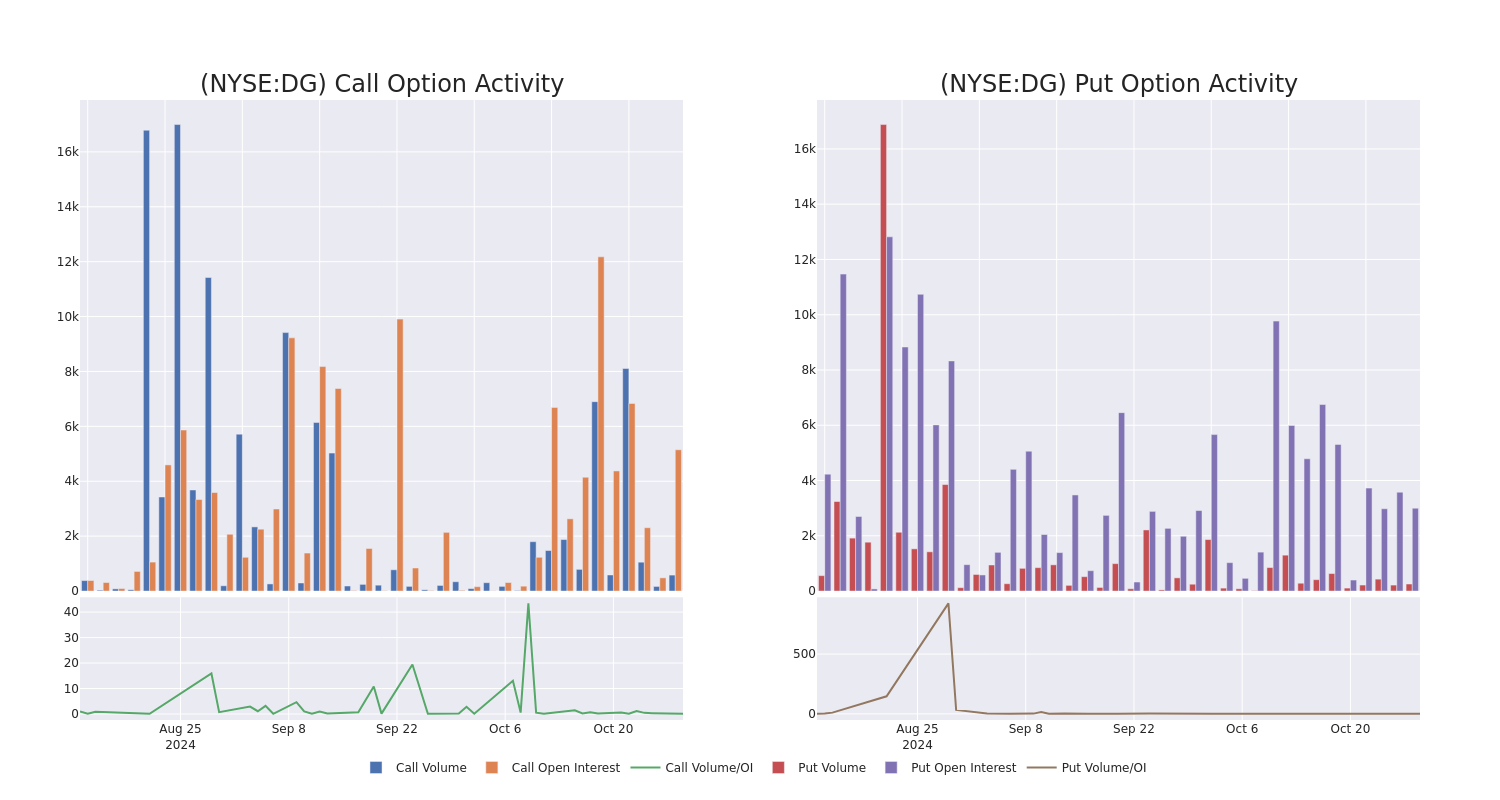
In the following chart, we are able to follow the development of volume and open interest of call and put options for Dollar Gen’s big money trades within a strike price range of $60.0 to $120.0 over the last 30 days.
Dollar Gen 30-Day Option Volume & Interest Snapshot
Largest Options Trades Observed:
| Symbol | PUT/CALL | Trade Type | Sentiment | Exp. Date | Ask | Bid | Price | Strike Price | Total Trade Price | Open Interest | Volume |
|---|---|---|---|---|---|---|---|---|---|---|---|
| DG | CALL | TRADE | BEARISH | 09/19/25 | $23.9 | $22.55 | $22.8 | $65.00 | $684.0K | 200 | 0 |
| DG | PUT | SWEEP | BEARISH | 03/21/25 | $10.95 | $10.9 | $10.95 | $85.00 | $265.0K | 2.9K | 254 |
| DG | CALL | TRADE | BEARISH | 12/20/24 | $22.8 | $22.0 | $22.0 | $60.00 | $44.0K | 1 | 0 |
| DG | CALL | SWEEP | BULLISH | 11/15/24 | $1.99 | $1.81 | $2.0 | $85.00 | $35.7K | 2.4K | 1 |
| DG | CALL | SWEEP | BULLISH | 11/15/24 | $1.78 | $1.69 | $1.77 | $85.00 | $35.6K | 2.4K | 381 |
About Dollar Gen
With more than 20,000 locations, Dollar General’s banner is nearly ubiquitous across the rural United States. Dollar General serves as a convenient shopping destination for fill-in store trips, with its value proposition most relevant to consumers in small communities with a dearth of shopping options. The retailer operates a frugal store of about 7,500 square feet and primarily offers an assortment of branded and private-label consumable items (80% of net sales) such as paper and cleaning products, packaged and perishable food, tobacco, and health and beauty items at low prices. Dollar General also offers a limited assortment of seasonal merchandise, home products, and apparel. The firm sells most items at a price point of $10 or less.
Following our analysis of the options activities associated with Dollar Gen, we pivot to a closer look at the company’s own performance.
Dollar Gen’s Current Market Status
- Currently trading with a volume of 2,329,852, the DG’s price is down by -0.8%, now at $80.45.
- RSI readings suggest the stock is currently may be approaching oversold.
- Anticipated earnings release is in 37 days.
Expert Opinions on Dollar Gen
In the last month, 2 experts released ratings on this stock with an average target price of $101.5.
Unusual Options Activity Detected: Smart Money on the Move
Benzinga Edge’s Unusual Options board spots potential market movers before they happen. See what positions big money is taking on your favorite stocks. Click here for access.
* An analyst from Bernstein has revised its rating downward to Outperform, adjusting the price target to $98.
* An analyst from Evercore ISI Group has decided to maintain their In-Line rating on Dollar Gen, which currently sits at a price target of $105.
Trading options involves greater risks but also offers the potential for higher profits. Savvy traders mitigate these risks through ongoing education, strategic trade adjustments, utilizing various indicators, and staying attuned to market dynamics. Keep up with the latest options trades for Dollar Gen with Benzinga Pro for real-time alerts.
Market News and Data brought to you by Benzinga APIs
© 2024 Benzinga.com. Benzinga does not provide investment advice. All rights reserved.
A Preview Of NCS Multistage Holdings's Earnings
NCS Multistage Holdings NCSM will release its quarterly earnings report on Wednesday, 2024-10-30. Here’s a brief overview for investors ahead of the announcement.
Analysts anticipate NCS Multistage Holdings to report an earnings per share (EPS) of $1.27.
Investors in NCS Multistage Holdings are eagerly awaiting the company’s announcement, hoping for news of surpassing estimates and positive guidance for the next quarter.
It’s worth noting for new investors that stock prices can be heavily influenced by future projections rather than just past performance.
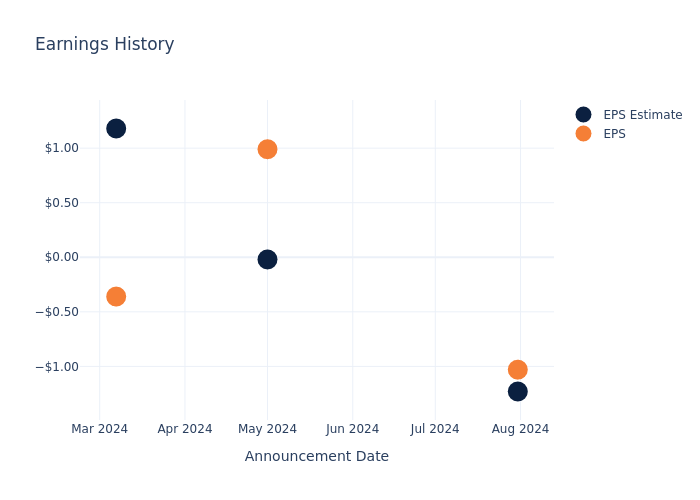
Earnings History Snapshot
Last quarter the company beat EPS by $0.20, which was followed by a 0.5% drop in the share price the next day.
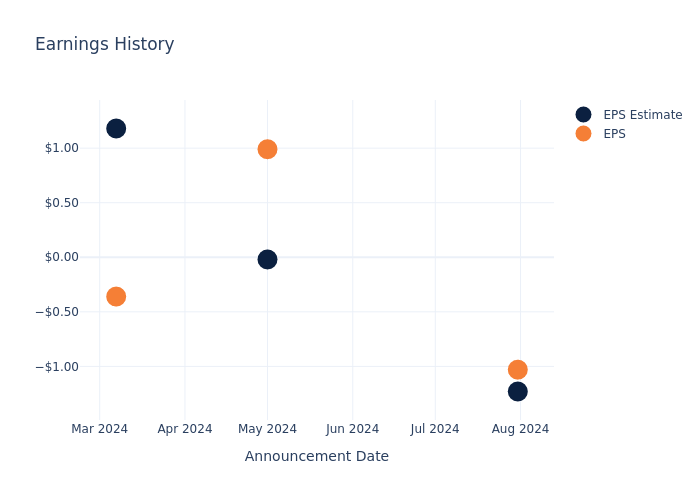
Here’s a look at NCS Multistage Holdings’s past performance and the resulting price change:
| Quarter | Q2 2024 | Q1 2024 | Q4 2023 | Q3 2023 |
|---|---|---|---|---|
| EPS Estimate | -1.23 | -0.02 | 1.18 | 2.59 |
| EPS Actual | -1.03 | 0.99 | -0.36 | 1.91 |
| Price Change % | -1.0% | 8.0% | 3.0% | -5.0% |
NCS Multistage Holdings Share Price Analysis
Shares of NCS Multistage Holdings were trading at $17.855 as of October 28. Over the last 52-week period, shares are up 28.36%. Given that these returns are generally positive, long-term shareholders are likely bullish going into this earnings release.
This article was generated by Benzinga’s automated content engine and reviewed by an editor.
Market News and Data brought to you by Benzinga APIs
© 2024 Benzinga.com. Benzinga does not provide investment advice. All rights reserved.
Unpacking the Latest Options Trading Trends in Mobileye Global
Financial giants have made a conspicuous bearish move on Mobileye Global. Our analysis of options history for Mobileye Global MBLY revealed 9 unusual trades.
Delving into the details, we found 22% of traders were bullish, while 66% showed bearish tendencies. Out of all the trades we spotted, 6 were puts, with a value of $328,610, and 3 were calls, valued at $474,370.
Expected Price Movements
Based on the trading activity, it appears that the significant investors are aiming for a price territory stretching from $12.0 to $13.5 for Mobileye Global over the recent three months.
Volume & Open Interest Trends
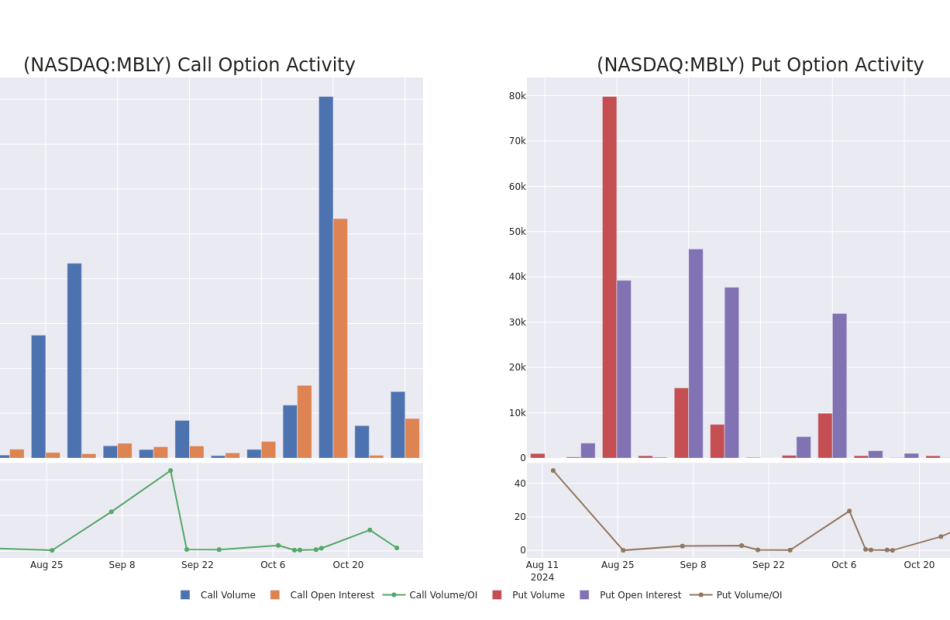
In today’s trading context, the average open interest for options of Mobileye Global stands at 1030.67, with a total volume reaching 26,344.00. The accompanying chart delineates the progression of both call and put option volume and open interest for high-value trades in Mobileye Global, situated within the strike price corridor from $12.0 to $13.5, throughout the last 30 days.
Mobileye Global Call and Put Volume: 30-Day Overview

Largest Options Trades Observed:
| Symbol | PUT/CALL | Trade Type | Sentiment | Exp. Date | Ask | Bid | Price | Strike Price | Total Trade Price | Open Interest | Volume |
|---|---|---|---|---|---|---|---|---|---|---|---|
| MBLY | CALL | SWEEP | BULLISH | 01/17/25 | $2.8 | $2.6 | $2.77 | $12.00 | $329.8K | 909 | 2.3K |
| MBLY | CALL | SWEEP | BULLISH | 01/17/25 | $2.75 | $2.7 | $2.7 | $12.00 | $109.3K | 909 | 409 |
| MBLY | PUT | SWEEP | BEARISH | 05/16/25 | $3.0 | $2.95 | $3.0 | $13.00 | $90.3K | 1.3K | 341 |
| MBLY | PUT | SWEEP | BEARISH | 11/01/24 | $0.45 | $0.4 | $0.45 | $12.00 | $67.3K | 595 | 3.5K |
| MBLY | PUT | SWEEP | BEARISH | 11/01/24 | $0.6 | $0.5 | $0.6 | $12.50 | $64.0K | 2.2K | 7.5K |
About Mobileye Global
Mobileye Global Inc engages in the development and deployment of ADAS and autonomous driving technologies and solutions. It is building a portfolio of end-to-end ADAS and autonomous driving solutions to provide the capabilities needed for the future of autonomous driving, leveraging a comprehensive suite of purpose-built software and hardware technologies. Mobileye is the Company’s only reportable operating segment. Its solutions comprise Driver Assist, Cloud-Enhanced Driver Assist, Mobileye SuperVision Lite, Mobileye SuperVision, Mobileye Chauffeur, Mobileye Drive, Self-Driving System & Vehicles. It also provides data services to Expedite Maintenance Operations with AI-Powered Road Survey Technology.
After a thorough review of the options trading surrounding Mobileye Global, we move to examine the company in more detail. This includes an assessment of its current market status and performance.
Current Position of Mobileye Global
- Currently trading with a volume of 3,891,167, the MBLY’s price is up by 1.54%, now at $13.22.
- RSI readings suggest the stock is currently may be approaching overbought.
- Anticipated earnings release is in 2 days.
What The Experts Say On Mobileye Global
A total of 5 professional analysts have given their take on this stock in the last 30 days, setting an average price target of $18.8.
Unusual Options Activity Detected: Smart Money on the Move
Benzinga Edge’s Unusual Options board spots potential market movers before they happen. See what positions big money is taking on your favorite stocks. Click here for access.
* Maintaining their stance, an analyst from Goldman Sachs continues to hold a Buy rating for Mobileye Global, targeting a price of $20.
* An analyst from Evercore ISI Group persists with their Outperform rating on Mobileye Global, maintaining a target price of $30.
* Reflecting concerns, an analyst from RBC Capital lowers its rating to Sector Perform with a new price target of $11.
* Maintaining their stance, an analyst from Barclays continues to hold a Overweight rating for Mobileye Global, targeting a price of $19.
* An analyst from UBS downgraded its action to Neutral with a price target of $14.
Options are a riskier asset compared to just trading the stock, but they have higher profit potential. Serious options traders manage this risk by educating themselves daily, scaling in and out of trades, following more than one indicator, and following the markets closely.
If you want to stay updated on the latest options trades for Mobileye Global, Benzinga Pro gives you real-time options trades alerts.
Market News and Data brought to you by Benzinga APIs
© 2024 Benzinga.com. Benzinga does not provide investment advice. All rights reserved.
Earnings Preview For Spok Holdings
Spok Holdings SPOK will release its quarterly earnings report on Wednesday, 2024-10-30. Here’s a brief overview for investors ahead of the announcement.
Analysts anticipate Spok Holdings to report an earnings per share (EPS) of $0.18.
Investors in Spok Holdings are eagerly awaiting the company’s announcement, hoping for news of surpassing estimates and positive guidance for the next quarter.
It’s worth noting for new investors that stock prices can be heavily influenced by future projections rather than just past performance.
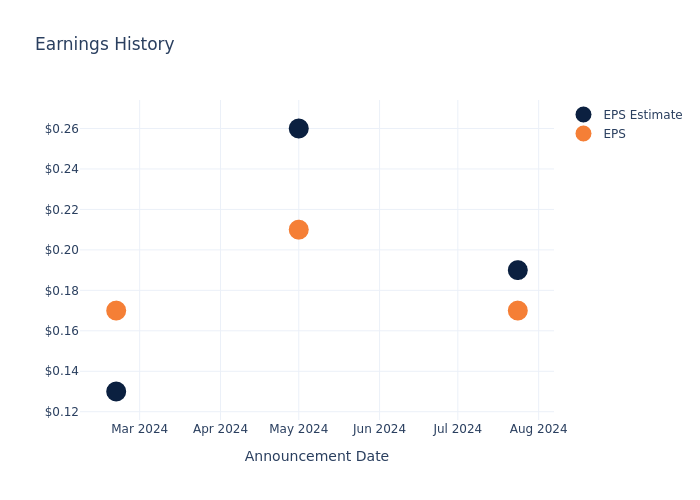
Overview of Past Earnings
The company’s EPS missed by $0.02 in the last quarter, leading to a 6.5% drop in the share price on the following day.
Here’s a look at Spok Holdings’s past performance and the resulting price change:
| Quarter | Q2 2024 | Q1 2024 | Q4 2023 | Q3 2023 |
|---|---|---|---|---|
| EPS Estimate | 0.19 | 0.26 | 0.13 | 0.18 |
| EPS Actual | 0.17 | 0.21 | 0.17 | 0.22 |
| Price Change % | -7.000000000000001% | -8.0% | 9.0% | 2.0% |

Stock Performance
Shares of Spok Holdings were trading at $15.14 as of October 28. Over the last 52-week period, shares are down 3.12%. Given that these returns are generally negative, long-term shareholders are likely unhappy going into this earnings release.
Analyst Views on Spok Holdings
For investors, staying informed about market sentiments and expectations in the industry is paramount. This analysis provides an exploration of the latest insights on Spok Holdings.
The consensus rating for Spok Holdings is Neutral, based on 1 analyst ratings. With an average one-year price target of $15.0, there’s a potential 0.92% downside.
Peer Ratings Comparison
This comparison focuses on the analyst ratings and average 1-year price targets of and Spok Holdings, three major players in the industry, shedding light on their relative performance expectations and market positioning.
Peer Analysis Summary
The peer analysis summary provides a snapshot of key metrics for and Spok Holdings, illuminating their respective standings within the industry. These metrics offer valuable insights into their market positions and comparative performance.
| Company | Consensus | Revenue Growth | Gross Profit | Return on Equity |
|---|---|---|---|---|
| Spok Holdings | Neutral | -6.80% | $26.82M | 2.15% |
Key Takeaway:
Spok Holdings ranks at the bottom for Revenue Growth among its peers. It also ranks at the bottom for Gross Profit. However, it ranks in the middle for Return on Equity. The consensus rating for Spok Holdings is Neutral.
All You Need to Know About Spok Holdings
Spok Holdings Inc is a provider of healthcare communications. It reports three market segments namely Healthcare, Government, and Large enterprise. The company provides paging services and software solutions in the United States and abroad. It provides services such as Value-Added Services, Advisory Services, Assessment Services and Adoption Services.
Financial Milestones: Spok Holdings’s Journey
Market Capitalization Analysis: The company exhibits a lower market capitalization profile, positioning itself below industry averages. This suggests a smaller scale relative to peers.
Negative Revenue Trend: Examining Spok Holdings’s financials over 3 months reveals challenges. As of 30 June, 2024, the company experienced a decline of approximately -6.8% in revenue growth, reflecting a decrease in top-line earnings. In comparison to its industry peers, the company trails behind with a growth rate lower than the average among peers in the Communication Services sector.
Net Margin: Spok Holdings’s net margin excels beyond industry benchmarks, reaching 10.08%. This signifies efficient cost management and strong financial health.
Return on Equity (ROE): The company’s ROE is a standout performer, exceeding industry averages. With an impressive ROE of 2.15%, the company showcases effective utilization of equity capital.
Return on Assets (ROA): Spok Holdings’s ROA stands out, surpassing industry averages. With an impressive ROA of 1.59%, the company demonstrates effective utilization of assets and strong financial performance.
Debt Management: The company maintains a balanced debt approach with a debt-to-equity ratio below industry norms, standing at 0.06.
To track all earnings releases for Spok Holdings visit their earnings calendar on our site.
This article was generated by Benzinga’s automated content engine and reviewed by an editor.
Market News and Data brought to you by Benzinga APIs
© 2024 Benzinga.com. Benzinga does not provide investment advice. All rights reserved.


