Earnings Outlook For Harmony Biosciences
Harmony Biosciences HRMY is set to give its latest quarterly earnings report on Tuesday, 2024-10-29. Here’s what investors need to know before the announcement.
Analysts estimate that Harmony Biosciences will report an earnings per share (EPS) of $0.66.
Harmony Biosciences bulls will hope to hear the company announce they’ve not only beaten that estimate, but also to provide positive guidance, or forecasted growth, for the next quarter.
New investors should note that it is sometimes not an earnings beat or miss that most affects the price of a stock, but the guidance (or forecast).
Earnings Track Record
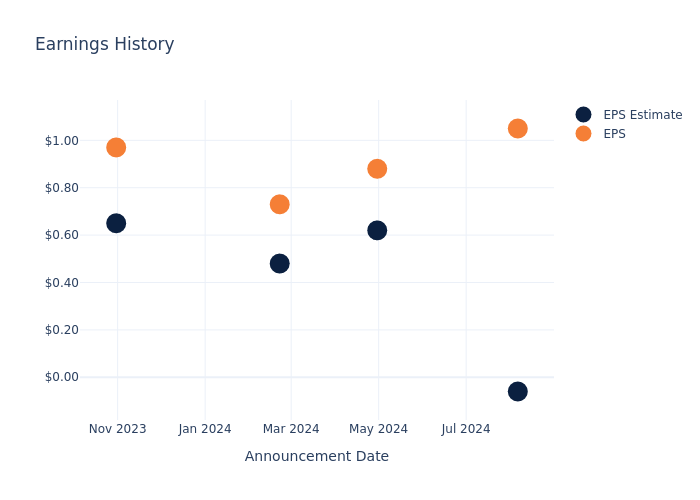
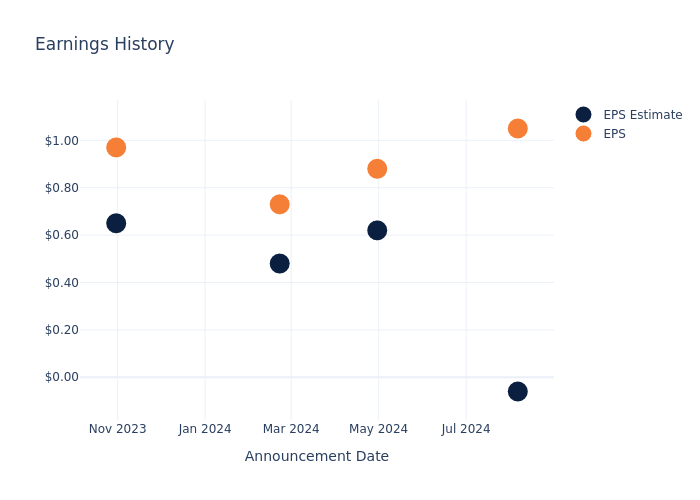
The company’s EPS beat by $1.11 in the last quarter, leading to a 2.19% increase in the share price on the following day.
Here’s a look at Harmony Biosciences’s past performance and the resulting price change:
| Quarter | Q2 2024 | Q1 2024 | Q4 2023 | Q3 2023 |
|---|---|---|---|---|
| EPS Estimate | -0.06 | 0.62 | 0.48 | 0.65 |
| EPS Actual | 1.05 | 0.88 | 0.73 | 0.97 |
| Price Change % | 2.0% | -2.0% | 3.0% | 4.0% |
Performance of Harmony Biosciences Shares
Shares of Harmony Biosciences were trading at $34.5 as of October 25. Over the last 52-week period, shares are up 51.32%. Given that these returns are generally positive, long-term shareholders are likely bullish going into this earnings release.
To track all earnings releases for Harmony Biosciences visit their earnings calendar on our site.
This article was generated by Benzinga’s automated content engine and reviewed by an editor.
Market News and Data brought to you by Benzinga APIs
© 2024 Benzinga.com. Benzinga does not provide investment advice. All rights reserved.
Modine Manufacturing's Earnings: A Preview
Modine Manufacturing MOD is preparing to release its quarterly earnings on Tuesday, 2024-10-29. Here’s a brief overview of what investors should keep in mind before the announcement.
Analysts expect Modine Manufacturing to report an earnings per share (EPS) of $0.92.
The market awaits Modine Manufacturing’s announcement, with hopes high for news of surpassing estimates and providing upbeat guidance for the next quarter.
It’s important for new investors to understand that guidance can be a significant driver of stock prices.
Performance in Previous Earnings
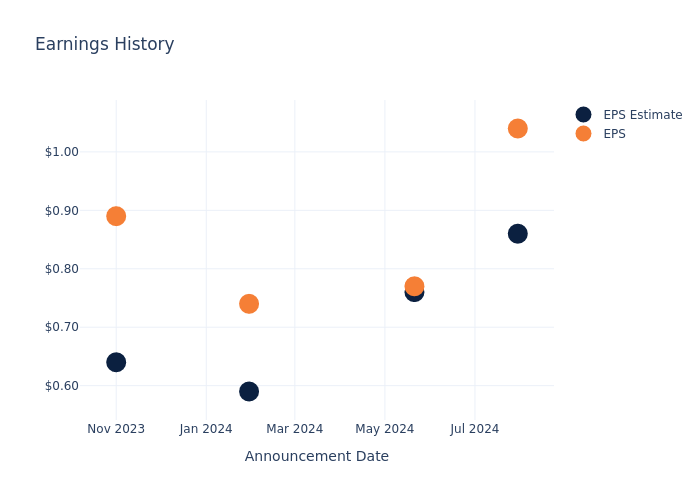
Last quarter the company beat EPS by $0.18, which was followed by a 18.94% increase in the share price the next day.
Here’s a look at Modine Manufacturing’s past performance and the resulting price change:
| Quarter | Q1 2025 | Q4 2024 | Q3 2024 | Q2 2024 |
|---|---|---|---|---|
| EPS Estimate | 0.86 | 0.76 | 0.59 | 0.64 |
| EPS Actual | 1.04 | 0.77 | 0.74 | 0.89 |
| Price Change % | 19.0% | -5.0% | 3.0% | -2.0% |
Performance of Modine Manufacturing Shares
Shares of Modine Manufacturing were trading at $127.25 as of October 25. Over the last 52-week period, shares are up 229.08%. Given that these returns are generally positive, long-term shareholders are likely bullish going into this earnings release.
Insights Shared by Analysts on Modine Manufacturing
For investors, staying informed about market sentiments and expectations in the industry is paramount. This analysis provides an exploration of the latest insights on Modine Manufacturing.
The consensus rating for Modine Manufacturing is Buy, based on 6 analyst ratings. With an average one-year price target of $141.5, there’s a potential 11.2% upside.
Comparing Ratings with Competitors
The following analysis focuses on the analyst ratings and average 1-year price targets of Gentex, Autoliv and BorgWarner, three prominent industry players, providing insights into their relative performance expectations and market positioning.
- The consensus outlook from analysts is an Neutral trajectory for Gentex, with an average 1-year price target of $34.25, indicating a potential 73.08% downside.
- As per analysts’ assessments, Autoliv is favoring an Neutral trajectory, with an average 1-year price target of $111.83, suggesting a potential 12.12% downside.
- For BorgWarner, analysts project an Outperform trajectory, with an average 1-year price target of $43.0, indicating a potential 66.21% downside.
Key Findings: Peer Analysis Summary
The peer analysis summary provides a snapshot of key metrics for Gentex, Autoliv and BorgWarner, illuminating their respective standings within the industry. These metrics offer valuable insights into their market positions and comparative performance.
| Company | Consensus | Revenue Growth | Gross Profit | Return on Equity |
|---|---|---|---|---|
| Modine Manufacturing | Buy | 6.28% | $162.60M | 6.16% |
| Gentex | Neutral | -1.81% | $188.56M | 3.55% |
| Autoliv | Neutral | -1.14% | $475M | 5.84% |
| BorgWarner | Outperform | -1.85% | $685M | 5.08% |
Key Takeaway:
Modine Manufacturing ranks highest in Gross Profit and Return on Equity among its peers. It is in the middle for Revenue Growth.
All You Need to Know About Modine Manufacturing
Modine Manufacturing Co provides thermal management solutions to diversified markets and customers. The company provides engineered heat transfer systems and heat transfer components for use in on- and off-highway original equipment manufacturer (OEM) vehicular applications in the United States. It offers powertrain cooling products, such as engine cooling assemblies, radiators, condensers, and charge air coolers; auxiliary cooling products, including power steering and transmission oil coolers.
Financial Milestones: Modine Manufacturing’s Journey
Market Capitalization Analysis: With an elevated market capitalization, the company stands out above industry averages, showcasing substantial size and market acknowledgment.
Revenue Growth: Over the 3 months period, Modine Manufacturing showcased positive performance, achieving a revenue growth rate of 6.28% as of 30 June, 2024. This reflects a substantial increase in the company’s top-line earnings. As compared to competitors, the company surpassed expectations with a growth rate higher than the average among peers in the Consumer Discretionary sector.
Net Margin: Modine Manufacturing’s net margin is impressive, surpassing industry averages. With a net margin of 7.15%, the company demonstrates strong profitability and effective cost management.
Return on Equity (ROE): Modine Manufacturing’s ROE excels beyond industry benchmarks, reaching 6.16%. This signifies robust financial management and efficient use of shareholder equity capital.
Return on Assets (ROA): The company’s ROA is a standout performer, exceeding industry averages. With an impressive ROA of 2.54%, the company showcases effective utilization of assets.
Debt Management: Modine Manufacturing’s debt-to-equity ratio is below the industry average at 0.55, reflecting a lower dependency on debt financing and a more conservative financial approach.
To track all earnings releases for Modine Manufacturing visit their earnings calendar on our site.
This article was generated by Benzinga’s automated content engine and reviewed by an editor.
Market News and Data brought to you by Benzinga APIs
© 2024 Benzinga.com. Benzinga does not provide investment advice. All rights reserved.
Preview: ExlService Holdings's Earnings
ExlService Holdings EXLS will release its quarterly earnings report on Tuesday, 2024-10-29. Here’s a brief overview for investors ahead of the announcement.
Analysts anticipate ExlService Holdings to report an earnings per share (EPS) of $0.41.
ExlService Holdings bulls will hope to hear the company announce they’ve not only beaten that estimate, but also to provide positive guidance, or forecasted growth, for the next quarter.
New investors should note that it is sometimes not an earnings beat or miss that most affects the price of a stock, but the guidance (or forecast).
Past Earnings Performance
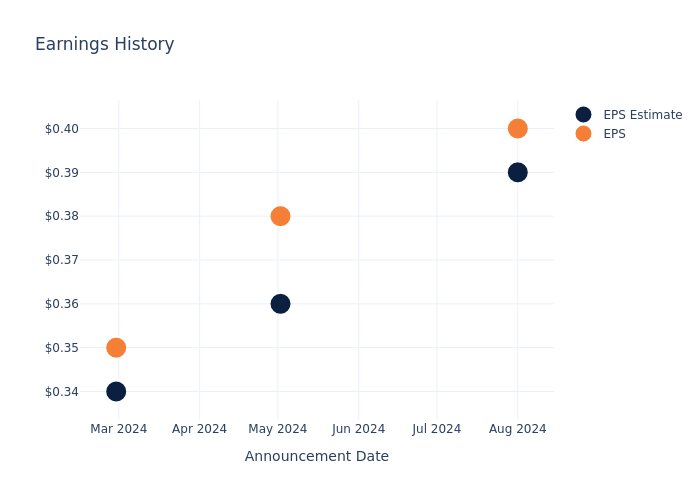
The company’s EPS beat by $0.01 in the last quarter, leading to a 4.13% increase in the share price on the following day.
Here’s a look at ExlService Holdings’s past performance and the resulting price change:
| Quarter | Q2 2024 | Q1 2024 | Q4 2023 | Q3 2023 |
|---|---|---|---|---|
| EPS Estimate | 0.39 | 0.36 | 0.34 | 0.34 |
| EPS Actual | 0.40 | 0.38 | 0.35 | 0.37 |
| Price Change % | 4.0% | -1.0% | 2.0% | -2.0% |

Market Performance of ExlService Holdings’s Stock
Shares of ExlService Holdings were trading at $38.6 as of October 25. Over the last 52-week period, shares are up 48.79%. Given that these returns are generally positive, long-term shareholders are likely bullish going into this earnings release.
Analysts’ Perspectives on ExlService Holdings
Understanding market sentiments and expectations within the industry is crucial for investors. This analysis delves into the latest insights on ExlService Holdings.
ExlService Holdings has received a total of 5 ratings from analysts, with the consensus rating as Buy. With an average one-year price target of $41.8, the consensus suggests a potential 8.29% upside.
Comparing Ratings Among Industry Peers
The below comparison of the analyst ratings and average 1-year price targets of Genpact, Verra Mobility and Concentrix, three prominent players in the industry, gives insights for their relative performance expectations and market positioning.
- Genpact is maintaining an Neutral status according to analysts, with an average 1-year price target of $41.17, indicating a potential 6.66% upside.
- For Verra Mobility, analysts project an Neutral trajectory, with an average 1-year price target of $29.0, indicating a potential 24.87% downside.
- The prevailing sentiment among analysts is an Outperform trajectory for Concentrix, with an average 1-year price target of $80.43, implying a potential 108.37% upside.
Comprehensive Peer Analysis Summary
The peer analysis summary provides a snapshot of key metrics for Genpact, Verra Mobility and Concentrix, illuminating their respective standings within the industry. These metrics offer valuable insights into their market positions and comparative performance.
| Company | Consensus | Revenue Growth | Gross Profit | Return on Equity |
|---|---|---|---|---|
| ExlService Holdings | Buy | 10.71% | $166.26M | 5.53% |
| Genpact | Neutral | 6.39% | $416.38M | 5.26% |
| Verra Mobility | Neutral | 8.79% | $209.94M | 7.71% |
| Concentrix | Outperform | 46.21% | $864.19M | 0.39% |
Key Takeaway:
ExlService Holdings ranks first in revenue growth among its peers. It ranks lowest in gross profit and return on equity.
About ExlService Holdings
ExlService Holdings Inc. is a business process management company that provides digital operations and analytical services to clients driving enterprise-scale business transformation initiatives that leverage company’s deep expertise in analytics, AI, ML and cloud. The company offers business process outsourcing and automation services, and data-driven insights to customers across multiple industries. The company operates through four segments based on the products and services offered and markets served: Insurance, Healthcare, Emerging, Analytics. The vast majority of the company’s revenue is earned in the United States, and more than half of its revenue comes from Analytics segment.
ExlService Holdings: Delving into Financials
Market Capitalization: Surpassing industry standards, the company’s market capitalization asserts its dominance in terms of size, suggesting a robust market position.
Revenue Growth: ExlService Holdings’s revenue growth over a period of 3 months has been noteworthy. As of 30 June, 2024, the company achieved a revenue growth rate of approximately 10.71%. This indicates a substantial increase in the company’s top-line earnings. When compared to others in the Industrials sector, the company excelled with a growth rate higher than the average among peers.
Net Margin: ExlService Holdings’s net margin excels beyond industry benchmarks, reaching 10.22%. This signifies efficient cost management and strong financial health.
Return on Equity (ROE): ExlService Holdings’s ROE stands out, surpassing industry averages. With an impressive ROE of 5.53%, the company demonstrates effective use of equity capital and strong financial performance.
Return on Assets (ROA): ExlService Holdings’s ROA surpasses industry standards, highlighting the company’s exceptional financial performance. With an impressive 3.11% ROA, the company effectively utilizes its assets for optimal returns.
Debt Management: The company maintains a balanced debt approach with a debt-to-equity ratio below industry norms, standing at 0.49.
To track all earnings releases for ExlService Holdings visit their earnings calendar on our site.
This article was generated by Benzinga’s automated content engine and reviewed by an editor.
Market News and Data brought to you by Benzinga APIs
© 2024 Benzinga.com. Benzinga does not provide investment advice. All rights reserved.
A Look Ahead: Mirion Technologies's Earnings Forecast
Mirion Technologies MIR is gearing up to announce its quarterly earnings on Tuesday, 2024-10-29. Here’s a quick overview of what investors should know before the release.
Analysts are estimating that Mirion Technologies will report an earnings per share (EPS) of $0.09.
The market awaits Mirion Technologies’s announcement, with hopes high for news of surpassing estimates and providing upbeat guidance for the next quarter.
It’s important for new investors to understand that guidance can be a significant driver of stock prices.
Performance in Previous Earnings
In the previous earnings release, the company beat EPS by $0.03, leading to a 2.04% drop in the share price the following trading session.
Here’s a look at Mirion Technologies’s past performance and the resulting price change:
| Quarter | Q2 2024 | Q1 2024 | Q4 2023 | Q3 2023 |
|---|---|---|---|---|
| EPS Estimate | 0.07 | 0.06 | 0.14 | |
| EPS Actual | 0.10 | 0.06 | 0.15 | 0.05 |
| Price Change % | -2.0% | -6.0% | 7.000000000000001% | 14.000000000000002% |
Market Performance of Mirion Technologies’s Stock
Shares of Mirion Technologies were trading at $14.36 as of October 25. Over the last 52-week period, shares are up 104.26%. Given that these returns are generally positive, long-term shareholders are likely bullish going into this earnings release.
Analyst Views on Mirion Technologies
For investors, grasping market sentiments and expectations in the industry is vital. This analysis explores the latest insights regarding Mirion Technologies.
Mirion Technologies has received a total of 1 ratings from analysts, with the consensus rating as Buy. With an average one-year price target of $14.0, the consensus suggests a potential 2.51% downside.
Peer Ratings Comparison
In this comparison, we explore the analyst ratings and average 1-year price targets of Crane NXT, Advanced Energy Indus and OSI Systems, three prominent industry players, offering insights into their relative performance expectations and market positioning.
- Analysts currently favor an Outperform trajectory for Crane NXT, with an average 1-year price target of $87.33, suggesting a potential 508.15% upside.
- For Advanced Energy Indus, analysts project an Neutral trajectory, with an average 1-year price target of $112.0, indicating a potential 679.94% upside.
- The prevailing sentiment among analysts is an Buy trajectory for OSI Systems, with an average 1-year price target of $175.75, implying a potential 1123.89% upside.
Insights: Peer Analysis
In the peer analysis summary, key metrics for Crane NXT, Advanced Energy Indus and OSI Systems are highlighted, providing an understanding of their respective standings within the industry and offering insights into their market positions and comparative performance.
| Company | Consensus | Revenue Growth | Gross Profit | Return on Equity |
|---|---|---|---|---|
| Mirion Technologies | Buy | 5.02% | $97.40M | -0.79% |
| Crane NXT | Outperform | 5.16% | $160.90M | 4.26% |
| Advanced Energy Indus | Neutral | -12.17% | $127.74M | 1.30% |
| OSI Systems | Buy | -28.47% | $154.32M | 2.17% |
Key Takeaway:
Mirion Technologies ranks at the top for Revenue Growth among its peers. It is at the bottom for Gross Profit and Return on Equity.
All You Need to Know About Mirion Technologies
Mirion Technologies Inc provides products, services, and software that allows customers to safely leverage the power of ionizing radiation for the greater good of humanity through critical applications in the medical, nuclear, defense markets, as well as laboratories, scientific research, analysis and exploration. The Company manages its operations through two segments: Medical and Technologies. The Medical segment provides radiation oncology quality assurance, delivering patient safety solutions for diagnostic imaging and radiation therapy centers. The Technologies segment is based around the nuclear energy, defense, laboratories, and scientific research markets as well as other industrial markets. It derives maximum revenue from Technologies Segment.
Financial Milestones: Mirion Technologies’s Journey
Market Capitalization Analysis: Falling below industry benchmarks, the company’s market capitalization reflects a reduced size compared to peers. This positioning may be influenced by factors such as growth expectations or operational capacity.
Positive Revenue Trend: Examining Mirion Technologies’s financials over 3 months reveals a positive narrative. The company achieved a noteworthy revenue growth rate of 5.02% as of 30 June, 2024, showcasing a substantial increase in top-line earnings. In comparison to its industry peers, the company trails behind with a growth rate lower than the average among peers in the Information Technology sector.
Net Margin: Mirion Technologies’s net margin falls below industry averages, indicating challenges in achieving strong profitability. With a net margin of -5.65%, the company may face hurdles in effective cost management.
Return on Equity (ROE): Mirion Technologies’s ROE lags behind industry averages, suggesting challenges in maximizing returns on equity capital. With an ROE of -0.79%, the company may face hurdles in achieving optimal financial performance.
Return on Assets (ROA): The company’s ROA is below industry benchmarks, signaling potential difficulties in efficiently utilizing assets. With an ROA of -0.44%, the company may need to address challenges in generating satisfactory returns from its assets.
Debt Management: Mirion Technologies’s debt-to-equity ratio is below the industry average. With a ratio of 0.48, the company relies less on debt financing, maintaining a healthier balance between debt and equity, which can be viewed positively by investors.
To track all earnings releases for Mirion Technologies visit their earnings calendar on our site.
This article was generated by Benzinga’s automated content engine and reviewed by an editor.
© 2024 Benzinga.com. Benzinga does not provide investment advice. All rights reserved.
FLUX INVESTOR NEWS: Flux Power Holdings, Inc. Investors that Suffered Losses are Encouraged to Contact RLF About Ongoing Investigation into the Company (NASDAQ: FLUX)
NEW YORK, Oct. 28, 2024 (GLOBE NEWSWIRE) —
Why: Rosen Law Firm, a global investor rights law firm, continues to investigate potential securities claims on behalf of shareholders of Flux Power Holdings, Inc. FLUX resulting from allegations that Flux Power may have issued materially misleading business information to the investing public.
So What: If you purchased Flux Power securities you may be entitled to compensation without payment of any out of pocket fees or costs through a contingency fee arrangement. The Rosen Law Firm is preparing a class action seeking recovery of investor losses.
What to do next: To join the prospective class action, go to https://rosenlegal.com/submit-form/?case_id=28783 or call Phillip Kim, Esq. toll-free at 866-767-3653 or email case@rosenlegal.com for information on the class action.
What is this about: On September 5, 2024, after the market closed, Flux Power Holdings, Inc. filed a current report on Form 8-K with the SEC, in which it announced “[o]n August 30, 2024, the Board of Directors of Flux Power Holdings, Inc. (the “Company”) including its audit committee members, concluded that the previously issued audited consolidated financial statements as of and for the fiscal year ended June 30, 2023 and the unaudited consolidated financial statements as of and for the quarters ended September 30, 2023, December 31, 2023, and March 31, 2024 (collectively, the “Prior Financial Statements”), which were filed with the Securities and Exchange Commission (“SEC”) on September 21, 2023, November 9, 2023, February 8, 2024 and May 13, 2024, respectively, should no longer be relied upon because of errors in such financial statements relating to the improper accounting for inventory and a restatement should be undertaken.”
On this news, Flux Power’s common stock fell $0.17 per share, or 5.36%, to close at $3.00 per share on September 6, 2024. The next trading day, it fell a further $0.12 per share, or 4%, to close at $2.88 per share on September 9, 2024.
Why Rosen Law: We encourage investors to select qualified counsel with a track record of success in leadership roles. Often, firms issuing notices do not have comparable experience, resources, or any meaningful peer recognition. Many of these firms do not actually litigate securities class actions. Be wise in selecting counsel. The Rosen Law Firm represents investors throughout the globe, concentrating its practice in securities class actions and shareholder derivative litigation. Rosen Law Firm has achieved the largest ever securities class action settlement against a Chinese Company. Rosen Law Firm was Ranked No. 1 by ISS Securities Class Action Services for number of securities class action settlements in 2017. The firm has been ranked in the top 4 each year since 2013 and has recovered hundreds of millions of dollars for investors. In 2019 alone the firm secured over $438 million for investors. In 2020, founding partner Laurence Rosen was named by law360 as a Titan of Plaintiffs’ Bar. Many of the firm’s attorneys have been recognized by Lawdragon and Super Lawyers.
Follow us for updates on LinkedIn: https://www.linkedin.com/company/the-rosen-law-firm, on Twitter: https://twitter.com/rosen_firm or on Facebook: https://www.facebook.com/rosenlawfirm/.
Attorney Advertising. Prior results do not guarantee a similar outcome.
Contact Information:
Laurence Rosen, Esq.
Phillip Kim, Esq.
The Rosen Law Firm, P.A.
275 Madison Avenue, 40th Floor
New York, NY 10016
Tel: (212) 686-1060
Toll Free: (866) 767-3653
Fax: (212) 202-3827
case@rosenlegal.com
www.rosenlegal.com

Market News and Data brought to you by Benzinga APIs
© 2024 Benzinga.com. Benzinga does not provide investment advice. All rights reserved.
Skanska constructs new hospital in Fort Myers, Florida, USA, for USD 435M, about SEK 4.6 billion
STOCKHOLM, Oct. 29, 2024 /PRNewswire/ — Skanska has signed a contract with Lee Health for the construction of a new hospital and medical office building in Fort Myers, Florida, USA. The contract is worth USD 435M, about SEK 4.6 billion, which will be included in the US order bookings for the fourth quarter of 2024.
The project consists of constructing an approximately 38,600 square meter (416,000-square-foot), five story hospital, a central energy plant, and a 11,600 square meter (125,000-square-foot) medical office building which includes an ambulatory surgery center. The project scope includes over a dozen operating rooms, rehabilitation gymnasium and specialty clinics for orthopedics, spine, rheumatology care, and infectious diseases – totaling over 52,000 square meter (560,000 square feet) of exceptional healthcare services.
Utility construction is underway. The project is scheduled for completion in the fourth quarter of 2027.
For further information please contact:
Ashley Jeffery, Communications Manager, Skanska USA, tel +1 813 459 3682
Andreas Joons, Press Officer, Skanska Group, tel +46 76 870 75 51
Direct line for media, tel +46 (0)10 448 88 99
This and previous releases can also be found at www.skanska.com.
This information was brought to you by Cision http://news.cision.com
The following files are available for download:
![]() View original content:https://www.prnewswire.com/news-releases/skanska-constructs-new-hospital-in-fort-myers-florida-usa-for-usd-435m-about-sek-4-6-billion-302289673.html
View original content:https://www.prnewswire.com/news-releases/skanska-constructs-new-hospital-in-fort-myers-florida-usa-for-usd-435m-about-sek-4-6-billion-302289673.html
SOURCE Skanska
Market News and Data brought to you by Benzinga APIs
© 2024 Benzinga.com. Benzinga does not provide investment advice. All rights reserved.
TPG RE Finance Trust Earnings Preview
TPG RE Finance Trust TRTX will release its quarterly earnings report on Tuesday, 2024-10-29. Here’s a brief overview for investors ahead of the announcement.
Analysts anticipate TPG RE Finance Trust to report an earnings per share (EPS) of $0.27.
TPG RE Finance Trust bulls will hope to hear the company announce they’ve not only beaten that estimate, but also to provide positive guidance, or forecasted growth, for the next quarter.
New investors should note that it is sometimes not an earnings beat or miss that most affects the price of a stock, but the guidance (or forecast).
Earnings Track Record
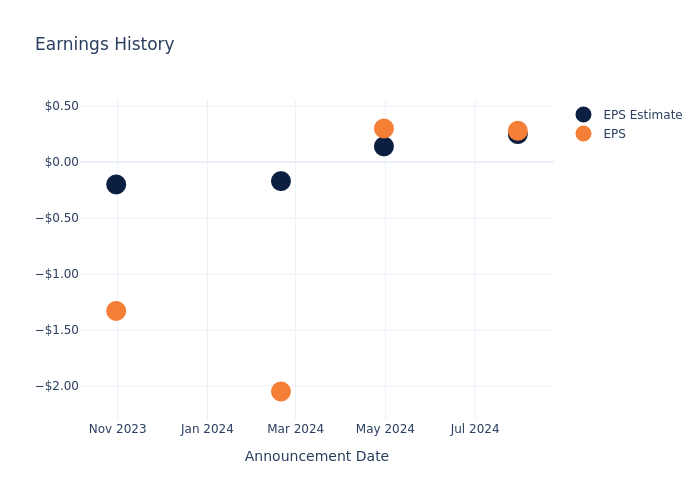
During the last quarter, the company reported an EPS beat by $0.03, leading to a 1.35% drop in the share price on the subsequent day.
Here’s a look at TPG RE Finance Trust’s past performance and the resulting price change:
| Quarter | Q2 2024 | Q1 2024 | Q4 2023 | Q3 2023 |
|---|---|---|---|---|
| EPS Estimate | 0.25 | 0.14 | -0.17 | -0.20 |
| EPS Actual | 0.28 | 0.30 | -2.05 | -1.33 |
| Price Change % | -1.0% | 13.0% | 17.0% | -4.0% |
Stock Performance
Shares of TPG RE Finance Trust were trading at $8.37 as of October 25. Over the last 52-week period, shares are up 53.09%. Given that these returns are generally positive, long-term shareholders are likely bullish going into this earnings release.
To track all earnings releases for TPG RE Finance Trust visit their earnings calendar on our site.
This article was generated by Benzinga’s automated content engine and reviewed by an editor.
Market News and Data brought to you by Benzinga APIs
© 2024 Benzinga.com. Benzinga does not provide investment advice. All rights reserved.
New York's Surprise Ban On Cannabis-Caffeine Products Raises Eyebrows In Industry
New York’s Office of Cannabis Management (OCM) recently ordered a halt to two caffeine-infused THC products by Hudson Cannabis and its brand 1906.
According to the New York Post, the two affected product lines – “Go” and “Genius” – had been on the market since early 2023, marketed for specific benefits.
See Also: That Must Have Hurt: Unlicensed Cannabis Shop Owner Slapped With $9.5M Fine
“Go” was sold as an energy booster containing 80 mg of caffeine, 2 mg of THC, and 5 mg of CBD per dose, while “Genius” was formulated as a cognitive enhancer with 20 mg of caffeine, 2.5 mg of THC, and 5 mg each of CBD and CBG.
The OCM’s quarantine notice, issued in July, claimed the products’ formulations “may jeopardize public health or safety,” with officials stating that “ingredients used in product are not allowed to be used in cannabis products.”
The ruling has raised industry concerns, particularly as these products are legally sold in other states.
Hudson Cannabis Challenges State Ban
Hudson Cannabis is challenging the order, contending that its products are not only compliant with the law but have a proven safety track record.
The pills combine caffeine, THC, CBD, and in the case of “Genius,” the cannabinoid CBG. According to Hudson Cannabis co-founder Melany Dobson, the decision to prohibit these products defies logic. “We are surprised by this decision from the state to quarantine products that have been on the market for over 18 months,” Dobson told The Post, pointing out that the products have “zero reported adverse effects” and are sold legally across multiple states.
Attorney Matthew Schweber of Nuka Enterprises, which owns the 1906 brand, argued that OCM’s stance is both “arbitrary and capricious.” According to Schweber, the OCM is interpreting state regulations in a way that restricts artificially added caffeine while permitting “naturally occurring caffeine” in products like coffee or tea.
“OCM can’t say which prohibition exactly caffeine triggers? Does caffeine increase cannabis’ ‘potency?’ Does it increase its ‘toxicity’ or its ‘addictive potential?’ Does it create ‘an unsafe combination?'” Schweber asked, adding that the regulators had no documented evidence of any risk from combining caffeine and THC.
Mixed Signals On Caffeine In Cannabis Products
The ban has also raised questions among industry insiders regarding regulatory consistency. Competitor products, such as Harney Brothers Cannabis-Infused Nitro Coffee, contain significantly higher levels of caffeine—225 mg per serving—yet face no restrictions.
Osbert Orduna, CEO of The Cannabis Place in Queens, said: “The 1906 products are very popular with all age groups. It’s a big seller. Orduna also explained that these pills have attracted a diverse clientele, including professionals and fitness enthusiasts, due to their convenient, tablet-based form.
Read Next:
Cover image made with AI.
Market News and Data brought to you by Benzinga APIs
© 2024 Benzinga.com. Benzinga does not provide investment advice. All rights reserved.

