A Peek at Janus Intl Gr's Future Earnings
Janus Intl Gr JBI is set to give its latest quarterly earnings report on Tuesday, 2024-10-29. Here’s what investors need to know before the announcement.
Analysts estimate that Janus Intl Gr will report an earnings per share (EPS) of $0.20.
Janus Intl Gr bulls will hope to hear the company announce they’ve not only beaten that estimate, but also to provide positive guidance, or forecasted growth, for the next quarter.
New investors should note that it is sometimes not an earnings beat or miss that most affects the price of a stock, but the guidance (or forecast).
Earnings History Snapshot
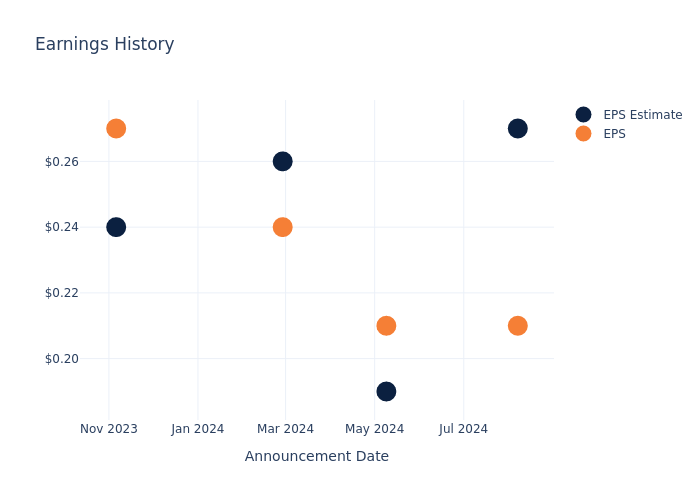
During the last quarter, the company reported an EPS missed by $0.06, leading to a 6.58% drop in the share price on the subsequent day.
Here’s a look at Janus Intl Gr’s past performance and the resulting price change:
| Quarter | Q2 2024 | Q1 2024 | Q4 2023 | Q3 2023 |
|---|---|---|---|---|
| EPS Estimate | 0.27 | 0.19 | 0.26 | 0.24 |
| EPS Actual | 0.21 | 0.21 | 0.24 | 0.27 |
| Price Change % | -7.000000000000001% | -2.0% | 1.0% | 1.0% |

Performance of Janus Intl Gr Shares
Shares of Janus Intl Gr were trading at $10.01 as of October 25. Over the last 52-week period, shares are up 9.94%. Given that these returns are generally positive, long-term shareholders are likely bullish going into this earnings release.
Analysts’ Take on Janus Intl Gr
For investors, staying informed about market sentiments and expectations in the industry is paramount. This analysis provides an exploration of the latest insights on Janus Intl Gr.
A total of 5 analyst ratings have been received for Janus Intl Gr, with the consensus rating being Buy. The average one-year price target stands at $13.2, suggesting a potential 31.87% upside.
Analyzing Analyst Ratings Among Peers
The analysis below examines the analyst ratings and average 1-year price targets of American Woodmark, Quanex Building Prods and Apogee Enterprises, three significant industry players, providing valuable insights into their relative performance expectations and market positioning.
- The consensus outlook from analysts is an Outperform trajectory for American Woodmark, with an average 1-year price target of $110.8, indicating a potential 1006.89% upside.
- The consensus among analysts is an Buy trajectory for Quanex Building Prods, with an average 1-year price target of $38.0, indicating a potential 279.62% upside.
- The prevailing sentiment among analysts is an Neutral trajectory for Apogee Enterprises, with an average 1-year price target of $75.0, implying a potential 649.25% upside.
Key Findings: Peer Analysis Summary
The peer analysis summary provides a snapshot of key metrics for American Woodmark, Quanex Building Prods and Apogee Enterprises, illuminating their respective standings within the industry. These metrics offer valuable insights into their market positions and comparative performance.
| Company | Consensus | Revenue Growth | Gross Profit | Return on Equity |
|---|---|---|---|---|
| Janus Intl Gr | Buy | -8.20% | $109M | 5.06% |
| American Woodmark | Outperform | -7.85% | $92.87M | 3.25% |
| Quanex Building Prods | Buy | -6.44% | $70.90M | 4.37% |
| Apogee Enterprises | Neutral | -3.18% | $97.32M | 6.20% |
Key Takeaway:
Janus Intl Gr ranks at the bottom for Revenue Growth among its peers. It is also at the bottom for Gross Profit. However, it is in the middle for Return on Equity.
About Janus Intl Gr
Janus International Group Inc is a manufacturer and supplier of turnkey solutions for self-storage, commercial, and industrial building Solutions. The company provides products that include roll-up and swing doors, hallway systems, relocatable storage MASS (Moveable Additional Storage Structures) units, and technologies for automating facility and door operation. It is operated through two geographic regions; Janus North America and Janus International. . The Janus International segment is comprised of Janus International Europe Holdings Ltd whose production and sales are largely in Europe and Australia. The Janus North America segment is comprised of all the other entities including Janus Core together with each of its operating subsidiaries, Betco, Inc.
Key Indicators: Janus Intl Gr’s Financial Health
Market Capitalization Analysis: Positioned below industry benchmarks, the company’s market capitalization faces constraints in size. This could be influenced by factors such as growth expectations or operational capacity.
Decline in Revenue: Over the 3 months period, Janus Intl Gr faced challenges, resulting in a decline of approximately -8.2% in revenue growth as of 30 June, 2024. This signifies a reduction in the company’s top-line earnings. As compared to its peers, the revenue growth lags behind its industry peers. The company achieved a growth rate lower than the average among peers in Industrials sector.
Net Margin: Janus Intl Gr’s net margin surpasses industry standards, highlighting the company’s exceptional financial performance. With an impressive 11.11% net margin, the company effectively manages costs and achieves strong profitability.
Return on Equity (ROE): Janus Intl Gr’s financial strength is reflected in its exceptional ROE, which exceeds industry averages. With a remarkable ROE of 5.06%, the company showcases efficient use of equity capital and strong financial health.
Return on Assets (ROA): The company’s ROA is a standout performer, exceeding industry averages. With an impressive ROA of 2.06%, the company showcases effective utilization of assets.
Debt Management: With a high debt-to-equity ratio of 1.08, Janus Intl Gr faces challenges in effectively managing its debt levels, indicating potential financial strain.
To track all earnings releases for Janus Intl Gr visit their earnings calendar on our site.
This article was generated by Benzinga’s automated content engine and reviewed by an editor.
© 2024 Benzinga.com. Benzinga does not provide investment advice. All rights reserved.
Bitcoin Breaks $70K, Ethereum and Dogecoin Rise Amid Stock Rally Ahead Of 'Mag 7' Earnings: Analyst Says Current Spike Driven By 'Binance Whales'
Leading cryptocurrencies surged Monday, with Bitcoin breaking through $70,000 after an almost five-month hiatus.
| Cryptocurrency | Gains +/- | Price (Recorded at 8:30 p.m. EDT) |
| Bitcoin BTC/USD | +2.66% | $69,676.63 |
| Ethereum ETH/USD |
+1.26% | $2,535.14 |
| Dogecoin DOGE/USD | +14.54% | $0.1641 |
What Happened: The world’s largest cryptocurrency breached the elusive level late evening, building on the positive momentum from the weekend. In intraday trading, BTC hit a high of $70,212.27, according to data from CoinMarketCap. It is pertinent to mention that the apex coin is currently trading almost 5.3% below its all-time high of $73,750.07 which it touched eight months ago on March 14, 2024.
Ethereum also sailed to $2,585 after shifting sideways for the early part of the day.
The latest surge boosted Bitcoin’s monthly gains to more than 10%, raising expectations from a month that has previously witnessed 21% gains on average.
The rally erased over $100 million in downside bets in the last 24 hours, with total liquidations exceeding $172 million.
Bitcoin’s Open Interest blasted 7.03% in the last 24 hours, implying heightened speculative interest.
The number of traders longing the leading cryptocurrency beat those betting against it by a factor of 1.07, as per the Longs/Shorts Ratio.
Market sentiment remained in the “Greed” zone, according to the Cryptocurrency Fear & Greed Index.
Top Gainers (24-Hours)
| Cryptocurrency | Gains +/- | Price (Recorded at 8:30 p.m. EDT) |
| Dogecoin (DOGE) | +14.48% | $0.1641 |
| THORChain (RUNE) | +12.30% | $5.98 |
| Bitcoin SV (BSV) | +8.68% | $50.18 |
The global cryptocurrency market cap stood at $2.35 trillion, following an increase of 1.98% in the last 24 hours.
Like cryptocurrencies, stocks started the fresh trading week on a high. The Dow Jones Industrial Average popped 273.17 points, or 0.65%, to close at 42,387.57. The broad-based index S&P 500 added 0.27% to end at 5,823.52, while the tech-focused Nasdaq Composite gained 0.26% to finish at record highs of 18,567.19.
Investors were looking forward to a busy week of third-quarter earnings as five out of the “Magnificent 7” were set to report their numbers later this week.
See More: Best Cryptocurrency Scanners
Analyst Notes: Popular cryptocurrency analyst Rekt Capital noted Bitcoin’s breakout from the months-long bull flag.
“The only condition for the breakout to be fully confirmed is for the price to remain above $69000 for the rest of the week,” said the analyst.
On-chain analytics firm CryptoQuant attributed Bitcoin’s ongoing pump to heightened activity on cryptocurrency exchange Binance.
Analysis showed that Coinbase Premium, an indicator of U.S. institutional buying power, decreased alongside Bitcoin’s price rise.
“This phenomenon is clearly driven by Binance whales involvement,” CryptoQuant added.
Image via Shutterstock
Read Next:
Market News and Data brought to you by Benzinga APIs
© 2024 Benzinga.com. Benzinga does not provide investment advice. All rights reserved.
Examining the Future: Alignment Healthcare's Earnings Outlook
Alignment Healthcare ALHC is set to give its latest quarterly earnings report on Tuesday, 2024-10-29. Here’s what investors need to know before the announcement.
Analysts estimate that Alignment Healthcare will report an earnings per share (EPS) of $-0.14.
The market awaits Alignment Healthcare’s announcement, with hopes high for news of surpassing estimates and providing upbeat guidance for the next quarter.
It’s important for new investors to understand that guidance can be a significant driver of stock prices.
Earnings Track Record
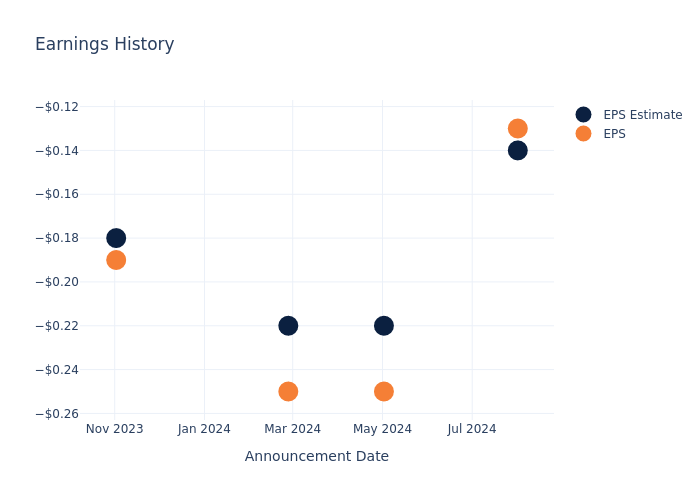
In the previous earnings release, the company beat EPS by $0.01, leading to a 3.71% increase in the share price the following trading session.
Here’s a look at Alignment Healthcare’s past performance and the resulting price change:
| Quarter | Q2 2024 | Q1 2024 | Q4 2023 | Q3 2023 |
|---|---|---|---|---|
| EPS Estimate | -0.14 | -0.22 | -0.22 | -0.18 |
| EPS Actual | -0.13 | -0.25 | -0.25 | -0.19 |
| Price Change % | 4.0% | 26.0% | -18.0% | -5.0% |

Stock Performance
Shares of Alignment Healthcare were trading at $11.04 as of October 25. Over the last 52-week period, shares are up 65.41%. Given that these returns are generally positive, long-term shareholders should be satisfied going into this earnings release.
Analyst Views on Alignment Healthcare
Understanding market sentiments and expectations within the industry is crucial for investors. This analysis delves into the latest insights on Alignment Healthcare.
The consensus rating for Alignment Healthcare is Outperform, based on 4 analyst ratings. With an average one-year price target of $9.5, there’s a potential 13.95% downside.
Analyzing Ratings Among Peers
In this analysis, we delve into the analyst ratings and average 1-year price targets of Clover Health Investments, Progyny and HealthEquity, three key industry players, offering insights into their relative performance expectations and market positioning.
- For Clover Health Investments, analysts project an Neutral trajectory, with an average 1-year price target of $4.0, indicating a potential 63.77% downside.
- The consensus among analysts is an Outperform trajectory for Progyny, with an average 1-year price target of $27.07, indicating a potential 145.2% upside.
- The consensus among analysts is an Outperform trajectory for HealthEquity, with an average 1-year price target of $102.14, indicating a potential 825.18% upside.
Key Findings: Peer Analysis Summary
In the peer analysis summary, key metrics for Clover Health Investments, Progyny and HealthEquity are highlighted, providing an understanding of their respective standings within the industry and offering insights into their market positions and comparative performance.
| Company | Consensus | Revenue Growth | Gross Profit | Return on Equity |
|---|---|---|---|---|
| Alignment Healthcare | Outperform | 47.34% | $75.97M | -18.86% |
| Clover Health Investments | Neutral | 11.28% | $107.91M | 2.40% |
| Progyny | Outperform | 8.85% | $68.28M | 3.21% |
| HealthEquity | Outperform | 23.15% | $204.05M | 1.68% |
Key Takeaway:
Alignment Healthcare ranks at the bottom for Revenue Growth among its peers. It also has the lowest Gross Profit margin. However, it has the highest Return on Equity.
Discovering Alignment Healthcare: A Closer Look
Alignment Healthcare Inc is a next-generation, consumer-centric platform that is revolutionizing the healthcare experience for seniors through Medicare Advantage plans. These plans are marketed and sold direct-to-consumer, allowing seniors to select the manner in which customers receive healthcare coverage and services on an annual basis. The company combines a technology platform and clinical model for more effective health outcomes.
Alignment Healthcare: Delving into Financials
Market Capitalization Analysis: Falling below industry benchmarks, the company’s market capitalization reflects a reduced size compared to peers. This positioning may be influenced by factors such as growth expectations or operational capacity.
Positive Revenue Trend: Examining Alignment Healthcare’s financials over 3 months reveals a positive narrative. The company achieved a noteworthy revenue growth rate of 47.34% as of 30 June, 2024, showcasing a substantial increase in top-line earnings. As compared to competitors, the company surpassed expectations with a growth rate higher than the average among peers in the Health Care sector.
Net Margin: Alignment Healthcare’s net margin is below industry averages, indicating potential challenges in maintaining strong profitability. With a net margin of -3.52%, the company may face hurdles in effective cost management.
Return on Equity (ROE): Alignment Healthcare’s ROE falls below industry averages, indicating challenges in efficiently using equity capital. With an ROE of -18.86%, the company may face hurdles in generating optimal returns for shareholders.
Return on Assets (ROA): Alignment Healthcare’s ROA lags behind industry averages, suggesting challenges in maximizing returns from its assets. With an ROA of -3.56%, the company may face hurdles in achieving optimal financial performance.
Debt Management: With a high debt-to-equity ratio of 1.78, Alignment Healthcare faces challenges in effectively managing its debt levels, indicating potential financial strain.
To track all earnings releases for Alignment Healthcare visit their earnings calendar on our site.
This article was generated by Benzinga’s automated content engine and reviewed by an editor.
Market News and Data brought to you by Benzinga APIs
© 2024 Benzinga.com. Benzinga does not provide investment advice. All rights reserved.
Ford, AMD, Trump Media, Microstrategy, And Tesla: Why These 5 Stocks Are On Investors' Radars Today
U.S. stocks witnessed an upward trend as trading approached its end on Monday. The Dow Jones index saw an increase of over 270 points. The Dow traded up 0.65% to 42387.57, while the NASDAQ rose 0.3% to 18,567.19. The S&P 500 also experienced a rise, gaining 0.3% to 5,823.52.
These are the top stocks that gained the attention of retail traders and investors throughout the day:
Ford Motor Company F
Ford’s shares closed at $11.37, up 2.71% for the day. The stock’s intraday high was $11.39, with a low of $11.12. The 52-week high and low stand at $14.85 and $9.49 respectively. Ford reported a third-quarter revenue of $46.2 billion, surpassing the consensus estimate of $41.88 billion. The Detroit-based automaker also reported quarterly earnings of 49 cents per share, beating estimates of 47 cents per share.
Advanced Micro Devices, Inc. AMD
AMD’s shares ended the day at $159.92, up 2.36%. The stock’s intraday high and low were $160.28 and $157.04 respectively, with a 52-week high and low of $227.3 and $94.07. AMD is set to report its third-quarter earnings on Wednesday, with Wall Street expecting 92 cents in EPS and $6.71 billion in revenues.
Trump Media & Technology Group DJT
Trump Media & Technology Group’s shares closed at $47.36, up 21.59%. The Donald Trump-linked stock’s intraday high and low were $47.68 and $41.25 respectively, with a 52-week high and low of $79.38 and $22.55. The stock is seeing a massive rally despite its lack of financial fundamentals.
MicroStrategy Incorporated MSTR
MicroStrategy’s shares closed at $255.34, up 8.96%. The stock’s intraday high and low were $259.5 and $242.77 respectively, with a 52-week high and low of $259.5 and $41. MicroStrategy ended Friday as the sixth-most traded stock on Wall Street. Notably on Monday, Bitcoin BTC/USD, the world’s largest cryptocurrency by market cap, crossed the psychologically important $70,000 threshold.
Tesla, Inc. TSLA
Tesla’s shares closed at $262.51, down 2.48%. The stock’s intraday high and low were $273.54 and $262.24 respectively, with a 52-week high and low of $273.54 and $138.8. Tesla can deploy fast charging for its Semi truck at about $500/kW given its experience in developing and deploying charging infrastructure.
Image via Shutterstock
Prepare for the day’s trading with top premarket movers and news by Benzinga.
Read Next:
This story was generated using Benzinga Neuro and edited by Shivdeep Dhaliwal
Market News and Data brought to you by Benzinga APIs
© 2024 Benzinga.com. Benzinga does not provide investment advice. All rights reserved.
Preview: Skyward Specialty's Earnings
Skyward Specialty SKWD will release its quarterly earnings report on Tuesday, 2024-10-29. Here’s a brief overview for investors ahead of the announcement.
Analysts anticipate Skyward Specialty to report an earnings per share (EPS) of $0.65.
Anticipation surrounds Skyward Specialty’s announcement, with investors hoping to hear about both surpassing estimates and receiving positive guidance for the next quarter.
New investors should understand that while earnings performance is important, market reactions are often driven by guidance.
Earnings Track Record
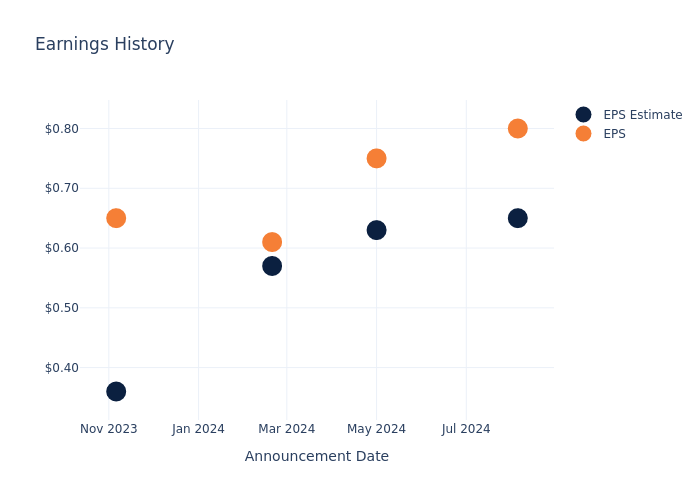
In the previous earnings release, the company beat EPS by $0.15, leading to a 1.84% drop in the share price the following trading session.
Here’s a look at Skyward Specialty’s past performance and the resulting price change:
| Quarter | Q2 2024 | Q1 2024 | Q4 2023 | Q3 2023 |
|---|---|---|---|---|
| EPS Estimate | 0.65 | 0.63 | 0.57 | 0.36 |
| EPS Actual | 0.80 | 0.75 | 0.61 | 0.65 |
| Price Change % | -2.0% | 1.0% | -1.0% | 10.0% |
Stock Performance
Shares of Skyward Specialty were trading at $45.51 as of October 25. Over the last 52-week period, shares are up 63.84%. Given that these returns are generally positive, long-term shareholders should be satisfied going into this earnings release.
Analysts’ Perspectives on Skyward Specialty
Understanding market sentiments and expectations within the industry is crucial for investors. This analysis delves into the latest insights on Skyward Specialty.
Analysts have provided Skyward Specialty with 7 ratings, resulting in a consensus rating of Outperform. The average one-year price target stands at $48.14, suggesting a potential 5.78% upside.
Comparing Ratings with Competitors
In this comparison, we explore the analyst ratings and average 1-year price targets of and Trupanion, three prominent industry players, offering insights into their relative performance expectations and market positioning.
Comprehensive Peer Analysis Summary
The peer analysis summary offers a detailed examination of key metrics for and Trupanion, providing valuable insights into their respective standings within the industry and their market positions and comparative performance.
| Company | Consensus | Revenue Growth | Gross Profit | Return on Equity |
|---|---|---|---|---|
| Trupanion | Neutral | 16.35% | $40.27M | -1.92% |
Key Takeaway:
Skyward Specialty ranks at the bottom for Revenue Growth among its peers. It also ranks at the bottom for Gross Profit. However, it is in the middle for Return on Equity. The consensus rating for Skyward Specialty is not provided in the data.
Unveiling the Story Behind Skyward Specialty
Skyward Specialty Insurance Group Inc is a specialty insurance company that delivers commercial property and casualty products and solutions on a non-admitted and admitted basis. The firm has one reportable segment through which it offers a broad array of insurance coverages to several market niches. It operates multiple lines of business, including general liability, excess liability, professional liability, commercial auto, group accident, health, property, surety, and workers’ compensation.
Breaking Down Skyward Specialty’s Financial Performance
Market Capitalization Analysis: Positioned below industry benchmarks, the company’s market capitalization faces constraints in size. This could be influenced by factors such as growth expectations or operational capacity.
Positive Revenue Trend: Examining Skyward Specialty’s financials over 3 months reveals a positive narrative. The company achieved a noteworthy revenue growth rate of 30.42% as of 30 June, 2024, showcasing a substantial increase in top-line earnings. In comparison to its industry peers, the company stands out with a growth rate higher than the average among peers in the Financials sector.
Net Margin: Skyward Specialty’s net margin excels beyond industry benchmarks, reaching 11.17%. This signifies efficient cost management and strong financial health.
Return on Equity (ROE): Skyward Specialty’s ROE stands out, surpassing industry averages. With an impressive ROE of 4.37%, the company demonstrates effective use of equity capital and strong financial performance.
Return on Assets (ROA): The company’s ROA is a standout performer, exceeding industry averages. With an impressive ROA of 0.94%, the company showcases effective utilization of assets.
Debt Management: The company maintains a balanced debt approach with a debt-to-equity ratio below industry norms, standing at 0.16.
To track all earnings releases for Skyward Specialty visit their earnings calendar on our site.
This article was generated by Benzinga’s automated content engine and reviewed by an editor.
Market News and Data brought to you by Benzinga APIs
© 2024 Benzinga.com. Benzinga does not provide investment advice. All rights reserved.
JPMorgan Sues Customers Over 'Infinite Money Glitch' That Went Viral On TikTok: 'They're Held Accountable'
JPMorgan Chase & Co JPM has initiated legal action against customers who allegedly exploited a technical flaw to withdraw funds from ATMs before checks bounced.
What Happened: The bank has filed lawsuits in three federal courts, targeting individuals who made the largest withdrawals during the ‘infinite money glitch’ that gained attention on social media platforms like TikTok in late August, CNBC reported on Monday.
One such case in Houston involves a man who owes JPMorgan $290,939.47 after an unidentified accomplice deposited a counterfeit $335,000 check at an ATM. The bank alleges that the man began withdrawing the majority of the funds after the check was deposited.
“We’re pursuing these cases and actively cooperating with law enforcement to make sure if someone is committing fraud against Chase and its customers, they’re held accountable,” JPMorgan spokesman Drew Pusateri said, according to the report.
Why It Matters: JPMorgan, the largest U.S. bank by assets, is investigating thousands of potential cases related to the ‘infinite money glitch.’ The bank has not disclosed the extent of the associated losses.
Despite the decreasing use of paper checks, they remain a significant avenue for fraud, resulting in $26.6 billion in global losses last year, according to Nasdaq’s Global Financial Crime Report.
On the regulatory front, JPMorgan’s CEO, Jamie Dimon, delivered a sharp critique of recent regulatory efforts, calling for banks to take a firmer stance against rules he believes are misguided. Speaking at an American Bankers Association conference, Dimon argued that overlapping regulations have created an unfair playing field, leading to unjust penalties for financial institutions.
Read Next:
Image Via Shutterstock
This story was generated using Benzinga Neuro and edited by Kaustubh Bagalkote
Market News and Data brought to you by Benzinga APIs
© 2024 Benzinga.com. Benzinga does not provide investment advice. All rights reserved.
Allarity Therapeutics, Inc. Investors: Please contact the Portnoy Law Firm to recover your losses. November 12, 2024 Deadline to file Lead Plaintiff Motion.
LOS ANGELES, Oct. 28, 2024 (GLOBE NEWSWIRE) — The Portnoy Law Firm advises Allarity Therapeutics, Inc. (“Allarity” or the “Company”) ALLR investors of a class action representing investors that bought securities between May 17, 2022, and July 19, 2024, inclusive (the “Class Period”). Allarity investors have until November 12, 2024 to file a lead plaintiff motion.
Investors are encouraged to contact attorney Lesley F. Portnoy, by phone 310-692-8883 or email: lesley@portnoylaw.com, to discuss their legal rights, or click here to join the case. The Portnoy Law Firm can provide a complimentary case evaluation and discuss investors’ options for pursuing claims to recover their losses.
The Complaint asserts that, throughout the Class Period, the Defendants issued materially false and misleading statements concerning the Company’s business practices, operations, and adherence to compliance policies. Specifically, it contends that the Defendants inflated the ongoing regulatory prospects of the Dovitinib NDA and engaged in illegal, illicit, or otherwise improper conduct related to the Dovitinib NDA and/or the Dovitinib-DRP PMA, involving Allarity and three of its former officers. This misconduct exposed the Company to heightened risks of regulatory and governmental scrutiny, enforcement actions, and significant legal, financial, and reputational damages. Following the disclosure that Allarity was under investigation for wrongdoing related to the Dovitinib NDA and/or Dovitinib-DRP PMA, the Company downplayed the likelihood of an enforcement action resulting from the investigation. As a result, the Company’s public statements were materially false and misleading throughout the relevant period.
Please visit our website to review more information and submit your transaction information.
The Portnoy Law Firm represents investors in pursuing claims against caused by corporate wrongdoing. The Firm’s founding partner has recovered over $5.5 billion for aggrieved investors. Attorney advertising. Prior results do not guarantee similar outcomes.
Lesley F. Portnoy, Esq.
Admitted CA and NY Bar
lesley@portnoylaw.com
310-692-8883
www.portnoylaw.com
Attorney Advertising

Market News and Data brought to you by Benzinga APIs
© 2024 Benzinga.com. Benzinga does not provide investment advice. All rights reserved.
Safehold Reports Third Quarter 2024 Results
NEW YORK, Oct. 28, 2024 /PRNewswire/ — Safehold Inc. SAFE reported results for the third quarter 2024.
SAFE published a presentation detailing these results which can be found on its website, www.safeholdinc.com in the “Investors” section.
Highlights from the earnings announcement include:
- Q3’24 revenue was $90.7 million
- Q3’24 net income attributable to common shareholders was $19.3 million, or $26.1 million excluding the portion of the quarter’s non-cash general provision for credit losses on prior period balances1
- Q3’24 earnings per share was $0.27, or $0.37 excluding the portion of the quarter’s non-cash general provision for credit losses on prior period balances1
- Closed $104 million of new originations in Q3’24, including three new ground leases for $72 million2 and one leasehold loan for $32 million3
- Purchased joint venture partner’s ownership interest in all ground leases acquired by the venture to date for a total commitment of $69 million4
“This was a productive quarter for Safehold, supplementing new originations with an opportunistic joint venture buyout that is expected to grow earnings and further diversify the portfolio,” said Jay Sugarman, Chairman and Chief Executive Officer. “While rate volatility remains disruptive to real estate and transaction activity, we’re seeing positive trends in certain markets and are well-positioned to capitalize on opportunities and best serve our customers.”
The Company will host an earnings conference call reviewing this presentation beginning at 9:00 a.m. ET on Tuesday, October 29, 2024. This conference call will be broadcast live and can be accessed by all interested parties through Safehold’s website and by using the dial-in information listed below:
|
Dial-In: |
877.545.0523 |
|
International: |
973.528.0016 |
|
Access Code: |
161168 |
A replay of the call will be archived on the Company’s website. Alternatively, the replay can be accessed via dial-in from 2:00 p.m. ET on October 29, 2024 through 12:00 a.m. ET on November 12, 2024 by calling:
|
Replay: |
877.481.4010 |
|
International: |
919.882.2331 |
|
Access Code: |
51479 |
Non-GAAP Financial Measures:
Net income attributable to Safehold Inc. common shareholders excluding general provision for credit losses on prior period balances, and EPS excluding general provision for credit losses on prior period balances, are non-GAAP measures used as supplemental performance measures to give management and investors a view of net income and EPS more directly derived from operating activities in the period in which they occur. It should be examined in conjunction with net income attributable to common shareholders as shown in our consolidated statements of operations. EPS excluding general provision for credit losses on prior period balances is calculated as net income attributable to Safehold Inc. common shareholders excluding general provision for credit losses on prior period balances, divided by the weighted average number of common shares. These metrics should not be considered as alternatives to net income attributable to common shareholders or EPS, respectively (in each case determined in accordance with generally accepted accounting principles in the United States of America (“GAAP”)). These measures may differ from similarly-titled measures used by other companies. Reconciliations of these non-GAAP financial measures to their most directly comparable GAAP financial measures are presented below.
|
Earnings Reconciliation (all figures in thousands except per share figures) |
|||
|
Net income attributable to Safehold Inc. common shareholders |
$19,331 |
||
|
Add: General provision for credit losses on prior period balances1 |
6,804 |
||
|
Net income attributable to Safehold Inc. common shareholders excluding general |
$26,135 |
||
|
Weighted average number of common shares – basic |
71,436 |
||
|
Weighted average number of common shares – diluted |
71,540 |
||
|
EPS excluding general provision for credit losses on prior period balances (basic & |
$0.37 |
||
|
1 Includes general provision for credit losses on prior period balances of $6.6m on consolidated assets and $0.2m on |
|||
About Safehold:
Safehold Inc. SAFE is revolutionizing real estate ownership by providing a new and better way for owners to unlock the value of the land beneath their buildings. Having created the modern ground lease industry in 2017, Safehold continues to help owners of high quality multifamily, office, industrial, hospitality, student housing, life science and mixed-use properties generate higher returns with less risk. The Company, which is taxed as a real estate investment trust (REIT), seeks to deliver safe, growing income and long-term capital appreciation to its shareholders. Additional information on Safehold is available on its website at www.safeholdinc.com.
Company Contact:
Pearse Hoffmann
Senior Vice President
Capital Markets & Investor Relations
T 212.930.9400
E investors@safeholdinc.com
1 The Company electively enhanced its general provision for credit losses methodology during the quarter, and applied the updated methodology to prior period balances in accordance with GAAP. Of the quarter’s $7.5 million total non-cash general provision for credit losses expense, $6.8 million represents the expense related to prior period balances. See the Company’s Quarterly Report on Form 10-Q for the quarter ended September 30, 2024 for additional information.
2 Gross of joint venture partner’s 45% participation in one new investment in the third quarter in the amount of $10.7m. $72m total commitments includes $19m of forward commitments that have not yet been funded as of 9/30/24. Such funding commitments are subject to certain conditions. There can be no assurance that Safehold will fully fund these transactions.
3 Gross of leasehold loan partner’s 47% participation interest. The leasehold loan did not fund during the third quarter and there can be no assurance that Safehold will fully fund its commitment.
4 Gross purchase price of $80 million for 9 ownership interests within the joint venture, including forward commitments and purchase premium. The $69 million net purchase price excludes one investment that was originated early in the third quarter and is included within the new originations metrics.
![]() View original content to download multimedia:https://www.prnewswire.com/news-releases/safehold-reports-third-quarter-2024-results-302288937.html
View original content to download multimedia:https://www.prnewswire.com/news-releases/safehold-reports-third-quarter-2024-results-302288937.html
SOURCE Safehold
Market News and Data brought to you by Benzinga APIs
© 2024 Benzinga.com. Benzinga does not provide investment advice. All rights reserved.

