Centerspace Reports Third Quarter 2024 Financial Results and Raises Mid-Point for 2024 Core FFO per Share Guidance
MINNEAPOLIS, Oct. 28, 2024 /PRNewswire/ — Centerspace CSR announced today its financial and operating results for the three and nine months ended September 30, 2024. The tables below show Net Income (Loss), Funds from Operations (“FFO”)1, and Core FFO1, all on a per diluted share basis, for the three and nine months ended September 30, 2024; Same-Store Revenues, Expenses, and Net Operating Income (“NOI”)1 over comparable periods; along with Same-Store Weighted-Average Occupancy and leasing rates for each of the three and applicable nine months ended September 30, 2024, June 30, 2024, and September 30, 2023.
|
Three Months Ended September 30, |
Nine Months Ended September 30, |
|||||||
|
Per Common Share |
2024 |
2023 |
2024 |
2023 |
||||
|
Net income (loss) – diluted |
$ (0.40) |
$ 0.41 |
$ (0.96) |
$ 2.96 |
||||
|
FFO – diluted(1) |
$ 1.01 |
$ 1.15 |
$ 3.40 |
$ 3.15 |
||||
|
Core FFO – diluted(1) |
$ 1.18 |
$ 1.20 |
$ 3.68 |
$ 3.56 |
||||
|
Year-Over-Year Comparison |
Sequential Comparison |
YTD Comparison |
||||
|
Same-Store Results(2) |
Q3 2024 vs. Q3 2023 |
Q3 2024 vs. Q2 2024 |
2024 vs. 2023 |
|||
|
Revenues |
3.0 % |
— % |
3.3 % |
|||
|
Expenses |
3.2 % |
5.8 % |
2.0 % |
|||
|
NOI(1) |
2.8 % |
(3.7) % |
4.2 % |
|
Three months ended |
Nine months ended |
|||||||||
|
Same-Store Results(2) |
September 30, |
June 30, 2024 |
September 30, |
September 30, |
September 30, |
|||||
|
Weighted Average Occupancy |
95.3 % |
95.3 % |
94.6 % |
95.1 % |
94.9 % |
|||||
|
New Lease Rate Growth |
(1.2) % |
3.6 % |
2.0 % |
0.8 % |
3.1 % |
|||||
|
Renewal Lease Rate Growth |
3.2 % |
3.6 % |
4.7 % |
3.3 % |
4.9 % |
|||||
|
Blended Lease Rate Growth (3) |
1.5 % |
3.6 % |
3.6 % |
2.2 % |
4.0 % |
|||||
|
(1) |
NOI, FFO, and Core FFO are non-GAAP financial measures. For more information on their usage and presentation, and a |
|
(2) |
Same-store results are updated for disposition activity. Refer to “Non-GAAP Financial Measures and Reconciliations” in |
|
(3) |
Blended lease rate growth is weighted by lease count. |
Highlights for the Third Quarter and Year-to-Date
- Centerspace raised the mid-point and narrowed the 2024 financial outlook ranges for net loss per diluted share and Core FFO per diluted share. Refer to page S-17 in the Supplemental and Financial Operating Data within for additional detail;
- Centerspace issued approximately 1.5 million common shares for net consideration of $105.1 million, and an average price of $71.12 per share during the third quarter of 2024 under its at-the-market offering program and used the proceeds to redeem all of its outstanding Series C preferred shares for $97.0 million, which had a distribution equal to 6.625%;
- Net loss was $0.40 per diluted share for the third quarter of 2024, compared to net income of $0.41 per diluted share for the same period of the prior year;
- Core FFO per diluted share increased 3.4% to $3.68 for the nine months ended September 30, 2024, compared to $3.56 for the nine months ended September 30, 2023; and
- Same-store revenues increased by 3.0% for the third quarter of 2024 compared to the third quarter of 2023, driving a 2.8% increase in same-store NOI compared to the same period of the prior year.
Balance Sheet
At the end of the third quarter, Centerspace had $235.5 million of total liquidity on its balance sheet, consisting of $221.0 million available under the lines of credit and cash and cash equivalents of $14.5 million.
Updated 2024 Financial Outlook
Centerspace updated its 2024 financial outlook. For additional information, see S-17 of the Supplemental Financial and Operating Data for the quarter ended September 30, 2024 included at the end of this release. These ranges should be considered in their entirety. The table below reflects the updated outlook.
|
Previous Outlook for 2024 |
Updated Outlook for 2024 |
|||
|
Low |
High |
Low |
High |
|
|
Net income per Share – diluted |
$(1.21) |
$(1.01) |
$(1.21) |
$(1.06) |
|
Same-Store Revenue |
3.25 % |
4.25 % |
3.00 % |
3.50 % |
|
Same-Store Expenses |
3.50 % |
4.75 % |
2.50 % |
3.25 % |
|
Same-Store NOI |
3.00 % |
4.00 % |
3.25 % |
3.75 % |
|
FFO per Share – diluted |
$4.61 |
$4.76 |
$4.50 |
$4.59 |
|
Core FFO per Share – diluted |
$4.78 |
$4.92 |
$4.82 |
$4.90 |
Additional assumptions:
- Same-store recurring capital expenditures of $1,100 per home to $1,150 per home
- Value-add expenditures of $23.0 million to $25.0 million
Note: FFO and Core FFO are non-GAAP financial measures. For more information on their usage and presentation and a reconciliation to the most comparable GAAP measure, please refer to “2024 Financial Outlook” in the Supplemental Financial and Operating Data within.
Subsequent Events
On October 1, 2024, Centerspace closed on the acquisition of The Lydian in Denver, CO, for total consideration of $54.0 million. The acquisition was financed through the assumption of mortgage debt, issuance of common operating partnership units, and cash.
Upcoming Events
Centerspace is scheduled to participate in Nareit’s REITworld conference in Las Vegas, NV, November 18-21.
Earnings Call
|
Live webcast and replay: https://ir.centerspacehomes.com |
||||
|
Live Conference Call |
Conference Call Replay |
|||
|
Tuesday, October 29, 2024, at 10:00 AM ET |
Replay available until November 12, 2024 |
|||
|
USA Toll Free |
1-833-470-1428 |
USA Toll Free |
1-866-813-9403 |
|
|
International |
1-404-975-4839 |
International |
1-929-458-6194 |
|
|
Canada Toll Free |
1-833-950-0062 |
|||
|
Access Code |
050510 |
Access Code |
581939 |
|
Supplemental Information
Supplemental Operating and Financial Data for the quarter ended September 30, 2024 included herein (“Supplemental Information”), is available in the Investors section on Centerspace’s website at www.centerspacehomes.com or by calling Investor Relations at 952-401-6600. Non-GAAP financial measures and other capitalized terms, as used in this earnings release, are defined and reconciled in the Supplemental Financial and Operating Data, which accompanies this earnings release.
About Centerspace
Centerspace is an owner and operator of apartment communities committed to providing great homes by focusing on integrity and serving others. Founded in 1970, as of September 30, 2024, Centerspace owned interests in 70 apartment communities consisting of 12,883 apartment homes located in Colorado, Minnesota, Montana, Nebraska, North Dakota, and South Dakota. Centerspace was named a top workplace for the fifth consecutive year in 2024 by the Minneapolis Star Tribune. For more information, please visit www.centerspacehomes.com.
Forward-Looking Statements
Certain statements in this press release and the accompanying Supplemental Operating and Financial Data are based on the company’s current expectations and assumptions, and are “forward-looking statements” within the meaning of Section 27A of the Securities Act of 1933, as amended, and Section 21E of the Securities Exchange Act of 1934, as amended. Forward-looking statements do not discuss historical fact, but instead include statements related to expectations, projections, intentions or other items related to the future. Forward-looking statements are typically identified by the use of terms such as “expects,” “anticipates,” “intends,” “plans,” “believes,” “seeks,” “estimates,” “will,” “assumes,” “may,” “projects,” “outlook,” “future,” and variations of such words and similar expressions. These forward-looking statements involve known and unknown risks, uncertainties, and other factors that may cause the actual results, performance, or achievements to be materially different from the results of operations, financial conditions, or plans expressed or implied by the forward-looking statements. Although the company believes the expectations reflected in its forward-looking statements are based upon reasonable assumptions, it can give no assurance that the expectations will be achieved. Any statements contained herein that are not statements of historical fact should be deemed forward-looking statements. As a result, reliance should not be placed on these forward-looking statements, as these statements are subject to known and unknown risks, uncertainties, and other factors beyond the company’s control and could differ materially from actual results and performance. Such risks, uncertainties, and other factors that might cause such differences include, but are not limited to those risks and uncertainties detailed from time to time in Centerspace’s filings with the Securities and Exchange Commission, including the “Management’s Discussion and Analysis of Financial Condition and Results of Operations” and “Risk Factors” contained in its Annual Report on Form 10-K for the year ended December 31, 2023, in its subsequent quarterly reports on Form 10-Q, and in other public reports. The company assumes no obligation to update or supplement forward-looking statements that become untrue due to subsequent events.
Contact Information
Investor Relations
Josh Klaetsch
Phone: 952-401-6600
Email: IR@centerspacehomes.com
Marketing & Media
Kelly Weber
Phone: 952-401-6600
Email: kweber@centerspacehomes.com
![]() View original content to download multimedia:https://www.prnewswire.com/news-releases/centerspace-reports-third-quarter-2024-financial-results-and-raises-mid-point-for-2024-core-ffo-per-share-guidance-302288961.html
View original content to download multimedia:https://www.prnewswire.com/news-releases/centerspace-reports-third-quarter-2024-financial-results-and-raises-mid-point-for-2024-core-ffo-per-share-guidance-302288961.html
SOURCE Centerspace
© 2024 Benzinga.com. Benzinga does not provide investment advice. All rights reserved.
Ford Q3 Earnings: Revenue Beat, EPS Beat, EV Sales Down 33%, Updated Outlook, Shares Slide
Ford Motor Co F reported financial results for the third quarter after the market close on Monday. Here’s a look at the key metrics from the quarter.
Q3 Earnings: Ford reported third-quarter revenue of $46.2 billion, beating the consensus estimate of $41.88 billion, according to Benzinga Pro. The Detroit-based automaker reported quarterly earnings of 49 cents per share, beating estimates of 47 cents per share.
Total revenue was up 5% on a year-over-year basis. Ford Blue sales were up 3% to $26.2 billion in the quarter despite a 2% decline in global wholesales due to discontinued low-margin internal combustion engine vehicles. Ford Pro sales were up 13% year-over-year to $15.7 billion.
Ford Model e sales fell 33% year-over-year while global hybrid vehicle sales increased 30% in the quarter. Ford Model e reported an EBIT loss of $1.2 billion. The company noted its electric segment continues to show improvements to profit trajectory on the back of cost improvements.
“We are in a strong position with Ford+ as our industry undergoes a sweeping transformation,” said Jim Farley, president and CEO of Ford.
“We have made strategic decisions and taken the tough actions to create advantages for Ford versus the competition in key areas like Ford Pro, international operations, software and next-generation electric vehicles. Importantly, over time, we have significant financial upside as we bend the curve on cost and quality, a key focus of our team.”
Check This Out: Ford Enjoys Bullish Drive Ahead Of Q3 Earnings, Struggles To Break Through Higher Resistance Levels
Outlook: Ford now expects full-year adjusted EBITDA of about $10 billion. The company anticipates full-year free cash flow of $7.5 billion to $8.5 billion. Capital expenditures are expected to be in the range of $8 billion to $8.5 billion.
Ford anticipates full-year Ford Pro EBIT of about $9 billion and full-year Ford Blue EBIT of about $5 billion. The company anticipates a full-year loss of about $5 billion for the Ford Model e segment.
Management will hold a conference call to discuss the company’s third-quarter results at 5 p.m. ET. Ford said it will report financial results for the fourth quarter after the market close on Feb. 5.
F Price Action: Ford shares were down about 7% year-to-date heading into the print. The stock was down 4.40% after hours at $10.87 at the time of publication Monday, according to Benzinga Pro.
Read Next:
Photo: Shutterstock.
Market News and Data brought to you by Benzinga APIs
© 2024 Benzinga.com. Benzinga does not provide investment advice. All rights reserved.
Amazon.com Options Trading: A Deep Dive into Market Sentiment
Deep-pocketed investors have adopted a bullish approach towards Amazon.com AMZN, and it’s something market players shouldn’t ignore. Our tracking of public options records at Benzinga unveiled this significant move today. The identity of these investors remains unknown, but such a substantial move in AMZN usually suggests something big is about to happen.
We gleaned this information from our observations today when Benzinga’s options scanner highlighted 154 extraordinary options activities for Amazon.com. This level of activity is out of the ordinary.
The general mood among these heavyweight investors is divided, with 49% leaning bullish and 33% bearish. Among these notable options, 34 are puts, totaling $3,036,139, and 120 are calls, amounting to $8,586,276.
What’s The Price Target?
Analyzing the Volume and Open Interest in these contracts, it seems that the big players have been eyeing a price window from $85.0 to $255.0 for Amazon.com during the past quarter.
Analyzing Volume & Open Interest
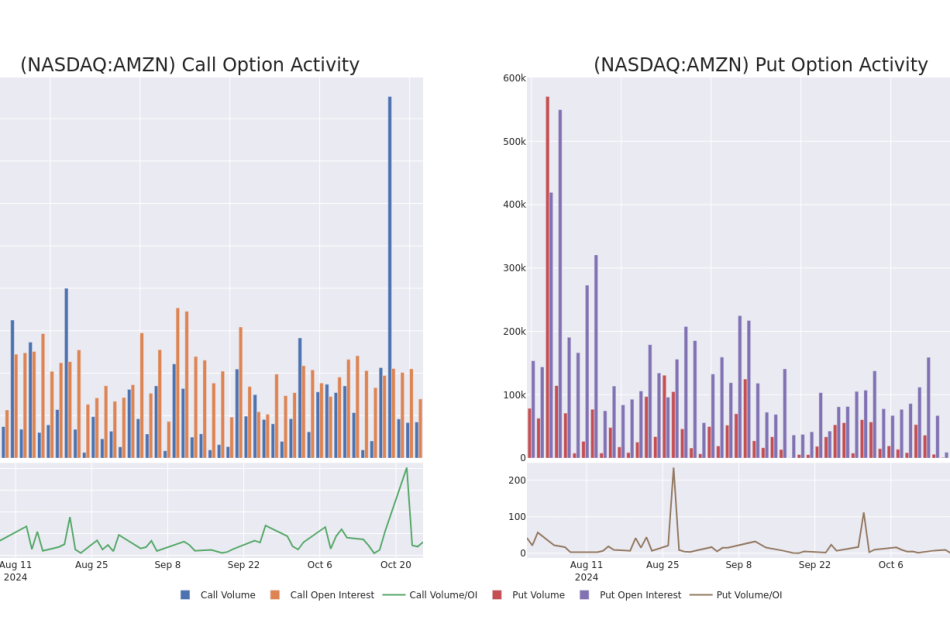
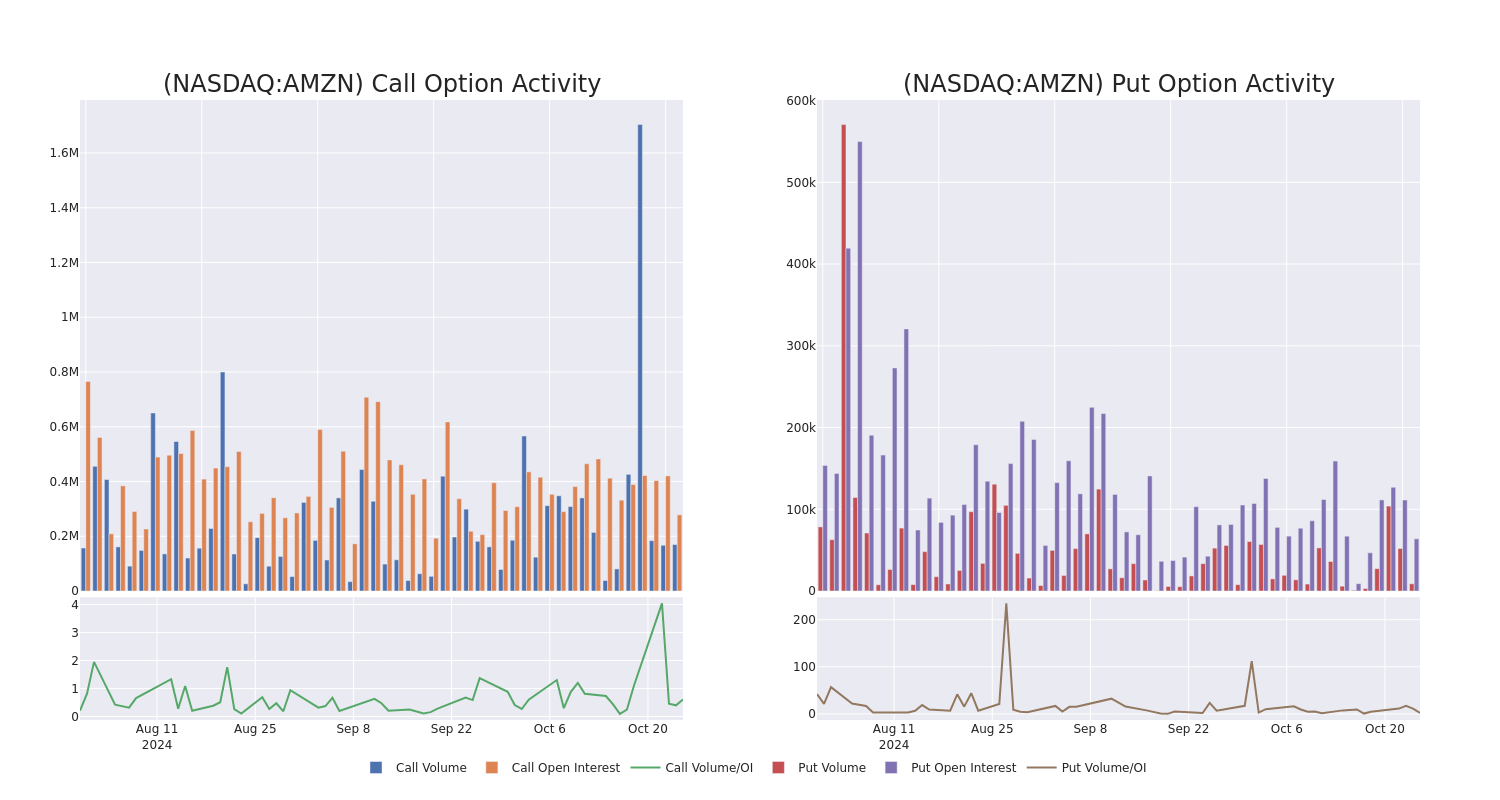
Looking at the volume and open interest is a powerful move while trading options. This data can help you track the liquidity and interest for Amazon.com’s options for a given strike price. Below, we can observe the evolution of the volume and open interest of calls and puts, respectively, for all of Amazon.com’s whale trades within a strike price range from $85.0 to $255.0 in the last 30 days.
Amazon.com Option Volume And Open Interest Over Last 30 Days
Largest Options Trades Observed:
| Symbol | PUT/CALL | Trade Type | Sentiment | Exp. Date | Ask | Bid | Price | Strike Price | Total Trade Price | Open Interest | Volume |
|---|---|---|---|---|---|---|---|---|---|---|---|
| AMZN | PUT | TRADE | BULLISH | 04/17/25 | $12.55 | $12.45 | $12.45 | $185.00 | $622.5K | 642 | 584 |
| AMZN | PUT | TRADE | BEARISH | 01/15/27 | $28.25 | $27.8 | $28.15 | $190.00 | $295.5K | 163 | 106 |
| AMZN | CALL | SWEEP | BULLISH | 01/17/25 | $7.75 | $7.65 | $7.75 | $200.00 | $249.5K | 47.8K | 2.0K |
| AMZN | CALL | SWEEP | BULLISH | 11/01/24 | $2.99 | $2.97 | $2.98 | $197.50 | $238.4K | 3.6K | 3.2K |
| AMZN | CALL | SWEEP | BULLISH | 11/01/24 | $3.05 | $2.99 | $3.0 | $197.50 | $234.0K | 3.6K | 3.9K |
About Amazon.com
Amazon is the leading online retailer and marketplace for third party sellers. Retail related revenue represents approximately 75% of total, followed by Amazon Web Services’ cloud computing, storage, database, and other offerings (15%), advertising services (5% to 10%), and other the remainder. International segments constitute 25% to 30% of Amazon’s non-AWS sales, led by Germany, the United Kingdom, and Japan.
Present Market Standing of Amazon.com
- With a trading volume of 16,678,563, the price of AMZN is up by 0.7%, reaching $189.15.
- Current RSI values indicate that the stock is may be approaching overbought.
- Next earnings report is scheduled for 3 days from now.
What The Experts Say On Amazon.com
Over the past month, 5 industry analysts have shared their insights on this stock, proposing an average target price of $216.6.
Unusual Options Activity Detected: Smart Money on the Move
Benzinga Edge’s Unusual Options board spots potential market movers before they happen. See what positions big money is taking on your favorite stocks. Click here for access.
* An analyst from Evercore ISI Group downgraded its action to Outperform with a price target of $240.
* An analyst from DA Davidson persists with their Buy rating on Amazon.com, maintaining a target price of $235.
* An analyst from Needham has revised its rating downward to Buy, adjusting the price target to $210.
* An analyst from Wells Fargo downgraded its action to Equal-Weight with a price target of $183.
* An analyst from Telsey Advisory Group persists with their Outperform rating on Amazon.com, maintaining a target price of $215.
Trading options involves greater risks but also offers the potential for higher profits. Savvy traders mitigate these risks through ongoing education, strategic trade adjustments, utilizing various indicators, and staying attuned to market dynamics. Keep up with the latest options trades for Amazon.com with Benzinga Pro for real-time alerts.
Market News and Data brought to you by Benzinga APIs
© 2024 Benzinga.com. Benzinga does not provide investment advice. All rights reserved.
Advisory: Fortis Inc. to Hold Teleconference on November 5 to Discuss Third Quarter 2024 Results
ST. JOHN’S, Newfoundland and Labrador, Oct. 28, 2024 (GLOBE NEWSWIRE) — Fortis Inc. (“Fortis” or the “Corporation”) FTS will release its third quarter 2024 financial results on Tuesday, November 5, 2024. A teleconference and webcast will be held the same day at 8:30 a.m. (Eastern). David Hutchens, President and Chief Executive Officer and Jocelyn Perry, Executive Vice President and Chief Financial Officer will discuss the Corporation’s third quarter financial results.
Shareholders, analysts, members of the media and other interested parties are invited to listen to the teleconference via the live webcast on the Corporation’s website, www.fortisinc.com/investors/events-and-presentations.
Those members of the financial community in North America wishing to ask questions during the call are invited to participate toll free by calling 1.800.717.1738 while those outside of North America can participate by calling 1.289.514.5100. Please dial in 10 minutes prior to the start of the call. No passcode is required.
A live and archived audio webcast of the teleconference will be available on the Corporation’s website, www.fortisinc.com. A replay of the teleconference will be available two hours after the conclusion of the call until December 5, 2024. Please call 1.888.660.6264 or 1.289.819.1325 and enter passcode 33826#.
About Fortis
Fortis is a well-diversified leader in the North American regulated electric and gas utility industry with 2023 revenue of $12 billion and total assets of $69 billion as at June 30, 2024. The Corporation’s 9,600 employees serve utility customers in five Canadian provinces, ten U.S. states and three Caribbean countries.
Fortis shares are listed on the TSX and NYSE and trade under the symbol FTS. Additional information can be accessed at www.fortisinc.com, www.sedarplus.ca, or www.sec.gov.
A .pdf version of this press release is available at: http://ml.globenewswire.com/Resource/Download/edeaf80a-e47c-4db9-a80e-bdf7fe1b91c2
For further information contact
| Investor Enquiries: Ms. Stephanie Amaimo Vice President, Investor Relations Fortis Inc. 248.946.3572 investorrelations@fortisinc.com |
Media Enquiries: Ms. Karen McCarthy Vice President, Communications & Government Relations Fortis Inc. 709.737.5323 media@fortisinc.com |

Market News and Data brought to you by Benzinga APIs
© 2024 Benzinga.com. Benzinga does not provide investment advice. All rights reserved.
This Is What Whales Are Betting On Walt Disney
Investors with a lot of money to spend have taken a bullish stance on Walt Disney DIS.
And retail traders should know.
We noticed this today when the positions showed up on publicly available options history that we track here at Benzinga.
Whether these are institutions or just wealthy individuals, we don’t know. But when something this big happens with DIS, it often means somebody knows something is about to happen.
Today, Benzinga’s options scanner spotted 31 options trades for Walt Disney.
This isn’t normal.
The overall sentiment of these big-money traders is split between 58% bullish and 35%, bearish.
Out of all of the options we uncovered, there was 1 put, for a total amount of $25,569, and 30, calls, for a total amount of $1,238,034.
Expected Price Movements
After evaluating the trading volumes and Open Interest, it’s evident that the major market movers are focusing on a price band between $70.0 and $120.0 for Walt Disney, spanning the last three months.
Insights into Volume & Open Interest
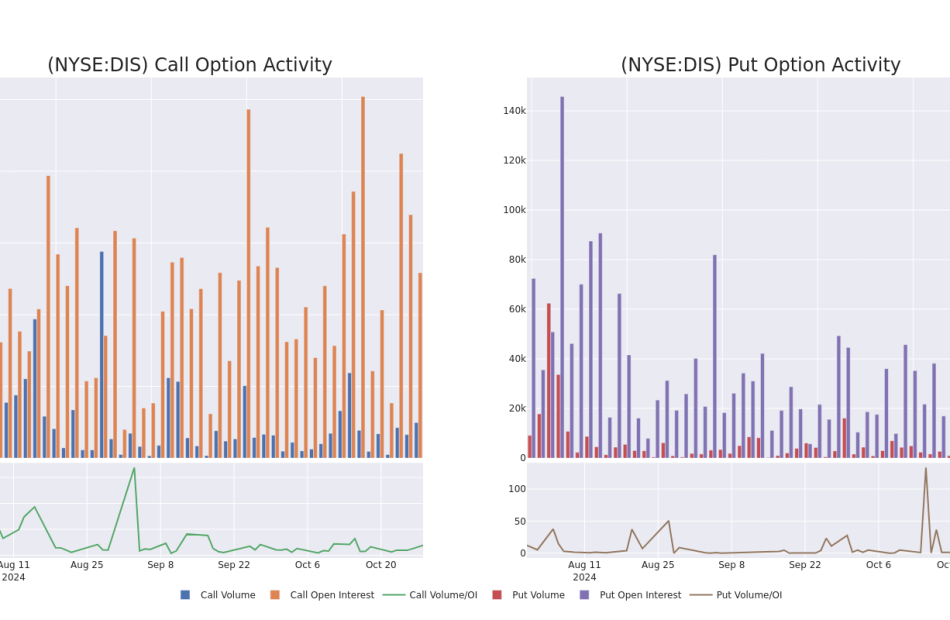
In today’s trading context, the average open interest for options of Walt Disney stands at 4049.5, with a total volume reaching 9,998.00. The accompanying chart delineates the progression of both call and put option volume and open interest for high-value trades in Walt Disney, situated within the strike price corridor from $70.0 to $120.0, throughout the last 30 days.
Walt Disney Call and Put Volume: 30-Day Overview

Noteworthy Options Activity:
| Symbol | PUT/CALL | Trade Type | Sentiment | Exp. Date | Ask | Bid | Price | Strike Price | Total Trade Price | Open Interest | Volume |
|---|---|---|---|---|---|---|---|---|---|---|---|
| DIS | CALL | SWEEP | BULLISH | 09/19/25 | $7.85 | $7.75 | $7.85 | $105.00 | $91.8K | 1.4K | 1 |
| DIS | CALL | TRADE | BEARISH | 03/21/25 | $18.75 | $18.65 | $18.65 | $80.00 | $65.2K | 523 | 36 |
| DIS | CALL | SWEEP | BULLISH | 12/19/25 | $13.95 | $13.85 | $13.85 | $95.00 | $62.5K | 981 | 46 |
| DIS | CALL | SWEEP | BULLISH | 01/17/25 | $3.95 | $3.9 | $3.95 | $100.00 | $53.7K | 15.6K | 246 |
| DIS | CALL | TRADE | BEARISH | 12/20/24 | $17.1 | $16.9 | $16.97 | $80.00 | $50.9K | 1.2K | 60 |
About Walt Disney
Disney operates in three global business segments: entertainment, sports, and experiences. Entertainment and experiences both benefit from franchises and characters the firm has created over the course of a century. Entertainment includes the ABC broadcast network, several cable television networks, and the Disney+ and Hulu streaming services. Within the segment, Disney also engages in movie and television production and distribution, with content licensed to movie theaters, other content providers, or, increasingly, kept in-house for use on Disney’s own streaming platform and television networks. The sports segment houses ESPN and the ESPN+ streaming service. Experiences contains Disney’s theme parks and vacation destinations, and also benefits from merchandise licensing.
Following our analysis of the options activities associated with Walt Disney, we pivot to a closer look at the company’s own performance.
Where Is Walt Disney Standing Right Now?
- With a volume of 5,646,884, the price of DIS is up 1.39% at $96.36.
- RSI indicators hint that the underlying stock may be approaching overbought.
- Next earnings are expected to be released in 17 days.
Unusual Options Activity Detected: Smart Money on the Move
Benzinga Edge’s Unusual Options board spots potential market movers before they happen. See what positions big money is taking on your favorite stocks. Click here for access.
Options trading presents higher risks and potential rewards. Astute traders manage these risks by continually educating themselves, adapting their strategies, monitoring multiple indicators, and keeping a close eye on market movements. Stay informed about the latest Walt Disney options trades with real-time alerts from Benzinga Pro.
Market News and Data brought to you by Benzinga APIs
© 2024 Benzinga.com. Benzinga does not provide investment advice. All rights reserved.
VF Corp Q2 Earnings: Revenue Beat, EPS Beat, Cost Reductions On Track, Guidance And More
V.F. Corp VFC reported second-quarter financial results after the market close on Monday. Here’s a rundown of the report.
Q2 Earnings: VF Corp, the parent company of Vans and The North Face, reported second-quarter revenue of $2.8 billion, beating the consensus estimate of $2.7 billion, according to Benzinga Pro. The company reported second-quarter earnings of 60 cents per share, beating analyst estimates of 37 cents per share.
Total revenues were down 6% year-over-year. The North Face revenues were down 3% in the second quarter and Vans’ revenues fell 11%. Americas revenues were down 10% in the quarter and international revenues fell 2%.
Inventories were down 13% compared to the prior year’s quarter. The company noted that it lowered its debt by $446 million in the quarter, bringing net debt down to $5.7 billion at quarter’s end.
“Our results in the quarter met our expectations and reflect a sequential and broad-based improvement in year-on-year trends. At the same time, we made further progress on our four Reinvent priorities and we are on track to reach our previously announced $300 million savings target by the end of FY25,” said Bracken Darrell, president and CEO of VF Corp.
Looking Ahead: VF Corp expects third-quarter revenue to be in the range of $2.7 billion to $2.75 billion versus estimates of $2.96 billion, according to Benzinga Pro. The company anticipates third-quarter adjusted operating income of $170 million to $200 million.
VF Corp anticipates full-year free cash flow from continuing operations of approximately $425 million. The company noted that core fundamentals remain in line with previous guidance.
The company’s board declared a dividend of 9 cents per share, payable on Dec. 18 to shareholders of record as of Dec. 10. VF Corp’s management team is currently discussing the quarter on a conference call that started at 4:30 p.m. ET.
VFC Price Action: VF Corp shares were up 16.85% in after-hours, trading at $19.90 at the time of publication Monday, per Benzinga Pro.
Photo: Shutterstock.
Market News and Data brought to you by Benzinga APIs
© 2024 Benzinga.com. Benzinga does not provide investment advice. All rights reserved.
Price Over Earnings Overview: Halliburton
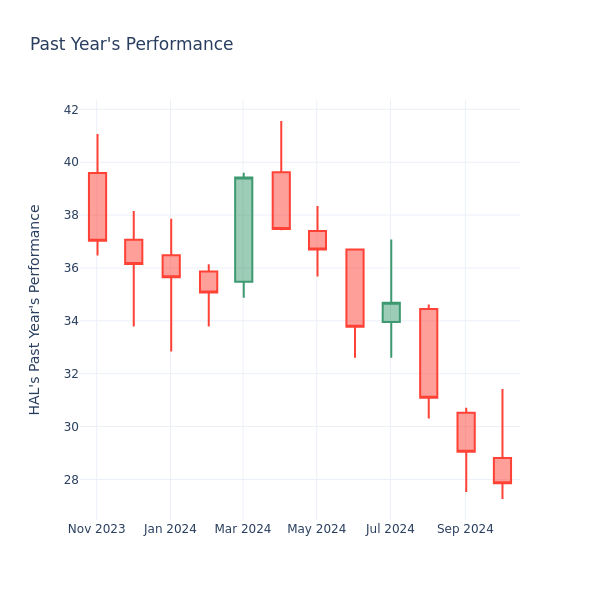
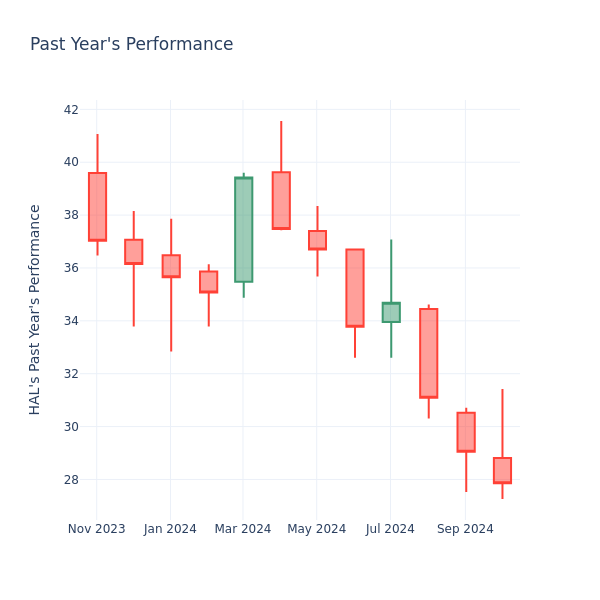
In the current session, Halliburton Inc. HAL is trading at $27.86, after a 1.38% decrease. Over the past month, the stock fell by 6.92%, and in the past year, by 29.18%. With performance like this, long-term shareholders are more likely to start looking into the company’s price-to-earnings ratio.
Comparing Halliburton P/E Against Its Peers
The P/E ratio is used by long-term shareholders to assess the company’s market performance against aggregate market data, historical earnings, and the industry at large. A lower P/E could indicate that shareholders do not expect the stock to perform better in the future or it could mean that the company is undervalued.
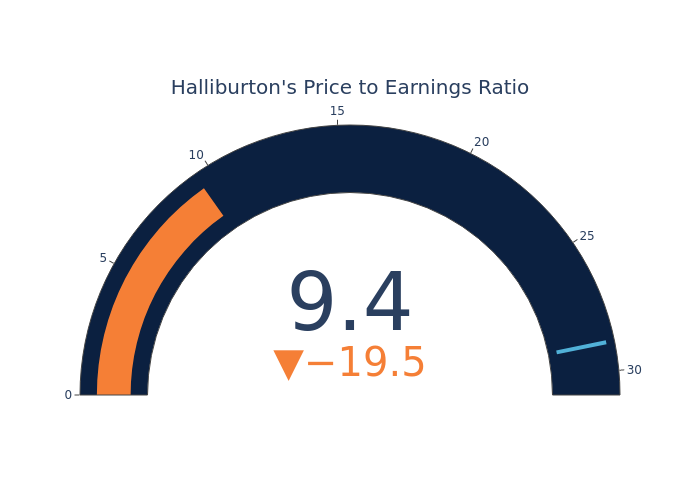
Compared to the aggregate P/E ratio of the 28.86 in the Energy Equipment & Services industry, Halliburton Inc. has a lower P/E ratio of 9.39. Shareholders might be inclined to think that the stock might perform worse than it’s industry peers. It’s also possible that the stock is undervalued.
In summary, while the price-to-earnings ratio is a valuable tool for investors to evaluate a company’s market performance, it should be used with caution. A low P/E ratio can be an indication of undervaluation, but it can also suggest weak growth prospects or financial instability. Moreover, the P/E ratio is just one of many metrics that investors should consider when making investment decisions, and it should be evaluated alongside other financial ratios, industry trends, and qualitative factors. By taking a comprehensive approach to analyzing a company’s financial health, investors can make well-informed decisions that are more likely to lead to successful outcomes.
Market News and Data brought to you by Benzinga APIs
© 2024 Benzinga.com. Benzinga does not provide investment advice. All rights reserved.

