Insights into Agilysys's Upcoming Earnings
Agilysys AGYS will release its quarterly earnings report on Monday, 2024-10-28. Here’s a brief overview for investors ahead of the announcement.
Analysts anticipate Agilysys to report an earnings per share (EPS) of $0.30.
Investors in Agilysys are eagerly awaiting the company’s announcement, hoping for news of surpassing estimates and positive guidance for the next quarter.
It’s worth noting for new investors that stock prices can be heavily influenced by future projections rather than just past performance.
Historical Earnings Performance
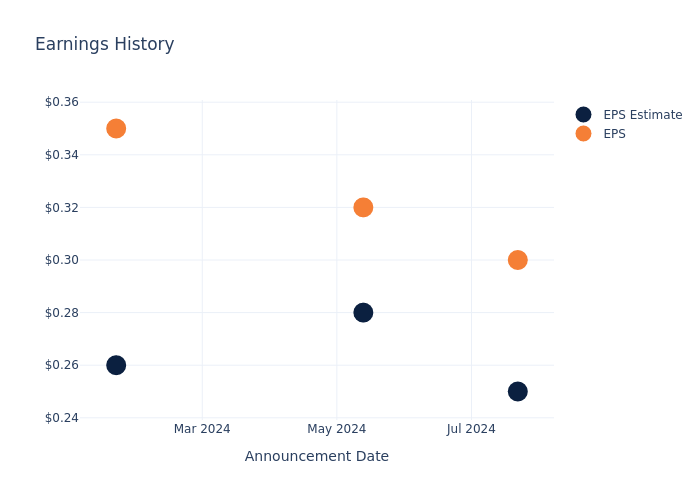
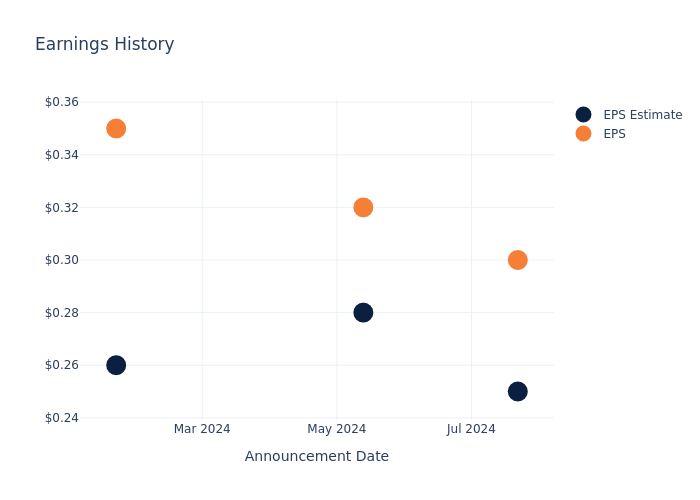
During the last quarter, the company reported an EPS beat by $0.05, leading to a 4.51% drop in the share price on the subsequent day.
Here’s a look at Agilysys’s past performance and the resulting price change:
| Quarter | Q1 2025 | Q4 2024 | Q3 2024 | Q2 2024 |
|---|---|---|---|---|
| EPS Estimate | 0.25 | 0.28 | 0.26 | 0.19 |
| EPS Actual | 0.30 | 0.32 | 0.35 | 0.25 |
| Price Change % | -5.0% | 15.0% | 0.0% | 25.0% |
Stock Performance
Shares of Agilysys were trading at $110.97 as of October 24. Over the last 52-week period, shares are up 34.45%. Given that these returns are generally positive, long-term shareholders are likely bullish going into this earnings release.
Analyst Opinions on Agilysys
For investors, grasping market sentiments and expectations in the industry is vital. This analysis explores the latest insights regarding Agilysys.
Agilysys has received a total of 2 ratings from analysts, with the consensus rating as Buy. With an average one-year price target of $128.5, the consensus suggests a potential 15.8% upside.
Peer Ratings Overview
The following analysis focuses on the analyst ratings and average 1-year price targets of Riot Platforms, Braze and Cleanspark, three prominent industry players, providing insights into their relative performance expectations and market positioning.
- As per analysts’ assessments, Riot Platforms is favoring an Outperform trajectory, with an average 1-year price target of $17.64, suggesting a potential 84.1% downside.
- The consensus among analysts is an Buy trajectory for Braze, with an average 1-year price target of $57.53, indicating a potential 48.16% downside.
- Cleanspark is maintaining an Outperform status according to analysts, with an average 1-year price target of $22.56, indicating a potential 79.67% downside.
Peer Analysis Summary
Within the peer analysis summary, vital metrics for Riot Platforms, Braze and Cleanspark are presented, shedding light on their respective standings within the industry and offering valuable insights into their market positions and comparative performance.
| Company | Consensus | Revenue Growth | Gross Profit | Return on Equity |
|---|---|---|---|---|
| Agilysys | Buy | 13.29% | $39.87M | 5.75% |
| Riot Platforms | Outperform | -8.76% | $16.38M | -3.34% |
| Braze | Buy | 26.40% | $102.08M | -5.17% |
| Cleanspark | Outperform | 129.41% | $41.78M | -16.49% |
Key Takeaway:
Agilysys ranks at the top for Revenue Growth and Gross Profit among its peers. However, it ranks at the bottom for Return on Equity.
Delving into Agilysys’s Background
Agilysys Inc has been a leader in hospitality software, delivering innovative cloud-native SaaS and on-premise solutions for hotels, resorts and cruise lines, casinos, corporate food service management, restaurants, universities, stadiums, and healthcare. The Company’s software solutions include point-of-sale (POS), property management (PMS), inventory and procurement, payments, and related applications that manage and enhance the entire guest journey. Agilysys also is known for its world-class customer-centric service.
Understanding the Numbers: Agilysys’s Finances
Market Capitalization Analysis: With a profound presence, the company’s market capitalization is above industry averages. This reflects substantial size and strong market recognition.
Positive Revenue Trend: Examining Agilysys’s financials over 3 months reveals a positive narrative. The company achieved a noteworthy revenue growth rate of 13.29% as of 30 June, 2024, showcasing a substantial increase in top-line earnings. As compared to competitors, the company encountered difficulties, with a growth rate lower than the average among peers in the Information Technology sector.
Net Margin: Agilysys’s financial strength is reflected in its exceptional net margin, which exceeds industry averages. With a remarkable net margin of 22.21%, the company showcases strong profitability and effective cost management.
Return on Equity (ROE): The company’s ROE is a standout performer, exceeding industry averages. With an impressive ROE of 5.75%, the company showcases effective utilization of equity capital.
Return on Assets (ROA): Agilysys’s ROA excels beyond industry benchmarks, reaching 4.0%. This signifies efficient management of assets and strong financial health.
Debt Management: The company maintains a balanced debt approach with a debt-to-equity ratio below industry norms, standing at 0.09.
To track all earnings releases for Agilysys visit their earnings calendar on our site.
This article was generated by Benzinga’s automated content engine and reviewed by an editor.
© 2024 Benzinga.com. Benzinga does not provide investment advice. All rights reserved.
Insights into Agilysys's Upcoming Earnings
Agilysys AGYS will release its quarterly earnings report on Monday, 2024-10-28. Here’s a brief overview for investors ahead of the announcement.
Analysts anticipate Agilysys to report an earnings per share (EPS) of $0.30.
Investors in Agilysys are eagerly awaiting the company’s announcement, hoping for news of surpassing estimates and positive guidance for the next quarter.
It’s worth noting for new investors that stock prices can be heavily influenced by future projections rather than just past performance.
Historical Earnings Performance
During the last quarter, the company reported an EPS beat by $0.05, leading to a 4.51% drop in the share price on the subsequent day.
Here’s a look at Agilysys’s past performance and the resulting price change:
| Quarter | Q1 2025 | Q4 2024 | Q3 2024 | Q2 2024 |
|---|---|---|---|---|
| EPS Estimate | 0.25 | 0.28 | 0.26 | 0.19 |
| EPS Actual | 0.30 | 0.32 | 0.35 | 0.25 |
| Price Change % | -5.0% | 15.0% | 0.0% | 25.0% |

Stock Performance
Shares of Agilysys were trading at $110.97 as of October 24. Over the last 52-week period, shares are up 34.45%. Given that these returns are generally positive, long-term shareholders are likely bullish going into this earnings release.
Analyst Opinions on Agilysys
For investors, grasping market sentiments and expectations in the industry is vital. This analysis explores the latest insights regarding Agilysys.
Agilysys has received a total of 2 ratings from analysts, with the consensus rating as Buy. With an average one-year price target of $128.5, the consensus suggests a potential 15.8% upside.
Peer Ratings Overview
The following analysis focuses on the analyst ratings and average 1-year price targets of Riot Platforms, Braze and Cleanspark, three prominent industry players, providing insights into their relative performance expectations and market positioning.
- As per analysts’ assessments, Riot Platforms is favoring an Outperform trajectory, with an average 1-year price target of $17.64, suggesting a potential 84.1% downside.
- The consensus among analysts is an Buy trajectory for Braze, with an average 1-year price target of $57.53, indicating a potential 48.16% downside.
- Cleanspark is maintaining an Outperform status according to analysts, with an average 1-year price target of $22.56, indicating a potential 79.67% downside.
Peer Analysis Summary
Within the peer analysis summary, vital metrics for Riot Platforms, Braze and Cleanspark are presented, shedding light on their respective standings within the industry and offering valuable insights into their market positions and comparative performance.
| Company | Consensus | Revenue Growth | Gross Profit | Return on Equity |
|---|---|---|---|---|
| Agilysys | Buy | 13.29% | $39.87M | 5.75% |
| Riot Platforms | Outperform | -8.76% | $16.38M | -3.34% |
| Braze | Buy | 26.40% | $102.08M | -5.17% |
| Cleanspark | Outperform | 129.41% | $41.78M | -16.49% |
Key Takeaway:
Agilysys ranks at the top for Revenue Growth and Gross Profit among its peers. However, it ranks at the bottom for Return on Equity.
Delving into Agilysys’s Background
Agilysys Inc has been a leader in hospitality software, delivering innovative cloud-native SaaS and on-premise solutions for hotels, resorts and cruise lines, casinos, corporate food service management, restaurants, universities, stadiums, and healthcare. The Company’s software solutions include point-of-sale (POS), property management (PMS), inventory and procurement, payments, and related applications that manage and enhance the entire guest journey. Agilysys also is known for its world-class customer-centric service.
Understanding the Numbers: Agilysys’s Finances
Market Capitalization Analysis: With a profound presence, the company’s market capitalization is above industry averages. This reflects substantial size and strong market recognition.
Positive Revenue Trend: Examining Agilysys’s financials over 3 months reveals a positive narrative. The company achieved a noteworthy revenue growth rate of 13.29% as of 30 June, 2024, showcasing a substantial increase in top-line earnings. As compared to competitors, the company encountered difficulties, with a growth rate lower than the average among peers in the Information Technology sector.
Net Margin: Agilysys’s financial strength is reflected in its exceptional net margin, which exceeds industry averages. With a remarkable net margin of 22.21%, the company showcases strong profitability and effective cost management.
Return on Equity (ROE): The company’s ROE is a standout performer, exceeding industry averages. With an impressive ROE of 5.75%, the company showcases effective utilization of equity capital.
Return on Assets (ROA): Agilysys’s ROA excels beyond industry benchmarks, reaching 4.0%. This signifies efficient management of assets and strong financial health.
Debt Management: The company maintains a balanced debt approach with a debt-to-equity ratio below industry norms, standing at 0.09.
To track all earnings releases for Agilysys visit their earnings calendar on our site.
This article was generated by Benzinga’s automated content engine and reviewed by an editor.
© 2024 Benzinga.com. Benzinga does not provide investment advice. All rights reserved.
If You Invested $1000 In This Stock 10 Years Ago, You Would Have $7,200 Today
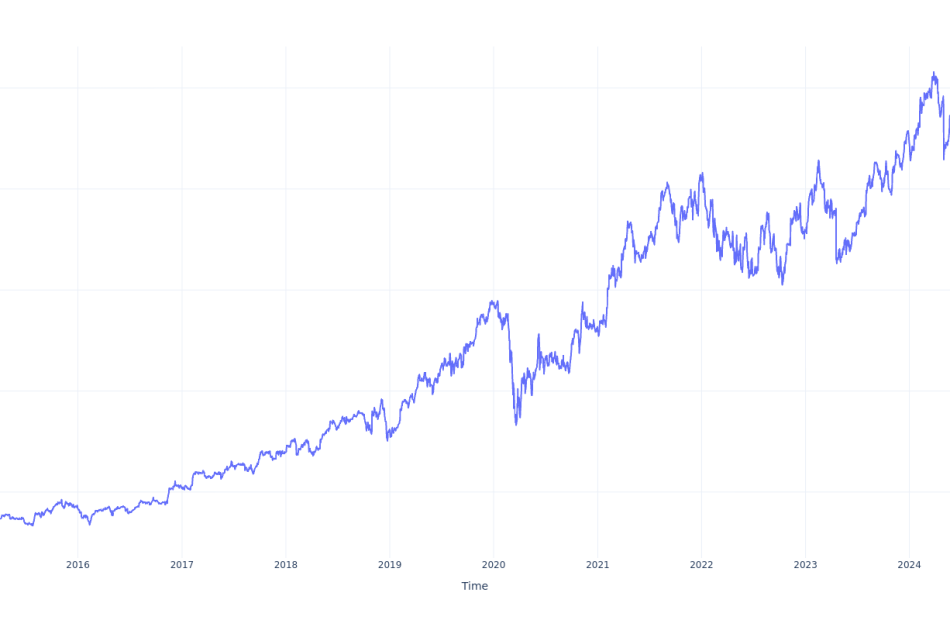
CDW CDW has outperformed the market over the past 10 years by 10.58% on an annualized basis producing an average annual return of 21.83%. Currently, CDW has a market capitalization of $28.99 billion.
Buying $1000 In CDW: If an investor had bought $1000 of CDW stock 10 years ago, it would be worth $7,233.67 today based on a price of $217.01 for CDW at the time of writing.
CDW’s Performance Over Last 10 Years

Finally — what’s the point of all this? The key insight to take from this article is to note how much of a difference compounded returns can make in your cash growth over a period of time.
This article was generated by Benzinga’s automated content engine and reviewed by an editor.
Market News and Data brought to you by Benzinga APIs
© 2024 Benzinga.com. Benzinga does not provide investment advice. All rights reserved.
Real estate development families donate $30M toward UHN's new surgical tower
D’Angelo, Maio and Memme families announce largest single philanthropic gift to date in support of $300M capital campaign
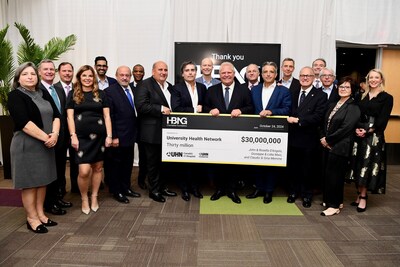
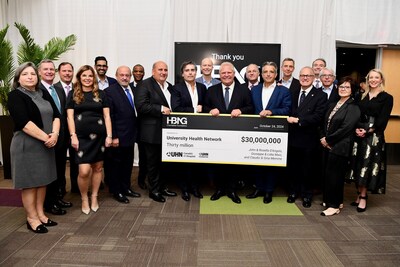
TORONTO, Oct. 25, 2024 /CNW/ – UHN Foundation proudly announces a landmark $30-million gift from three families in the real estate development sector to support the construction of UHN’S new cutting-edge surgical tower at Toronto Western Hospital. John D’Angelo, Giuseppe Maio and Claudio Memme – partners at HBNG Holborn Group – together with their wives Rosella, Lidia and Gina, respectively, and the HBNG Charitable Foundation, unveiled the gift last night at the opening of the 20th Grand Cru Culinary Wine Festival. Founded by UHN trustee and UHN Foundation board member Todd Halpern, Grand Cru is a three-day event that includes a live auction, wine tastings, and exclusive private dinners hosted in homes across Toronto, and has become one of the city’s premier fundraising celebrations.
This is the largest single philanthropic gift to date in support of UHN Foundation’s $300M fundraising campaign, which will help build the $1.1B tower at UHN’s Toronto Western campus – the largest capital project in UHN’s history. Slated for completion in 2028, the new 15-storey surgical tower will be purpose-built to prioritize the experience of patients and their families, featuring 82 private patient rooms, new critical care beds, and 20 state-of-the-art operating rooms equipped with the latest robotic equipment and real-time imaging technology. The tower is anticipated to add capacity to the health care system, helping increase surgeries by 20% and addressing wait times and surgical backlog in Ontario.
“We are proud to contribute to such a momentous project that will help transform patient care in our community,” said the families in a joint statement. “We make this gift not only on behalf of our families, but on behalf and in honour of our larger HBNG family, to ensure that UHN can recruit and retain the very best surgical teams in the world by providing them with state-of-the-art infrastructure and equipment.”
Premier Doug Ford was also in attendance at last night’s Grand Cru live auction to help celebrate the gift and thank the families for their generosity.
“On behalf of the province, I want to extend my heartfelt thanks to the HBNG Charitable Foundation for their generous donation which will help build a new, state-of-the-art patient and surgical tower at Toronto Western Hospital,” said Premier Ford. “This historic gift builds on our government’s $800 million investment, and will help provide high-quality health care for patients here in Toronto and from across Ontario.”
“This tower will revolutionize surgical innovation while also completely transforming how we care for patients and their families,” said Julie Quenneville CEO of UHN Foundation. “We are so grateful to the D’Angelo, Maio and Memme families for their commitment to the well-being of our community, and for helping make UHN’s bold visions a reality. We hope their generosity inspires others to contribute to our mission of helping Canada’s #1 hospital reimagine health care.”
For more information on the tower project or how to get involved,
visit uhnfoundation.ca/surgicaltower
For more information on the Grand Cru Culinary Wine Festival, visit grandru.ca
About UHN Foundation
Part of University Health Network (UHN), UHN Foundation raises funds Toronto General Hospital, Toronto Western Hospital, Toronto Rehab and The Michener Institute of Education. No one ever changed the world on their own: donor support is critical to upholding the excellence in patient care that UHN is known for, and changing the status quo of health care – helping recruit and train the brightest medical minds from around the world, complete critical capital projects, develop new treatments for disease, and advance bold medical research. UHNfoundation.ca
About University Health Network (UHN)
UHN is Canada’s No. 1 hospital and the world’s No. 1 publicly funded hospital. With 10 sites and more than 20,000 members of TeamUHN, UHN consists of Toronto General Hospital, Toronto Western Hospital, Princess Margaret Cancer Centre, Toronto Rehabilitation Institute, The Michener Institute of Education at UHN and West Park Healthcare Centre. As Canada’s top research hospital, the scope of research and complexity of cases at UHN have made it a national and international source for discovery, education and patient care. UHN.ca
SOURCE UHN Foundation

![]() View original content to download multimedia: http://www.newswire.ca/en/releases/archive/October2024/25/c6022.html
View original content to download multimedia: http://www.newswire.ca/en/releases/archive/October2024/25/c6022.html
Market News and Data brought to you by Benzinga APIs
© 2024 Benzinga.com. Benzinga does not provide investment advice. All rights reserved.
Harmonic's Earnings: A Preview
Harmonic HLIT is gearing up to announce its quarterly earnings on Monday, 2024-10-28. Here’s a quick overview of what investors should know before the release.
Analysts are estimating that Harmonic will report an earnings per share (EPS) of $0.22.
Anticipation surrounds Harmonic’s announcement, with investors hoping to hear about both surpassing estimates and receiving positive guidance for the next quarter.
New investors should understand that while earnings performance is important, market reactions are often driven by guidance.
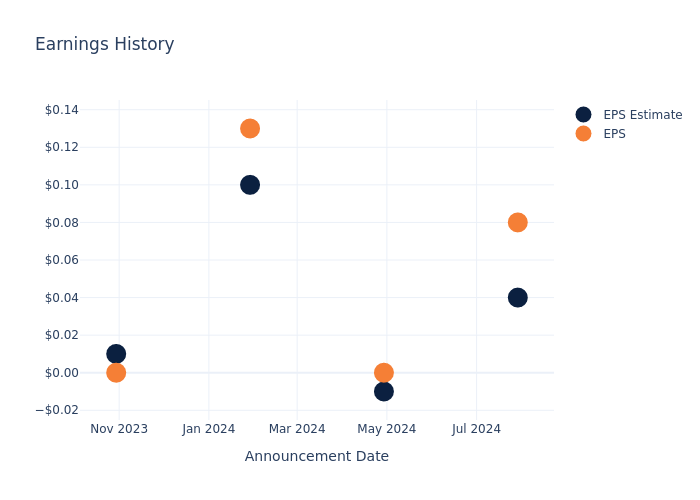
Earnings Track Record
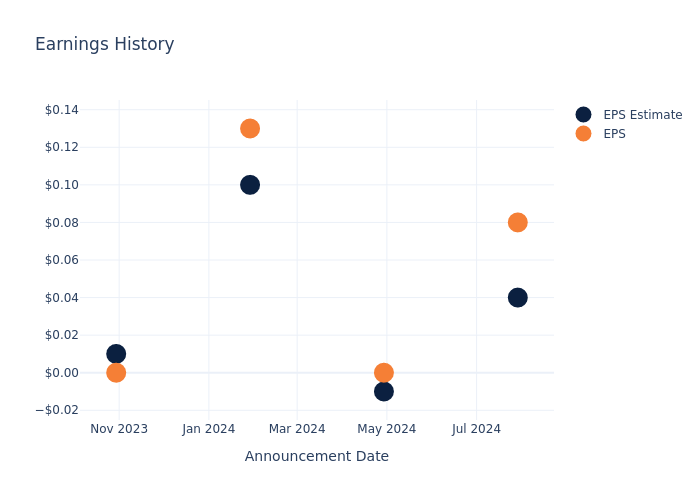
In the previous earnings release, the company beat EPS by $0.04, leading to a 21.19% increase in the share price the following trading session.
Here’s a look at Harmonic’s past performance and the resulting price change:
| Quarter | Q2 2024 | Q1 2024 | Q4 2023 | Q3 2023 |
|---|---|---|---|---|
| EPS Estimate | 0.04 | -0.01 | 0.10 | 0.01 |
| EPS Actual | 0.08 | 0 | 0.13 | 0 |
| Price Change % | 21.0% | 14.000000000000002% | 2.0% | 11.0% |
Market Performance of Harmonic’s Stock
Shares of Harmonic were trading at $14.7 as of October 24. Over the last 52-week period, shares are up 51.9%. Given that these returns are generally positive, long-term shareholders should be satisfied going into this earnings release.
Analyst Observations about Harmonic
For investors, staying informed about market sentiments and expectations in the industry is paramount. This analysis provides an exploration of the latest insights on Harmonic.
A total of 3 analyst ratings have been received for Harmonic, with the consensus rating being Buy. The average one-year price target stands at $18.67, suggesting a potential 27.01% upside.
Peer Ratings Comparison
In this analysis, we delve into the analyst ratings and average 1-year price targets of Infinera, Extreme Networks and Viavi Solutions, three key industry players, offering insights into their relative performance expectations and market positioning.
- For Infinera, analysts project an Buy trajectory, with an average 1-year price target of $6.43, indicating a potential 56.26% downside.
- As per analysts’ assessments, Extreme Networks is favoring an Buy trajectory, with an average 1-year price target of $16.75, suggesting a potential 13.95% upside.
- The prevailing sentiment among analysts is an Buy trajectory for Viavi Solutions, with an average 1-year price target of $9.5, implying a potential 35.37% downside.
Key Findings: Peer Analysis Summary
The peer analysis summary presents essential metrics for Infinera, Extreme Networks and Viavi Solutions, unveiling their respective standings within the industry and providing valuable insights into their market positions and comparative performance.
| Company | Consensus | Revenue Growth | Gross Profit | Return on Equity |
|---|---|---|---|---|
| Harmonic | Buy | -11.04% | $73.46M | -3.13% |
| Infinera | Buy | -8.90% | $135.59M | -32.95% |
| Extreme Networks | Buy | -29.47% | $114.62M | -120.13% |
| Viavi Solutions | Buy | -4.40% | $145.60M | -3.13% |
Key Takeaway:
Harmonic is at the bottom for Revenue Growth and Gross Profit, with negative percentages. It is also at the bottom for Return on Equity, with a negative percentage.
About Harmonic
Harmonic Inc designs and manufactures video infrastructure products and system solutions to deliver video and broadband services to consumer devices. The firm operates in two segments: Video, which sells video processing, production, and playout solutions to cable operators and satellite and telecommunications providers; and Broadband which sells broadband access solutions and related services. Majority of the revenue generated from the company is from United States.
Key Indicators: Harmonic’s Financial Health
Market Capitalization: Indicating a reduced size compared to industry averages, the company’s market capitalization poses unique challenges.
Decline in Revenue: Over the 3 months period, Harmonic faced challenges, resulting in a decline of approximately -11.04% in revenue growth as of 30 June, 2024. This signifies a reduction in the company’s top-line earnings. When compared to others in the Information Technology sector, the company faces challenges, achieving a growth rate lower than the average among peers.
Net Margin: Harmonic’s net margin excels beyond industry benchmarks, reaching -9.03%. This signifies efficient cost management and strong financial health.
Return on Equity (ROE): Harmonic’s ROE is below industry averages, indicating potential challenges in efficiently utilizing equity capital. With an ROE of -3.13%, the company may face hurdles in achieving optimal financial returns.
Return on Assets (ROA): The company’s ROA is below industry benchmarks, signaling potential difficulties in efficiently utilizing assets. With an ROA of -1.72%, the company may need to address challenges in generating satisfactory returns from its assets.
Debt Management: The company maintains a balanced debt approach with a debt-to-equity ratio below industry norms, standing at 0.38.
To track all earnings releases for Harmonic visit their earnings calendar on our site.
This article was generated by Benzinga’s automated content engine and reviewed by an editor.
Market News and Data brought to you by Benzinga APIs
© 2024 Benzinga.com. Benzinga does not provide investment advice. All rights reserved.
These Analysts Revise Their Forecasts On DexCom Following Q3 Results
DexCom, Inc. DXCM reported better-than-expected third-quarter results on Thursday.
DexCom reported quarterly earnings of 45 cents per share, which beat the analyst consensus estimate of 43 cents. Quarterly revenue came in at $994.2 million which beat the analyst consensus estimate of $990.71 million and is an increase over sales of $975 million from the same period last year.
DexCom also announced Teri Lawver, executive vice president and chief commercial officer, will retire at the end of the year. Lawver will continue as a special advisor to Dexcom through early 2025 and Kevin Sayer, chairman, president and CEO, will assume leadership of the commercial organization as the company conducts a global search for a new chief commercial officer.
DexCom shares fell 1.6% to trade at $73.68 on Friday.
These analysts made changes to their price targets on DexCom following earnings announcement.
- Wells Fargo analyst Larry Biegelsen maintained DexCom with an Overweight and raised the price target from $80 to $90.
- Leerink Partners analyst Mike Kratky maintained DexCom with an Outperform and lowered the price target from $90 to $87.
- JP Morgan analyst Robbie Marcus maintained the stock with a Neutral and raised the price target from $75 to $85.
- Oppenheimer analyst Steven Lichtman maintained DexCom with an Outperform and lowered the price target from $115 to $105.
- RBC Capital analyst Shagun Singh maintained the stock with an Outperform and lowered the price target from $120 to $115.
- Bernstein analyst Lee Hambright maintained DexCom with an Outperform and raised the price target from $82 to $86.
- Raymond James analyst Jayson Bedford maintained DexCom with a Strong Buy and lowered the price target from $115 to $99.
Read Next:
Market News and Data brought to you by Benzinga APIs
© 2024 Benzinga.com. Benzinga does not provide investment advice. All rights reserved.
Bankwell Finl Gr's Earnings: A Preview
Bankwell Finl Gr BWFG is gearing up to announce its quarterly earnings on Monday, 2024-10-28. Here’s a quick overview of what investors should know before the release.
Analysts are estimating that Bankwell Finl Gr will report an earnings per share (EPS) of $0.68.
The announcement from Bankwell Finl Gr is eagerly anticipated, with investors seeking news of surpassing estimates and favorable guidance for the next quarter.
It’s worth noting for new investors that guidance can be a key determinant of stock price movements.
Historical Earnings Performance
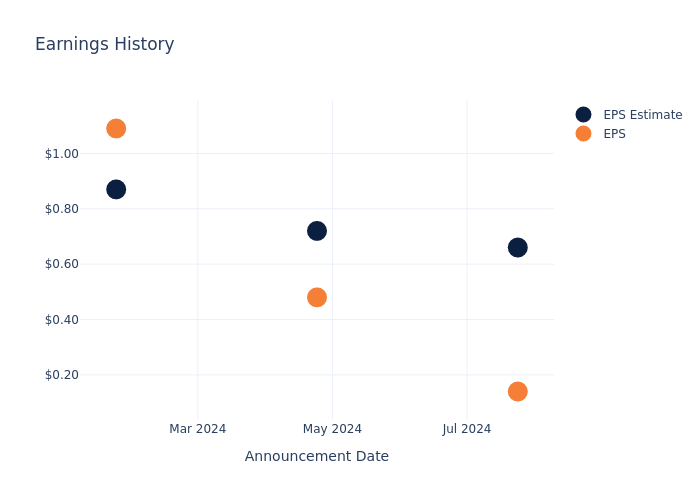
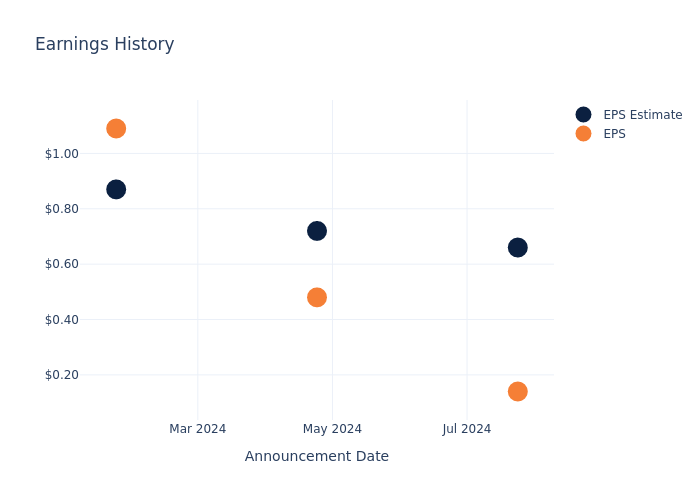
Last quarter the company missed EPS by $0.52, which was followed by a 0.34% drop in the share price the next day.
Here’s a look at Bankwell Finl Gr’s past performance and the resulting price change:
| Quarter | Q2 2024 | Q1 2024 | Q4 2023 | Q3 2023 |
|---|---|---|---|---|
| EPS Estimate | 0.66 | 0.72 | 0.87 | 0.93 |
| EPS Actual | 0.14 | 0.48 | 1.09 | 1.25 |
| Price Change % | -0.0% | -5.0% | 1.0% | 2.0% |
Stock Performance
Shares of Bankwell Finl Gr were trading at $28.71 as of October 24. Over the last 52-week period, shares are up 16.35%. Given that these returns are generally positive, long-term shareholders should be satisfied going into this earnings release.
To track all earnings releases for Bankwell Finl Gr visit their earnings calendar on our site.
This article was generated by Benzinga’s automated content engine and reviewed by an editor.
Market News and Data brought to you by Benzinga APIs
© 2024 Benzinga.com. Benzinga does not provide investment advice. All rights reserved.
Toncoin Falls More Than 4% In 24 hours
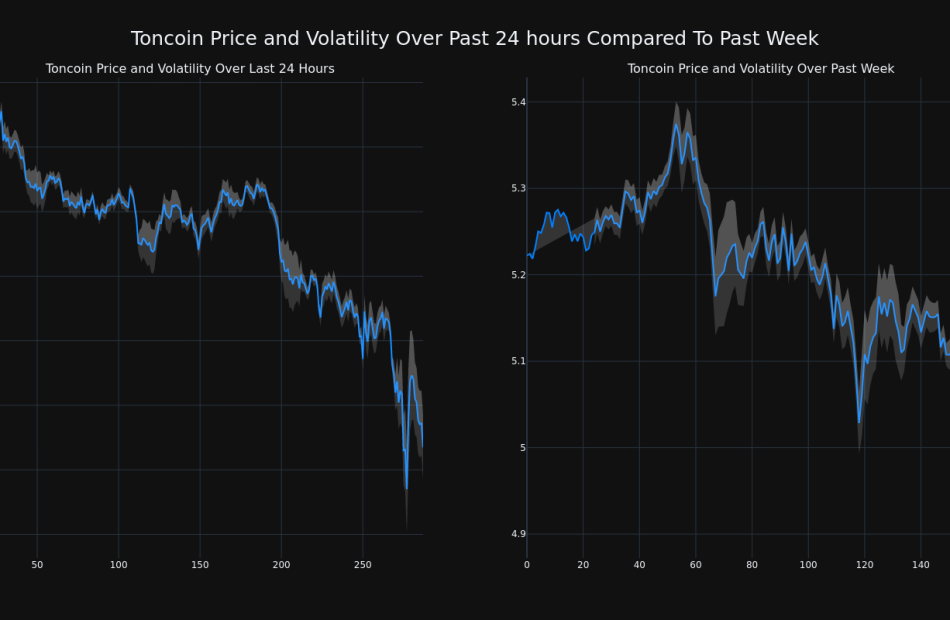
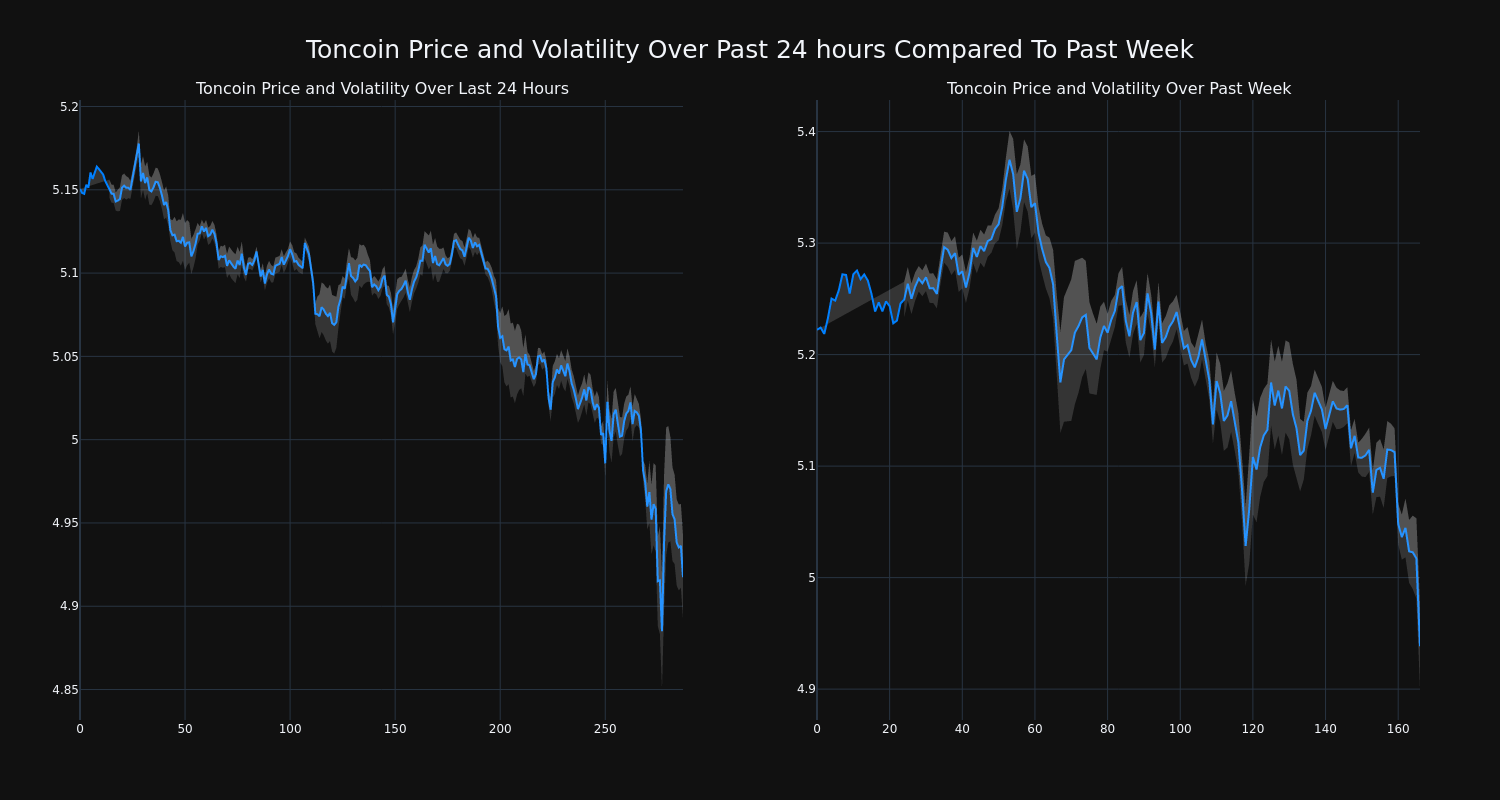
Toncoin’s TON/USD price has decreased 4.49% over the past 24 hours to $4.92, continuing its downward trend over the past week of -5.0%, moving from $5.22 to its current price.
The chart below compares the price movement and volatility for Toncoin over the past 24 hours (left) to its price movement over the past week (right). The gray bands are Bollinger Bands, measuring the volatility for both the daily and weekly price movements. The wider the bands are, or the larger the gray area is at any given moment, the larger the volatility.
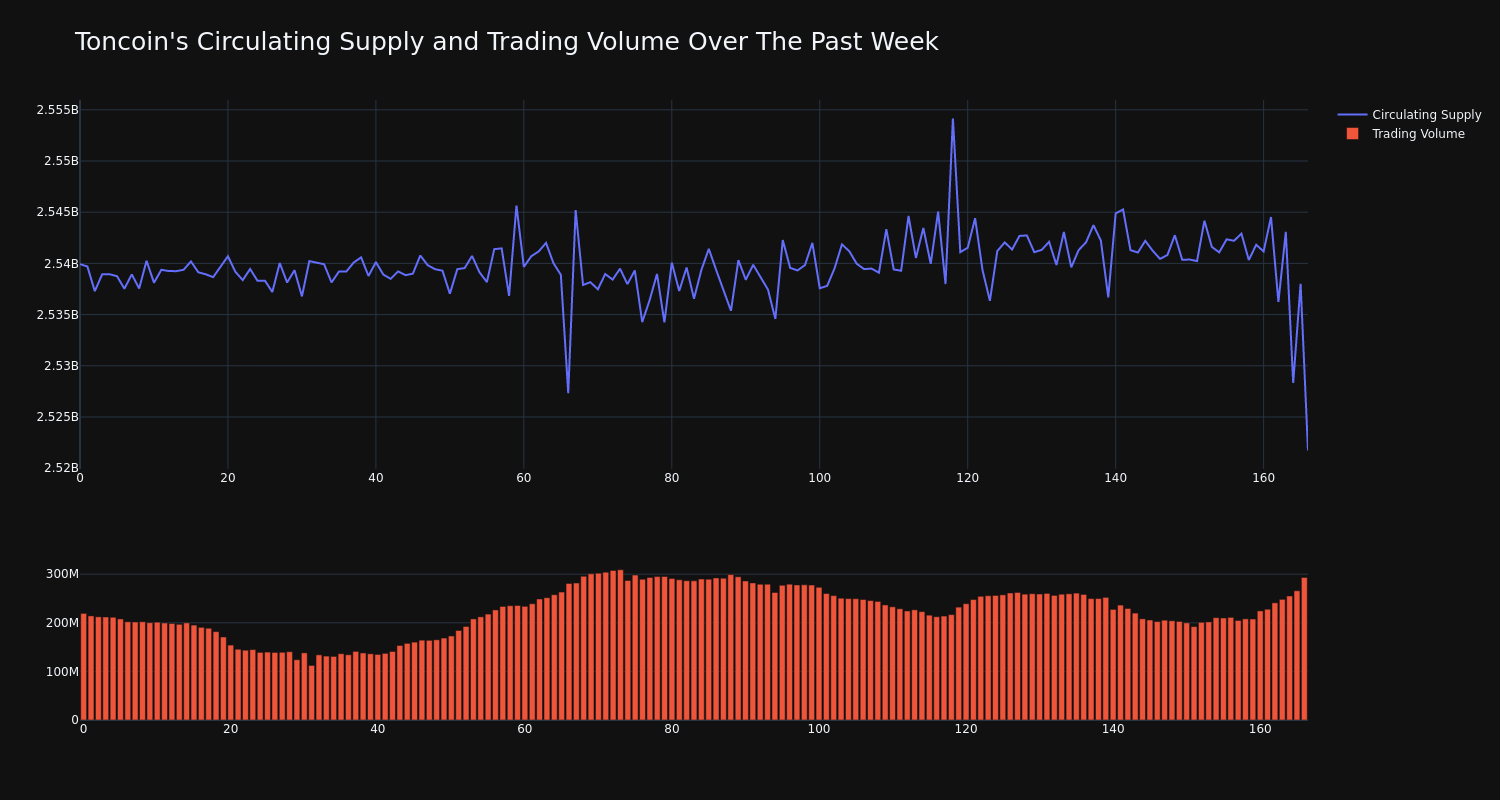
The trading volume for the coin has risen 34.0% over the past week diverging from the circulating supply of the coin, which has decreased 0.72%. This brings the circulating supply to 2.54 billion. According to our data, the current market cap ranking for TON is #11 at $12.53 billion.
This article was generated by Benzinga’s automated content engine and reviewed by an editor.
Market News and Data brought to you by Benzinga APIs
© 2024 Benzinga.com. Benzinga does not provide investment advice. All rights reserved.

