News Classic
News
See all


6 days ago
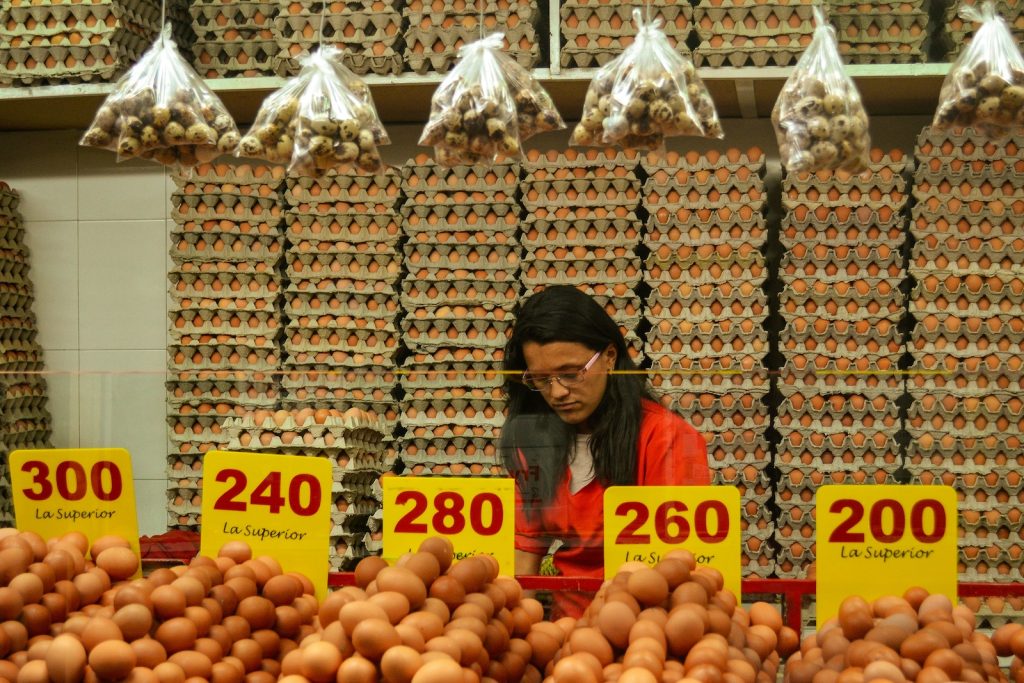
Egg Prices Soar as Outdated Supply Chains Crack Under Pressure
By Jack Buffington There may be no kitchen table issue in America more critical than the price of food. So when the price of eggs rose over 40% from 2024…
Markets
See all1 week ago


Finance
See all1 week ago

Tech
See all6 days ago