Stoic Equity Partners Announces Latest Acquisition in Arkansas
Daphne, Ala.-based commercial real estate investment group announces the acquisition of a flex industrial complex on Old Wire Road in Springdale, AR.
DAPHNE, Ala., Oct. 24, 2024 /PRNewswire/ — Stoic Equity Partners announced its most recent acquisition of a flex industrial property in Springdale, AR. This is the firm’s fourth asset in the state of Arkansas and first in the NW Arkansas market. The industrial complex, located at 444 Old Wire Rd., is a 94,589-square-foot multi-tenant facility that includes nine buildings comprised of 20 suites.
“We began targeting the NW Arkansas market earlier this year, so we are excited to get this property closed,” said Grant Reaves, Co-Founder and Managing Director of Stoic Equity Partners. “The Old Wire property has a great layout and has been very well maintained, making it a great location for its tenants. The NW Arkansas market is currently expanding at a pace I have not witnessed in some time. The growth around not just Walmart but other large companies headquartered in the area, coupled with the great lifestyle of its residents shall continue to push the market higher in the coming years.”
With this latest acquisition, Stoic Equity Partners continues to broaden its footprint in the Southeast, now owning over 1.1MM SF of commercial space across six states in the Southeast. The firm remains focused on identifying and capitalizing on high-potential investment opportunities within the flex industrial sector.
About Stoic Equity Partners
Stoic Equity Partners is a Daphne, Ala.-based commercial real estate investment firm dedicated to value-added and opportunistic commercial real estate acquisitions and developments throughout the Southeast. Co-founders Jeremy Friedman and Grant Reaves leverage their extensive experience as commercial real estate brokers to manage and sponsor strategic investments.
For more information about Stoic Equity Partners and its approach to real estate investment, please visit stoicEP.com.
Media Contact
Jeremy Friedman
Co-founder and CEO, Stoic Equity Partners
Phone: 251-747-9111
Email: 385348@email4pr.com
Address
2210 Main Street, Ste H
Daphne, AL 36526
![]() View original content to download multimedia:https://www.prnewswire.com/news-releases/stoic-equity-partners-announces-latest-acquisition-in-arkansas-302285372.html
View original content to download multimedia:https://www.prnewswire.com/news-releases/stoic-equity-partners-announces-latest-acquisition-in-arkansas-302285372.html
SOURCE Stoic Equity Partners
Market News and Data brought to you by Benzinga APIs
© 2024 Benzinga.com. Benzinga does not provide investment advice. All rights reserved.
Cancer Awareness: Why Putting Yourself First Isn't Selfish – It's Life-Saving And How This Weed Brand Is Supporting Survivors
Have you ever skipped an appointment because you were too busy? Because you felt guilty about taking time for yourself? Breast Cancer Awareness Month (BCAM) is a global campaign supported by numerous organizations, including the United Nations, observed annually in October that aims to increase awareness about the disease and promote early detection through screenings.
Breast cancer remains the most common cancer in women worldwide, with millions of new cases every year, it’s the leading cause of cancer deaths among women globally.
However, many of these deaths could be prevented through early detection and treatment. Early-stage breast cancer has a 5-year survival rate of 99%, while this number drops significantly for later-stage diagnoses, underscoring the life-saving power of regular check-ups.
- Get Benzinga’s exclusive analysis and the top news about the cannabis industry and markets daily in your inbox for free. Subscribe to our newsletter here. You can’t afford to miss out if you’re serious about the business.
Preventable Deaths
The World Health Organization (WHO) states that early detection and timely treatment are crucial in reducing breast cancer mortality, with survival rates significantly improving in early-stage diagnoses. Access to mammograms and appropriate treatment can increase survival rates by up to 90%. However, socioeconomic barriers often lead women to delay or avoid check-ups.
The Taboo Of Check-Ups
Despite the importance of regular check-ups, many people avoid them due to societal pressures and taboos. In some cultures, discussing health concerns like breast exams can be uncomfortable, and individuals often deprioritize their health in favor of responsibilities like family care or work-life balance.
Why This Is A Gender Issue
Gender inequality plays a role in healthcare costs, as women often face financial barriers due to lower incomes and caregiving responsibilities. In 2020, cancer care in the U.S. cost $183 billion, with breast cancer being a major contributor. These financial challenges disproportionately impact women, making timely access to care more difficult.
Read Also: As Cannabis Use Grows Among Cancer Patients, Federal Agency Highlights Need For Rescheduling
Why Check-Ups Matter
Early detection through routine check-ups can save lives, yet the fear of receiving bad news, time constraints and societal expectations can delay those vital screenings. Health often takes a backseat due to the pressures of daily life—whether it’s balancing work, caregiving, or other responsibilities. It’s essential to recognize that prioritizing one’s health is not selfish – it’s necessary.
To ensure early detection of breast cancer, it’s important to consult your healthcare provider for personalized advice and follow general guidelines from trusted organizations such as the American Cancer Society and WHO. Regular clinical breast exams are essential and monthly self-exams can help detect lumps, skin changes, or other unusual symptoms.
Her Highness’ BOOBYLICIOUS
Her Highness, a women’s cannabis lifestyle brand, is donating 20% of proceeds from its limited-edition BOOBYLICIOUS cannabis-infused pre-rolls to support post-mastectomy reconstruction through My Hope Chest, an organization that provides reconstructive surgery for breast cancer survivors without financial means.

Co-founder Allison Krongard, a breast cancer survivor, says she hopes the initiative will offer healing and support to women on their journey.
This initiative serves as a reminder that taking care of health should be a priority, and supporting causes like BOOBYLICIOUS highlights the importance of healthcare equity and early detection. BOOBYLICIOUS is available at select NY dispensaries.
Read Also: Cannabinoids Show Promising Anti-Cancer Potential Yet Mechanisms Remain Unclear, New Study
Market News and Data brought to you by Benzinga APIs
© 2024 Benzinga.com. Benzinga does not provide investment advice. All rights reserved.
Alphabet Q3 Earnings Won't Be Catalyst Google Investors Are Hoping For, But Stock Still An 'Attractive' Buy, Analyst Says
Wedbush analyst Scott Devitt has reiterated an Outperform rating and $205 price target on Alphabet Inc. GOOG ahead of earnings on Oct. 29. Here’s what you need to know.
What To Know: The Wedbush analyst released a new note on Wednesday calling Alphabet an “above average company” with a “below average multiple.”
While Alphabet’s advertising growth estimates for the quarter should be achievable, the potential for significant upside is limited, Devitt said. He pointed to mixed feedback from Wedbush’s third-quarter Digital Advertising Survey and recent data from Skai that showed a slowdown in Google Search growth.
Additionally, competitive pressure from Amazon.com Inc’s AMZN Prime Video ads and increased digital video ad inventory could weigh on YouTube’s performance, the analyst said. Devitt expects both Google Search and YouTube Ads to grow by 11.5% year-over-year, though YouTube’s growth may slightly miss consensus estimates, he said.
“Sentiment is mixed for Alphabet relative to mega cap internet peers as investors continue to weigh potential regulatory headwinds and the risk of generative AI to the search business,” the analyst said.
See Also: Hong Kong Bans WhatsApp And Google Drive On Civil Servants’ Work Computers Citing Security Concerns
Devitt also highlighted regulatory risks surrounding Alphabet, particularly the ongoing Justice Department case related to search. He said any major business model impact from these cases is likely years away, but noted that key dates are approaching.
While these challenges create headline risk, the components of Google’s adtech business under scrutiny represent less than 8% of gross revenue and just 2% of operating profit, Devitt said.
Despite these risks, Devitt remains optimistic about Alphabet’s transition to generative AI in search, which has shown promising user engagement. He believes this shift will create new monetization opportunities over time. With Alphabet trading at a valuation below the S&P 500 and its mega-cap peers, Devitt reiterated an Outperform rating heading into earnings next week.
“While we don’t view the upcoming quarterly report as a likely catalyst for Alphabet, we do think shares are attractive at current levels with shares trading below the market multiple,” the Wedbush analyst said.
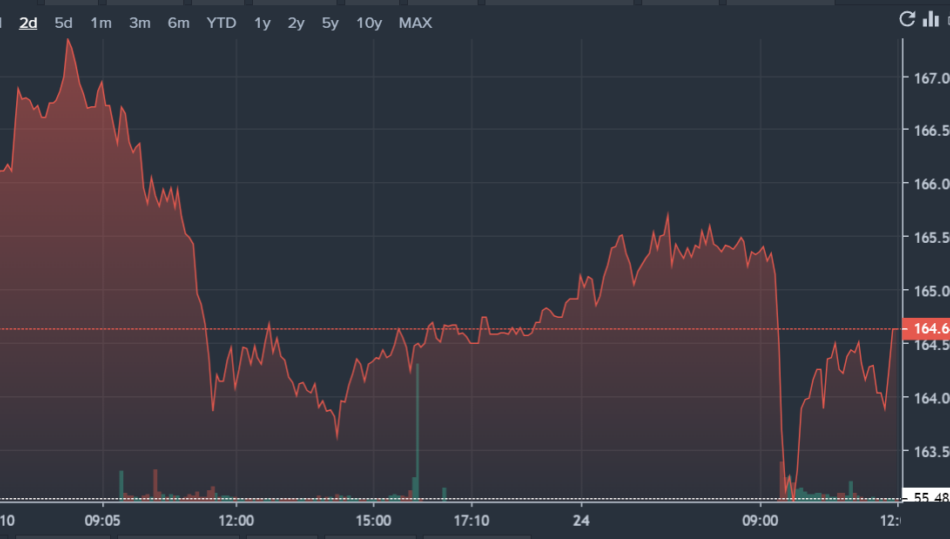
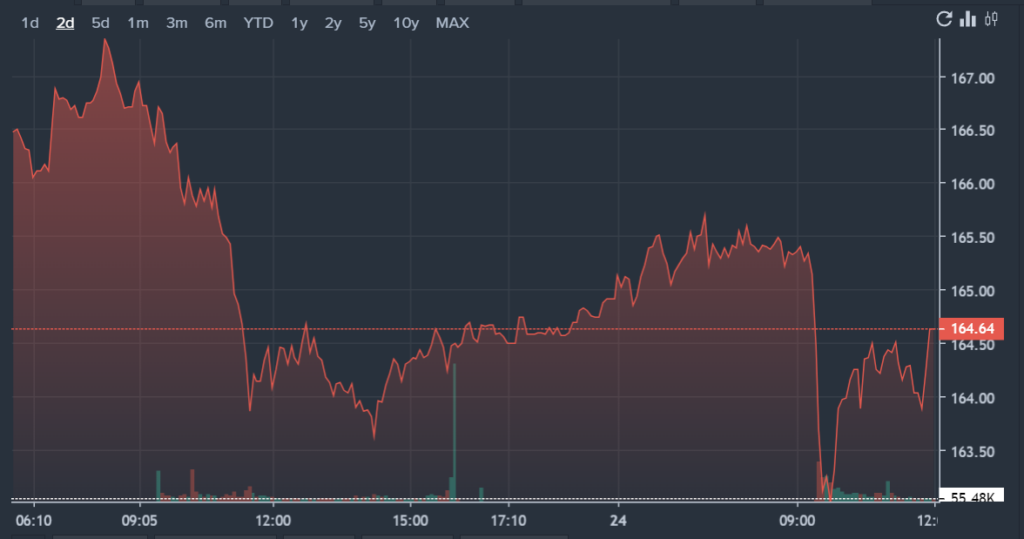
GOOG Price Action: Alphabet shares were up 0.12% at $164.66 at the time of writing Thursday, according to Benzinga Pro.
Read Next
Photo: Pixie Me via Shutterstock.
Market News and Data brought to you by Benzinga APIs
© 2024 Benzinga.com. Benzinga does not provide investment advice. All rights reserved.
An Overview of Sensient Technologies's Earnings
Sensient Technologies SXT is gearing up to announce its quarterly earnings on Friday, 2024-10-25. Here’s a quick overview of what investors should know before the release.
Analysts are estimating that Sensient Technologies will report an earnings per share (EPS) of $0.80.
Sensient Technologies bulls will hope to hear the company announce they’ve not only beaten that estimate, but also to provide positive guidance, or forecasted growth, for the next quarter.
New investors should note that it is sometimes not an earnings beat or miss that most affects the price of a stock, but the guidance (or forecast).
Performance in Previous Earnings
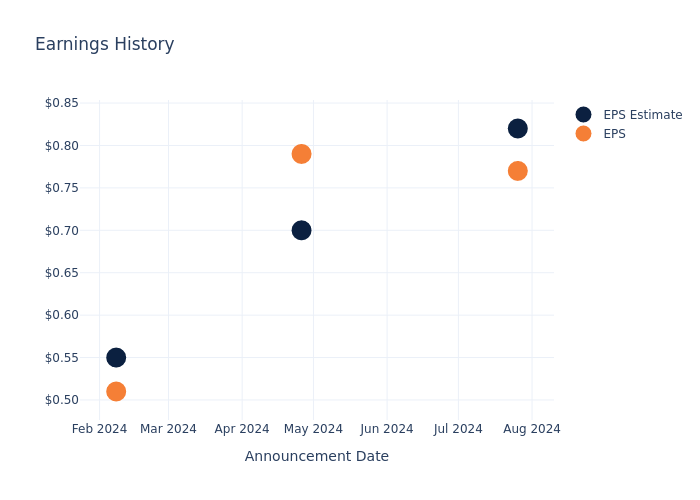
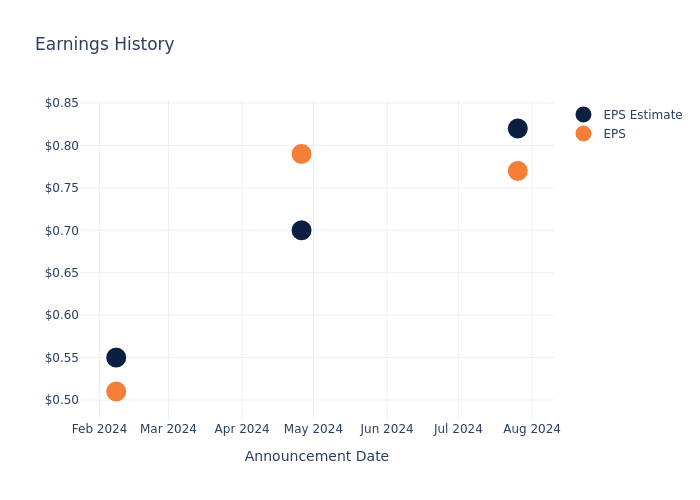
In the previous earnings release, the company missed EPS by $0.05, leading to a 0.0% drop in the share price the following trading session.
Here’s a look at Sensient Technologies’s past performance and the resulting price change:
| Quarter | Q2 2024 | Q1 2024 | Q4 2023 | Q3 2023 |
|---|---|---|---|---|
| EPS Estimate | 0.82 | 0.70 | 0.55 | 0.75 |
| EPS Actual | 0.77 | 0.79 | 0.51 | 0.75 |
| Price Change % | -5.0% | 1.0% | -4.0% | 2.0% |
Performance of Sensient Technologies Shares
Shares of Sensient Technologies were trading at $77.09 as of October 23. Over the last 52-week period, shares are up 37.79%. Given that these returns are generally positive, long-term shareholders should be satisfied going into this earnings release.
Analyst Views on Sensient Technologies
For investors, grasping market sentiments and expectations in the industry is vital. This analysis explores the latest insights regarding Sensient Technologies.
With 1 analyst ratings, Sensient Technologies has a consensus rating of Outperform. The average one-year price target is $85.0, indicating a potential 10.26% upside.
Analyzing Ratings Among Peers
The below comparison of the analyst ratings and average 1-year price targets of Quaker Houghton, Ashland and Avient, three prominent players in the industry, gives insights for their relative performance expectations and market positioning.
- For Quaker Houghton, analysts project an Buy trajectory, with an average 1-year price target of $192.5, indicating a potential 149.71% upside.
- Ashland is maintaining an Neutral status according to analysts, with an average 1-year price target of $97.0, indicating a potential 25.83% upside.
- Avient received a Outperform consensus from analysts, with an average 1-year price target of $55.0, implying a potential 28.65% downside.
Comprehensive Peer Analysis Summary
Within the peer analysis summary, vital metrics for Quaker Houghton, Ashland and Avient are presented, shedding light on their respective standings within the industry and offering valuable insights into their market positions and comparative performance.
| Company | Consensus | Revenue Growth | Gross Profit | Return on Equity |
|---|---|---|---|---|
| Sensient Technologies | Outperform | 7.80% | $130.72M | 2.92% |
| Quaker Houghton | Buy | -6.43% | $175.72M | 2.50% |
| Ashland | Neutral | -0.37% | $186M | 0.20% |
| Avient | Outperform | 3.07% | $257.60M | 1.45% |
Key Takeaway:
Sensient Technologies ranks first in Revenue Growth among its peers. It also leads in Gross Profit margin. However, it ranks second in Consensus rating and third in Return on Equity.
Discovering Sensient Technologies: A Closer Look
Sensient Technologies Corp manufactures and markets natural and synthetic colors, flavors, and other specialty ingredients. The company has a widespread network of facilities around the globe, and its customers operate across a variety of end markets. Sensient’s offerings are predominantly applied to consumer-facing products, including food and beverage, cosmetics and pharmaceuticals, nutraceuticals, and personal care industries. The company’s principal products are flavors, flavor enhancers, ingredients, extracts, and bionutrients, essential oils, dehydrated vegetables and other food ingredients, natural and synthetic food and beverage colors, and others. The company’s three reportable segments were the Flavors & Extracts Group, the Color Group, and the Asia Pacific Group.
Sensient Technologies: A Financial Overview
Market Capitalization Analysis: Positioned below industry benchmarks, the company’s market capitalization faces constraints in size. This could be influenced by factors such as growth expectations or operational capacity.
Positive Revenue Trend: Examining Sensient Technologies’s financials over 3 months reveals a positive narrative. The company achieved a noteworthy revenue growth rate of 7.8% as of 30 June, 2024, showcasing a substantial increase in top-line earnings. In comparison to its industry peers, the company stands out with a growth rate higher than the average among peers in the Materials sector.
Net Margin: Sensient Technologies’s financial strength is reflected in its exceptional net margin, which exceeds industry averages. With a remarkable net margin of 7.67%, the company showcases strong profitability and effective cost management.
Return on Equity (ROE): Sensient Technologies’s financial strength is reflected in its exceptional ROE, which exceeds industry averages. With a remarkable ROE of 2.92%, the company showcases efficient use of equity capital and strong financial health.
Return on Assets (ROA): The company’s ROA is a standout performer, exceeding industry averages. With an impressive ROA of 1.55%, the company showcases effective utilization of assets.
Debt Management: With a below-average debt-to-equity ratio of 0.63, Sensient Technologies adopts a prudent financial strategy, indicating a balanced approach to debt management.
To track all earnings releases for Sensient Technologies visit their earnings calendar on our site.
This article was generated by Benzinga’s automated content engine and reviewed by an editor.
© 2024 Benzinga.com. Benzinga does not provide investment advice. All rights reserved.
A Closer Look at Intellia Therapeutics's Options Market Dynamics
Investors with a lot of money to spend have taken a bearish stance on Intellia Therapeutics NTLA.
And retail traders should know.
We noticed this today when the trades showed up on publicly available options history that we track here at Benzinga.
Whether this is an institution or just a wealthy individual, we don’t know. But when something this big happens with NTLA, it often means somebody knows something is about to happen.
Today, Benzinga’s options scanner spotted 19 options trades for Intellia Therapeutics.
This isn’t normal.
The overall sentiment of these big-money traders is split between 0% bullish and 89%, bearish.
Out of all of the options we uncovered, 18 are puts, for a total amount of $944,718, and there was 1 call, for a total amount of $25,000.
Projected Price Targets
Based on the trading activity, it appears that the significant investors are aiming for a price territory stretching from $17.5 to $20.0 for Intellia Therapeutics over the recent three months.
Analyzing Volume & Open Interest
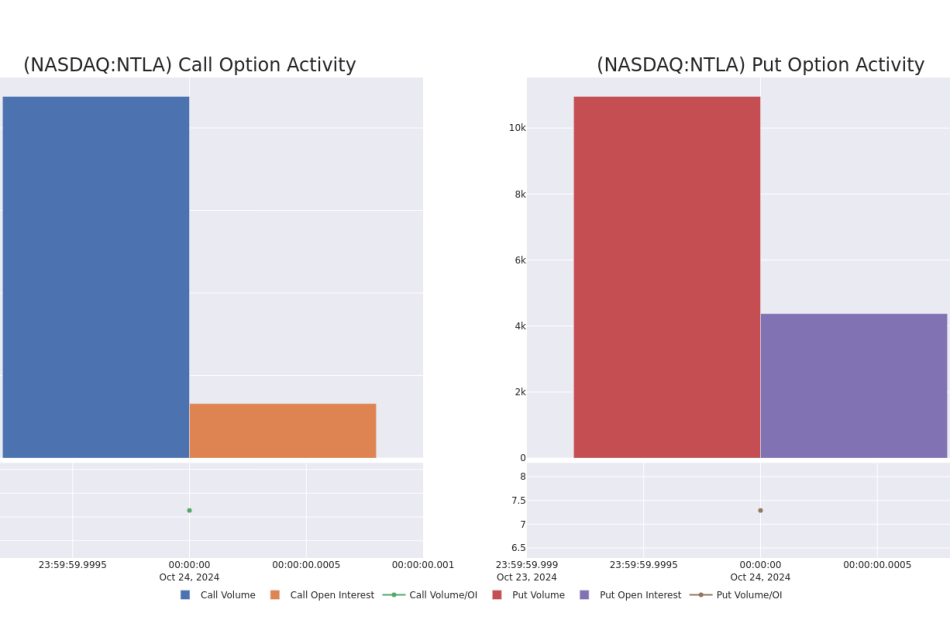
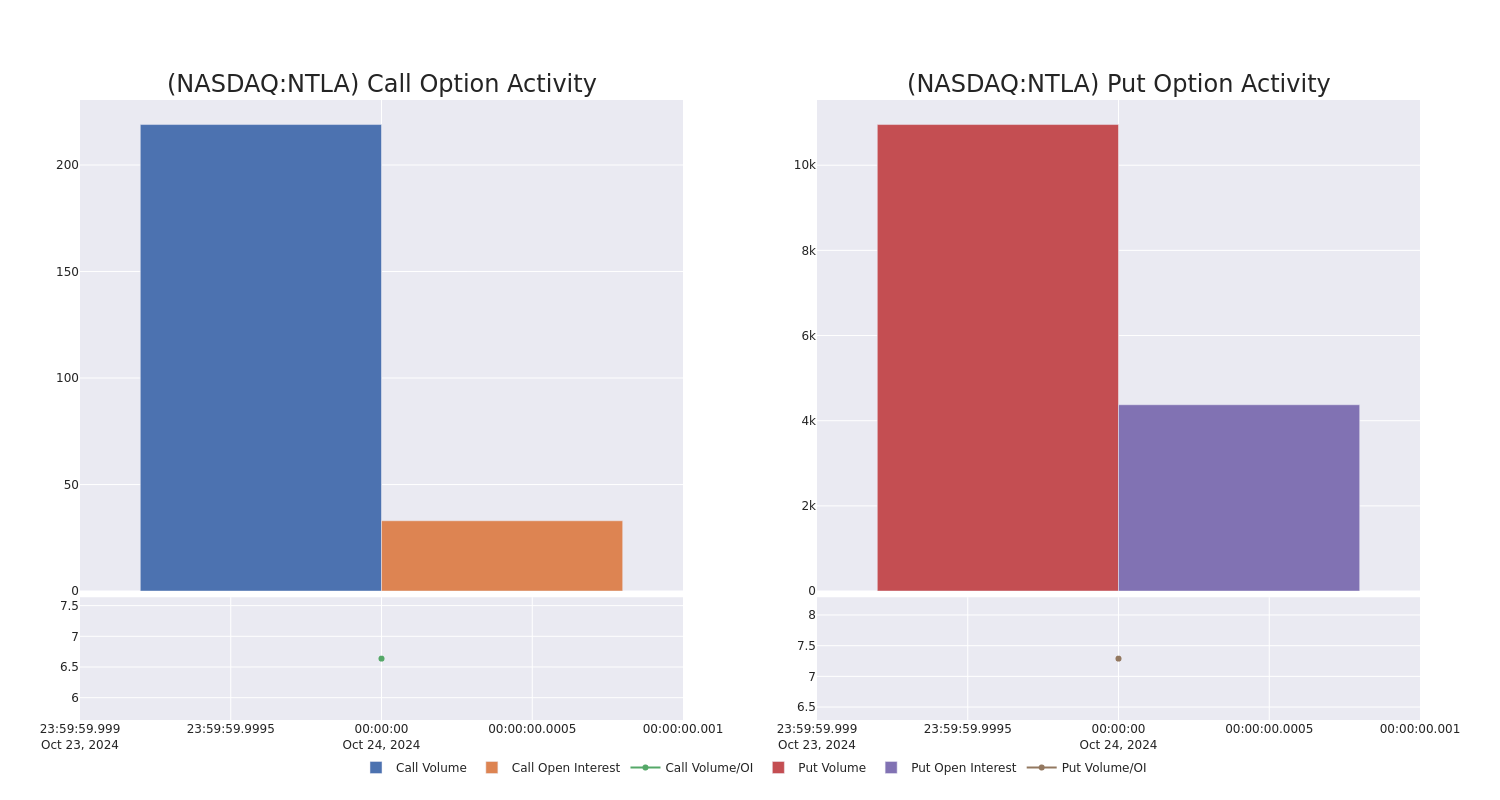
Looking at the volume and open interest is a powerful move while trading options. This data can help you track the liquidity and interest for Intellia Therapeutics’s options for a given strike price. Below, we can observe the evolution of the volume and open interest of calls and puts, respectively, for all of Intellia Therapeutics’s whale trades within a strike price range from $17.5 to $20.0 in the last 30 days.
Intellia Therapeutics Option Volume And Open Interest Over Last 30 Days
Noteworthy Options Activity:
| Symbol | PUT/CALL | Trade Type | Sentiment | Exp. Date | Ask | Bid | Price | Strike Price | Total Trade Price | Open Interest | Volume |
|---|---|---|---|---|---|---|---|---|---|---|---|
| NTLA | PUT | TRADE | BEARISH | 11/15/24 | $4.7 | $3.7 | $4.4 | $20.00 | $132.0K | 1.1K | 340 |
| NTLA | PUT | TRADE | BEARISH | 01/17/25 | $3.7 | $3.4 | $3.65 | $17.50 | $73.0K | 1.8K | 1.3K |
| NTLA | PUT | SWEEP | NEUTRAL | 01/17/25 | $3.7 | $3.6 | $3.65 | $17.50 | $73.0K | 1.8K | 805 |
| NTLA | PUT | SWEEP | BEARISH | 01/17/25 | $3.6 | $3.4 | $3.6 | $17.50 | $72.0K | 1.8K | 505 |
| NTLA | PUT | SWEEP | BEARISH | 01/17/25 | $5.3 | $5.0 | $5.3 | $20.00 | $53.0K | 1.3K | 753 |
About Intellia Therapeutics
Intellia Therapeutics is a gene editing company focused on the development of Crispr/Cas9-based therapeutics. Crispr/Cas9 stands for Clustered Regularly Interspaced Short Palindromic Repeats (Crispr)/Crispr-associated protein 9 (Cas9), which is a revolutionary technology for precisely altering specific sequences of genomic DNA. Intellia is focused on using this technology to treat genetically defined diseases. It’s evaluating multiple gene editing approaches using in vivo and ex vivo therapies to address diseases with high unmet medical needs, including ATTR amyloidosis, hereditary angioedema, sickle cell disease, and immuno-oncology. Intellia has formed collaborations with several companies to advance its pipeline, including narrow-moat Regeneron and wide-moat Novartis.
In light of the recent options history for Intellia Therapeutics, it’s now appropriate to focus on the company itself. We aim to explore its current performance.
Current Position of Intellia Therapeutics
- With a trading volume of 7,786,070, the price of NTLA is down by -12.24%, reaching $17.5.
- Current RSI values indicate that the stock is may be oversold.
- Next earnings report is scheduled for 14 days from now.
Unusual Options Activity Detected: Smart Money on the Move
Benzinga Edge’s Unusual Options board spots potential market movers before they happen. See what positions big money is taking on your favorite stocks. Click here for access.
Options are a riskier asset compared to just trading the stock, but they have higher profit potential. Serious options traders manage this risk by educating themselves daily, scaling in and out of trades, following more than one indicator, and following the markets closely.
If you want to stay updated on the latest options trades for Intellia Therapeutics, Benzinga Pro gives you real-time options trades alerts.
Market News and Data brought to you by Benzinga APIs
© 2024 Benzinga.com. Benzinga does not provide investment advice. All rights reserved.
A Closer Look at Intellia Therapeutics's Options Market Dynamics
Investors with a lot of money to spend have taken a bearish stance on Intellia Therapeutics NTLA.
And retail traders should know.
We noticed this today when the trades showed up on publicly available options history that we track here at Benzinga.
Whether this is an institution or just a wealthy individual, we don’t know. But when something this big happens with NTLA, it often means somebody knows something is about to happen.
Today, Benzinga’s options scanner spotted 19 options trades for Intellia Therapeutics.
This isn’t normal.
The overall sentiment of these big-money traders is split between 0% bullish and 89%, bearish.
Out of all of the options we uncovered, 18 are puts, for a total amount of $944,718, and there was 1 call, for a total amount of $25,000.
Projected Price Targets
Based on the trading activity, it appears that the significant investors are aiming for a price territory stretching from $17.5 to $20.0 for Intellia Therapeutics over the recent three months.
Analyzing Volume & Open Interest
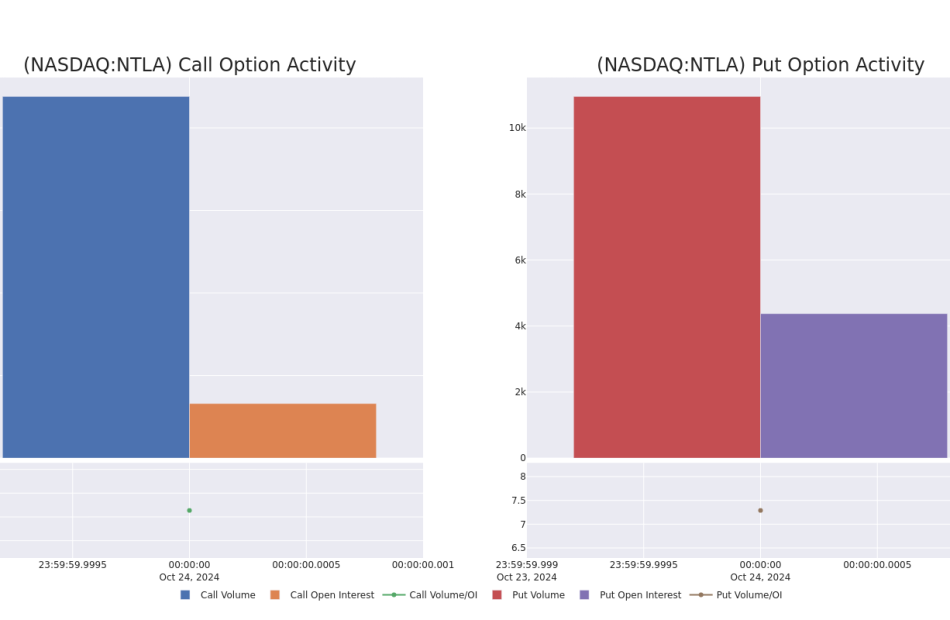
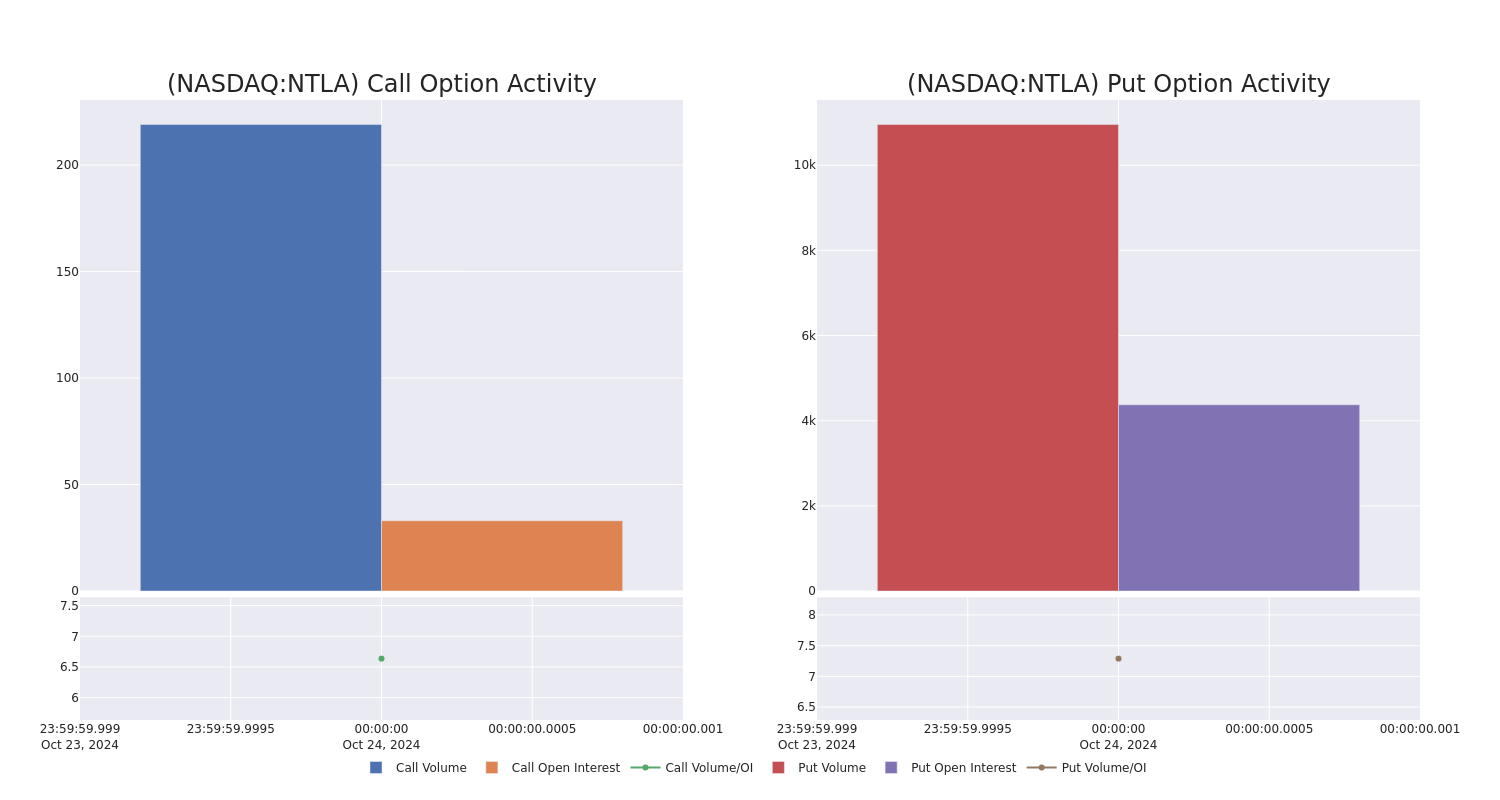
Looking at the volume and open interest is a powerful move while trading options. This data can help you track the liquidity and interest for Intellia Therapeutics’s options for a given strike price. Below, we can observe the evolution of the volume and open interest of calls and puts, respectively, for all of Intellia Therapeutics’s whale trades within a strike price range from $17.5 to $20.0 in the last 30 days.
Intellia Therapeutics Option Volume And Open Interest Over Last 30 Days
Noteworthy Options Activity:
| Symbol | PUT/CALL | Trade Type | Sentiment | Exp. Date | Ask | Bid | Price | Strike Price | Total Trade Price | Open Interest | Volume |
|---|---|---|---|---|---|---|---|---|---|---|---|
| NTLA | PUT | TRADE | BEARISH | 11/15/24 | $4.7 | $3.7 | $4.4 | $20.00 | $132.0K | 1.1K | 340 |
| NTLA | PUT | TRADE | BEARISH | 01/17/25 | $3.7 | $3.4 | $3.65 | $17.50 | $73.0K | 1.8K | 1.3K |
| NTLA | PUT | SWEEP | NEUTRAL | 01/17/25 | $3.7 | $3.6 | $3.65 | $17.50 | $73.0K | 1.8K | 805 |
| NTLA | PUT | SWEEP | BEARISH | 01/17/25 | $3.6 | $3.4 | $3.6 | $17.50 | $72.0K | 1.8K | 505 |
| NTLA | PUT | SWEEP | BEARISH | 01/17/25 | $5.3 | $5.0 | $5.3 | $20.00 | $53.0K | 1.3K | 753 |
About Intellia Therapeutics
Intellia Therapeutics is a gene editing company focused on the development of Crispr/Cas9-based therapeutics. Crispr/Cas9 stands for Clustered Regularly Interspaced Short Palindromic Repeats (Crispr)/Crispr-associated protein 9 (Cas9), which is a revolutionary technology for precisely altering specific sequences of genomic DNA. Intellia is focused on using this technology to treat genetically defined diseases. It’s evaluating multiple gene editing approaches using in vivo and ex vivo therapies to address diseases with high unmet medical needs, including ATTR amyloidosis, hereditary angioedema, sickle cell disease, and immuno-oncology. Intellia has formed collaborations with several companies to advance its pipeline, including narrow-moat Regeneron and wide-moat Novartis.
In light of the recent options history for Intellia Therapeutics, it’s now appropriate to focus on the company itself. We aim to explore its current performance.
Current Position of Intellia Therapeutics
- With a trading volume of 7,786,070, the price of NTLA is down by -12.24%, reaching $17.5.
- Current RSI values indicate that the stock is may be oversold.
- Next earnings report is scheduled for 14 days from now.
Unusual Options Activity Detected: Smart Money on the Move
Benzinga Edge’s Unusual Options board spots potential market movers before they happen. See what positions big money is taking on your favorite stocks. Click here for access.
Options are a riskier asset compared to just trading the stock, but they have higher profit potential. Serious options traders manage this risk by educating themselves daily, scaling in and out of trades, following more than one indicator, and following the markets closely.
If you want to stay updated on the latest options trades for Intellia Therapeutics, Benzinga Pro gives you real-time options trades alerts.
Market News and Data brought to you by Benzinga APIs
© 2024 Benzinga.com. Benzinga does not provide investment advice. All rights reserved.
Analyst Report: NextEra Energy Inc
Summary
Headquartered in Juno Beach, Florida, NextEra Energy provides generation, transmission, and distribution services. NEE has about 37,000 MW of total generating capacity, and about one-third of electricity is contributed by renewable wind and solar sources. The company also operates seven nuclear plants.
The company’s largest electric utility is FPL, one of the largest vertically integrated electric utilities in the U.S., with approximately 5.8 million customer accounts that generate about two-thirds of earnings. NEER, a nonregulated subsidiary, is the largest U.S. generator of wind and solar power and a leader in battery storage and renewable infrastructure. Its affiliated entities include NextEra Energy Partners LP, which trades as NEP. Argus Research does not cover NEP.
The company’s focus is on electricity and renewable generation. In 2023, it sold its Texas and Pennsylvania pipeline businesses and its gas utility, FCG. NextEra Energy has a generation presence in 38 states and four Canadian provinces, and is ahead of many peers in the use of renewable
Upgrade to begin using premium research reports and get so much more.
Exclusive reports, detailed company profiles, and best-in-class trade insights to take your portfolio to the next level
Pinnacle Bankshares Corporation Announces 3rd Quarter/Year to Date 2024 Earnings
ALTAVISTA, Va., Oct. 24, 2024 (GLOBE NEWSWIRE) — Net income for Pinnacle Bankshares Corporation PPBN, the one-bank holding company (the “Company” or “Pinnacle”) for First National Bank (the “Bank”), was $2,085,000, or $0.94 per basic and diluted share, for the third quarter of 2024, while net income for the nine months ended September 30, 2024 was $6,377,000, or $2.88 per basic and diluted share. In comparison, net income was $2,794,000, or $1.27 per basic and diluted share, and $7,483,000, or $3.41 per basic and diluted share, respectively, for the same periods of 2023. Consolidated results for the quarter and the nine-month periods are unaudited.
| Third Quarter & 2024 Year-to-Date Highlights |
| Income Statement comparisons are to the third quarter and first nine months of 2023 |
| Balance Sheet, Capital Ratios, and Stock Price comparisons are to December 31, 2023 |
Income Statement
- Third Quarter Net Income decreased 3% and Year-to-Date Net Income decreased 7%, excluding Bank Owned Life Insurance (BOLI) proceeds of $638,000 received in 2023.
Through nine months:
- Return on Assets was 0.86%.
- Net Interest Margin increased 15 basis points to 3.68%.
- Net Interest Income increased $1,368,000, or 5.5%.
- Provision for Credit Losses increased $330,000 due primarily to loan growth. Asset Quality remains strong with low Nonperforming Loans and no Other Real Estate Owned (OREO).
- Noninterest Income increased $229,000, or 4.6%, excluding BOLI proceeds, driven by higher fees from Merchant Card Processing and Sales of Mortgage Loans.
- Noninterest Expense increased $1,857,000, or 9%, due primarily to higher Core Operating System expenses and Salaries and Employee Benefits.
Balance Sheet
- Cash and Cash Equivalents increased $18.4 million, or 21%.
- Loans increased $37.5 million, or 6%.
- Securities decreased $51.6 million, or 22%, due to maturing U.S. Treasury Notes. The Securities Portfolio is relatively short term in nature with $61 million in U.S. Treasury Notes maturing during the next seven months providing liquidity, funding, and optionality.
- Total Assets decreased less than 1% due to a decline in Deposits.
- Deposits decreased 1%; however, Deposit Accounts have grown 3.5%.
- Liquidity is strong at 34% and 12% excluding Available for Sale Securities.
Capital Ratios & Stock Price
- The Bank’s Leverage Ratio increased to 9.21% due primarily to profitability.
- Total Risk Based Capital Ratio decreased slightly to 13.53% due to loan growth.
- Pinnacle’s Stock Price ended the quarter at $29.73 per share, based on the last trade, which is an increase of $5.72, or 24%. Total Return was 26.95% through nine months.
Net Income and Profitability
Net income generated during the third quarter of 2024 represents a $71,000, or 3%, decrease as compared to the same time period of 2023, net of $638,000 in BOLI proceeds, while net income generated for the nine months of 2024 represents a $468,000, or 7%, decrease as compared to the prior year, net of BOLI proceeds. The decrease in net income for the third quarter and year-to-date 2024 was driven by higher provision for loan losses and noninterest expense, partially offset by higher net interest income and noninterest income, net of BOLI proceeds.
Profitability as measured by the Company’s return on average assets (“ROA”) decreased to 0.86% for the nine months ended September 30, 2024, as compared to 1.02% for the same time period of 2023. Correspondingly, return on average equity (“ROE”) decreased to 11.76% for the nine months ended September 30, 2024, as compared to 16.44% for the same time period of 2023.
“We are pleased that Pinnacle’s performance through nine months of 2024 is tracking closely to 2023,” stated Aubrey H. Hall, III, President and Chief Executive Officer for both the Company and the Bank. He further commented, “Our Company is in a solid position with ample funding, an expanding net interest margin, and strong asset quality.”
Net Interest Income and Margin
The Company generated $8,941,000 in net interest income for the third quarter of 2024, which represents a $707,000, or 8.5%, increase as compared to $8,234,000 for the third quarter of 2023. Interest income increased $1,615,000, or 15%, due to higher yields on earning assets and increased loan volume, while interest expense increased $908,000, or 38%, due to higher interest rates paid on deposits and increased certificates of deposit volume.
The Company generated $26,169,000 in net interest income through nine months of 2024, which represents a $1,368,000, or 5.5%, increase as compared to $24,801,000 for the same time period of 2023. Interest income increased $4,341,000, or 14%, as yield on earning assets increased 55 basis points to 4.94%. Interest expense increased $2,973,000, or 49%, due to higher interest rates paid on deposits as cost to fund earning assets increased 40 basis points to 1.26%. Net interest margin increased to 3.68% for the nine months of 2024 from 3.53% for the same time period of 2023.
Reserves for Credit Losses and Asset Quality
The provision for credit losses was $136,000 in the third quarter of 2024 as compared to $4,000 in the third quarter of 2023. Through nine months of 2024, the provision for credit losses was $396,000 as compared to $66,000 for the same time period of 2023. Provision expense has increased as a result of higher loan volume and recent trends in economic indicators.
The allowance for credit losses (ACL) was $4,795,000 as of September 30, 2024, which represented 0.71% of total loans outstanding. In comparison, the ACL was $4,511,000 or 0.70% of total loans outstanding as of December 31, 2023. Non-performing loans to total loans decreased to 0.14% as of September 30, 2024, compared to 0.24% as of year-end 2023. ACL coverage of non-performing loans was 502% as of September 30, 2024, compared to 290% as of year-end 2023. Management views the allowance balance as being sufficient to offset potential future losses in the loan portfolio.
Noninterest Income and Expense
Noninterest income for the third quarter of 2024 increased $94,000, or 5.6%, to $1,763,000 as compared to $1,669,000, net of BOLI proceeds, for the third quarter of 2023. The increase was primarily due to a $76,000 increase in fees generated from sales of mortgage loans, a $30,000 increase in merchant card fees, and a $16,000 increase in service charges on loan accounts.
Noninterest income through nine months of 2024 increased $229,000, or 4.6%, to $5,198,000 as compared to $4,969,000 for the same time period in 2023, net of BOLI proceeds. The increase was mainly due to a $103,000 increase in merchant card processing fees, a $53,000 increase in fees generated from sales of mortgage loans, a $41,000 increase in service charges on loan accounts, and a $33,000 increase in in commissions and fees from sales of investment and insurance products.
Noninterest expense for the third quarter of 2024 increased $753,000, or 10%, to $7,961,000 as compared to $7,208,000 for the third quarter of 2023. The increase was primarily due to a $332,000 increase in salary and benefits, a $179,000 increase in core operating system expenses, and an $81,000 increase in occupancy expense.
Noninterest expense through nine months of 2024 increased $1,857,000, or 9%, to $23,044,000 as compared to $21,187,000 for the same time period of 2023. The increase was mainly due to a $694,000 increase in core operating system expenses, a $448,000 increase in salary and benefits, a $138,000 increase in occupancy expense, and a $109,000 increase dealer loan expenses.
The Balance Sheet and Liquidity
Total assets as of September 30, 2024, were $1,015,994,000, down less than 1% from $1,016,528,000 as of December 31, 2023. The principal components of the Company’s assets as of September 30, 2024, were $678,893,000 in total loans, $182,010,000 in securities, and $106,009,000 in cash and cash equivalents. Through nine months of 2024, total loans have increased $37,456,000, or 6%, from $641,437,000, securities have decreased $51,569,000, or 22%, from $233,579,000, and cash and cash equivalents have increased $18,420,000, or 21%, from $87,589,000.00.
The majority of the Company’s securities portfolio is relatively short-term in nature. Forty-eight percent (48%) of the Company’s securities portfolio is invested in U.S. Treasury Notes having an average maturity of 1.22 years with $61,000,000 maturing during the next seven months. The Company’s entire securities portfolio was classified as available for sale on September 30, 2024, which provides transparency regarding unrealized losses. Unrealized losses associated within the available for sale securities portfolio were $9,915,000 as of September 30, 2024, or five percent (5%) of book value, an improvement from $14,943,000 as of December 31, 2023.
The Company had a strong liquidity ratio of 34% as of September 30, 2024. The liquidity ratio excluding the available for sale securities portfolio was 12% providing the opportunity to sell excess funds at an attractive federal funds rate. The Company has access to multiple liquidity lines of credit through its correspondent banking relationships and the Federal Home Loan Bank. None of these contingency funding sources have been utilized.
Total liabilities as of September 30, 2024, were $938,622,000, down $9,501,000, or 1%, from $948,123,000 as of December 31, 2023, as deposits have decreased $11,081,000, or 1%, through nine months of 2024 to $921,363,000 from $932,444,000. First National Bank’s number of deposit accounts increased 3.5% during the same time period as the Bank has benefited from the closures of large national bank branches and bank mergers within markets served along with its reputation for providing extraordinary customer service.
Total stockholders’ equity as of September 30, 2024, was $77,372,000 and consisted primarily of $66,787,000 in retained earnings. In comparison, as of December 31, 2023 total stockholders’ equity was $68,405,000. The increase in stockholders’ equity is due primarily to 2024 profitability and an increase in the market value of the securities portfolio and pension assets. Both the Company and Bank remain “well capitalized” per all regulatory definitions.
Loan Production Office and New Branch in South Boston
On July 15, 2024, First National Bank announced plans to open a Loan Production Office (LPO) and a Full-Service Branch in Halifax County, Virginia. Since this announcement, an experienced team of bankers has been hired and the LPO has opened at 97A Main Street, South Boston, Virginia. Additionally, regulatory approval has been received for the branch, which has temporarily opened at the same location. The permanent branch will open at 4027 Halifax Road, South Boston, Virginia later this year.
Company Information
Pinnacle Bankshares Corporation is a locally managed community banking organization serving Central and Southern Virginia. The one-bank holding company of First National Bank serves market areas consisting primarily of all or portions of the Counties of Amherst, Bedford, Campbell, Halifax, and Pittsylvania, and the Cities of Charlottesville, Danville and Lynchburg. The Company has a total of eighteen branches with one branch in Amherst County within the Town of Amherst, two branches in Bedford County; five branches in Campbell County, including two within the Town of Altavista, where the Bank was founded; one branch in the City of Charlottesville, three branches in the City of Danville; three branches in the City of Lynchburg; and three branches in Pittsylvania County, including one within the Town of Chatham. A Loan Production Office and a temporary full-service branch have been opened in South Boston, with the Bank having plans to open a permanent full-service branch location in the near future to serve South Boston and the greater Halifax County market. First National Bank is in its 116th year of operation.
Cautionary Statement Regarding Forward-Looking Statements
This press release may contain “forward-looking statements” within the meaning of federal securities laws that involve significant risks and uncertainties. Any statements contained herein that are not historical facts are forward-looking and are based on current assumptions and analysis by the Company. These forward-looking statements, including statements made in Mr. Hall’s quotes may include, but are not limited to, statements regarding the credit quality of our asset portfolio in future periods, the expected losses of nonperforming loans in future periods, returns and capital accretion during future periods, our cost of funds, the maintenance of our net interest margin, future operating results and business performance and our growth initiatives. Although we believe our plans and expectations reflected in these forward-looking statements are reasonable, our ability to predict results or the actual effect of future plans or strategies is inherently uncertain, and we can give no assurance that these plans or expectations will be achieved. Factors that could cause actual results to differ materially from management’s expectations include, but are not limited to: changes in consumer spending and saving habits that may occur, including increased inflation; changes in general business, economic and market conditions; attracting, hiring, training, motivating and retaining qualified employees; changes in fiscal and monetary policies, and laws and regulations; changes in interest rates, inflation rates, deposit flows, loan demand and real estate values; changes in the quality or composition of the Company’s loan portfolio and the value of the collateral securing loans; changes in macroeconomic trends and uncertainty, including liquidity concerns at other financial institutions, and the potential for local and/or global economic recession; changes in demand for financial services in Pinnacle’s market areas; increased competition from both banks and non-banks in Pinnacle’s market areas; a deterioration in credit quality and/or a reduced demand for, or supply of, credit; increased information security risk, including cyber security risk, which may lead to potential business disruptions or financial losses; volatility in the securities markets generally, including in the value of securities in the Company’s securities portfolio or in the market price of Pinnacle common stock specifically; and other factors, which could cause actual results to differ materially from future results expressed or implied by such forward-looking statements. These risks and uncertainties should be considered in evaluating the forward-looking statements contained herein, and you should not place undue reliance on such statements, which reflect our views as of the date of this release.
| Pinnacle Bankshares Corporation Selected Financial Highlights (9/30/24, 6/30/24, and 9/30/23 results unaudited) (In thousands, except rations, share, and per share data) |
||||||||||
| 3 Months Ended | 3 Months Ended | 3 Months Ended | ||||||||
| Income Statement Highlights | 9/30/2024 | 6/30/2024 | 9/30/2023 | |||||||
| Interest Income | $ | 12,262 | $ | 11,754 | $ | 10,647 | ||||
| Interest Expense | 3,321 | 2,936 | 2,413 | |||||||
| Net Interest Income | 8,941 | 8,818 | 8,234 | |||||||
| Provision for Credit Losses | 136 | 242 | 4 | |||||||
| Noninterest Income | 1,763 | 1,812 | 2,307 | |||||||
| Noninterest Expense | 7,961 | 7,681 | 7,208 | |||||||
| Net Income | 2,085 | 2,208 | 2,794 | |||||||
| Earnings Per Share (Basic) | 0.94 | 1.00 | 1.27 | |||||||
| Earnings Per Share (Diluted) | 0.94 | 1.00 | 1.27 | |||||||
| 9 Months Ended | Year Ended | 9 Months Ended | ||||||||
| Income Statement Highlights | 9/30/2024 | 12/31/2023 | 9/30/2023 | |||||||
| Interest Income | $ | 35,200 | $ | 41,888 | $ | 30,859 | ||||
| Interest Expense | 9,031 | 8,716 | 6,058 | |||||||
| Net Interest Income | 26,169 | 33,172 | 24,801 | |||||||
| Provision for Credit Losses | 396 | 70 | 66 | |||||||
| Noninterest Income | 5,198 | 7,964 | 5,607 | |||||||
| Noninterest Expense | 23,044 | 29,280 | 21,187 | |||||||
| Net Income | 6,377 | 9,762 | 7,483 | |||||||
| Earnings Per Share (Basic) | 2.88 | 4.45 | 3.41 | |||||||
| Earnings Per Share (Diluted) | 2.88 | 4.45 | 3.41 | |||||||
| Balance Sheet Highlights | 9/30/2024 | 12/31/2023 | 9/30/2023 | |||||||
| Cash and Cash Equivalents | $ | 106,009 | $ | 87,589 | $ | 87,373 | ||||
| Total Loans | 678,893 | 641,437 | 624,203 | |||||||
| Total Securities | 182,010 | 233,579 | 235,431 | |||||||
| Total Assets | 1,015,994 | 1,016,528 | 996,567 | |||||||
| Total Deposits | 921,363 | 932,444 | 918,269 | |||||||
| Total Liabilities | 938,622 | 948,123 | 933,674 | |||||||
| Stockholders’ Equity | 77,372 | 68,405 | 62,893 | |||||||
| Shares Outstanding | 2,215,020 | 2,198,158 | 2,196,543 | |||||||
| Ratios and Stock Price | 9/30/2024 | 12/31/2023 | 9/30/2023 | |||||||
| Gross Loan-to-Deposit Ratio | 73.68 | % | 68.79 | % | 67.98 | % | ||||
| Net Interest Margin (Year-to-date) | 3.68 | % | 3.52 | % | 3.53 | % | ||||
| Liquidity | 33.61 | % | 37.27 | % | 38.24 | % | ||||
| Efficiency Ratio | 73.47 | % | 71.20 | % | 69.67 | % | ||||
| Return on Average Assets (ROA) | 0.86 | % | 1.00 | % | 1.02 | % | ||||
| Return on Average Equity (ROE) | 11.76 | % | 15.69 | % | 16.44 | % | ||||
| Leverage Ratio (Bank) | 9.21 | % | 8.82 | % | 8.64 | % | ||||
| Tier 1 Capital Ratio (Bank) | 12.84 | % | 12.98 | % | 13.08 | % | ||||
| Total Capital Ratio (Bank) | 13.53 | % | 13.67 | % | 13.79 | % | ||||
| Stock Price | $ | 29.73 | $ | 24.01 | $ | 19.25 | ||||
| Book Value | $ | 34.93 | $ | 31.12 | $ | 28.63 | ||||
| Asset Quality Highlights | 9/30/2024 | 12/31/2023 | 9/30/2023 | |||||||
| Nonaccruing Loans | $ | 956 | $ | 1,557 | $ | 1,859 | ||||
| Loans 90 Days or More Past Due and Accruing | 0 | 0 | 0 | |||||||
| Total Nonperforming Loans | 956 | 1,557 | 1,859 | |||||||
| Loan Modifications | 340 | 357 | 1,025 | |||||||
| Loans Individually Evaluated | 1,296 | 2,287 | 2,884 | |||||||
| Other Real Estate Owned (OREO) (Foreclosed Assets) | 0 | 0 | 0 | |||||||
| Total Nonperforming Assets | 956 | 1,557 | 1,859 | |||||||
| Nonperforming Loans to Total Loans | 0.14 | % | 0.24 | % | 0.30 | % | ||||
| Nonperforming Assets to Total Assets | 0.09 | % | 0.15 | % | 0.19 | % | ||||
| Allowance for Credit Losses | $ | 4,795 | $ | 4,511 | $ | 4,474 | ||||
| Allowance for Credit Losses to Total Loans | 0.71 | % | 0.70 | % | 0.72 | % | ||||
| Allowance for Credit Losses to Nonperforming Loans | 502 | % | 290 | % | 241 | % | ||||

© 2024 Benzinga.com. Benzinga does not provide investment advice. All rights reserved.


