Spotlight on ServiceNow: Analyzing the Surge in Options Activity
Financial giants have made a conspicuous bullish move on ServiceNow. Our analysis of options history for ServiceNow NOW revealed 38 unusual trades.
Delving into the details, we found 39% of traders were bullish, while 28% showed bearish tendencies. Out of all the trades we spotted, 8 were puts, with a value of $394,047, and 30 were calls, valued at $2,480,134.
Expected Price Movements
After evaluating the trading volumes and Open Interest, it’s evident that the major market movers are focusing on a price band between $520.0 and $1000.0 for ServiceNow, spanning the last three months.
Insights into Volume & Open Interest
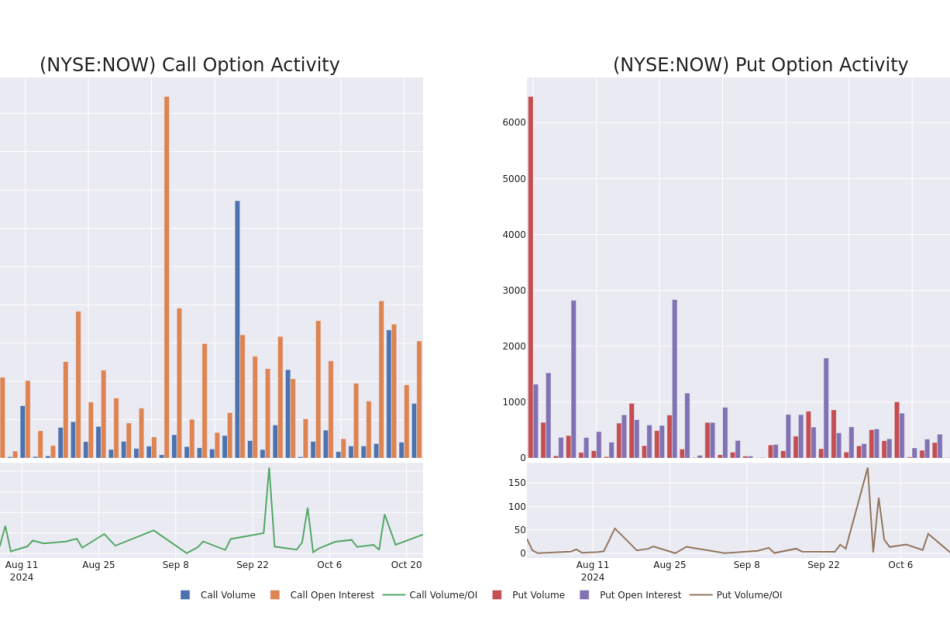
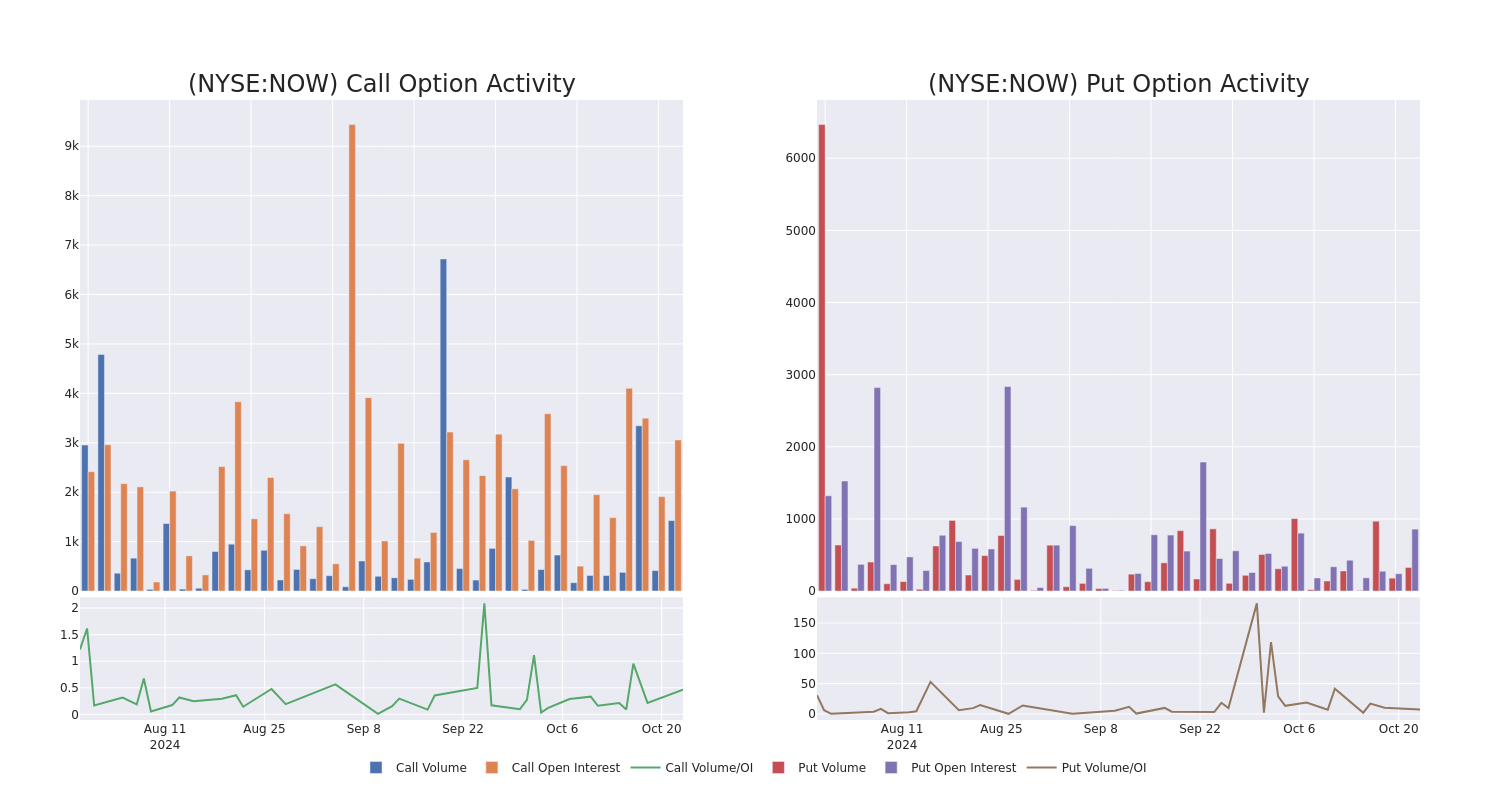
In today’s trading context, the average open interest for options of ServiceNow stands at 150.58, with a total volume reaching 1,748.00. The accompanying chart delineates the progression of both call and put option volume and open interest for high-value trades in ServiceNow, situated within the strike price corridor from $520.0 to $1000.0, throughout the last 30 days.
ServiceNow Option Activity Analysis: Last 30 Days
Largest Options Trades Observed:
| Symbol | PUT/CALL | Trade Type | Sentiment | Exp. Date | Ask | Bid | Price | Strike Price | Total Trade Price | Open Interest | Volume |
|---|---|---|---|---|---|---|---|---|---|---|---|
| NOW | CALL | TRADE | BEARISH | 01/16/26 | $193.0 | $184.1 | $187.25 | $860.00 | $936.2K | 25 | 50 |
| NOW | CALL | SWEEP | BULLISH | 01/17/25 | $33.8 | $30.6 | $32.0 | $1000.00 | $153.6K | 289 | 50 |
| NOW | CALL | TRADE | BEARISH | 12/20/24 | $37.8 | $37.0 | $37.0 | $950.00 | $148.0K | 127 | 40 |
| NOW | PUT | SWEEP | BULLISH | 10/25/24 | $22.7 | $21.0 | $21.4 | $890.00 | $102.7K | 78 | 68 |
| NOW | PUT | SWEEP | NEUTRAL | 10/25/24 | $27.0 | $25.5 | $27.0 | $910.00 | $91.8K | 79 | 43 |
About ServiceNow
ServiceNow Inc provides software solutions to structure and automate various business processes via a SaaS delivery model. The company primarily focuses on the IT function for enterprise customers. ServiceNow began with IT service management, expanded within the IT function, and more recently directed its workflow automation logic to functional areas beyond IT, notably customer service, HR service delivery, and security operations. ServiceNow also offers an application development platform as a service.
In light of the recent options history for ServiceNow, it’s now appropriate to focus on the company itself. We aim to explore its current performance.
Where Is ServiceNow Standing Right Now?
- Trading volume stands at 738,362, with NOW’s price down by -1.48%, positioned at $904.41.
- RSI indicators show the stock to be may be approaching overbought.
- Earnings announcement expected in 0 days.
Professional Analyst Ratings for ServiceNow
5 market experts have recently issued ratings for this stock, with a consensus target price of $987.0.
Turn $1000 into $1270 in just 20 days?
20-year pro options trader reveals his one-line chart technique that shows when to buy and sell. Copy his trades, which have had averaged a 27% profit every 20 days. Click here for access.
* An analyst from Morgan Stanley has revised its rating downward to Equal-Weight, adjusting the price target to $960.
* An analyst from Wells Fargo has decided to maintain their Overweight rating on ServiceNow, which currently sits at a price target of $1025.
* An analyst from Evercore ISI Group has decided to maintain their Outperform rating on ServiceNow, which currently sits at a price target of $950.
* Maintaining their stance, an analyst from Mizuho continues to hold a Outperform rating for ServiceNow, targeting a price of $980.
* An analyst from Oppenheimer has decided to maintain their Outperform rating on ServiceNow, which currently sits at a price target of $1020.
Options trading presents higher risks and potential rewards. Astute traders manage these risks by continually educating themselves, adapting their strategies, monitoring multiple indicators, and keeping a close eye on market movements. Stay informed about the latest ServiceNow options trades with real-time alerts from Benzinga Pro.
Market News and Data brought to you by Benzinga APIs
© 2024 Benzinga.com. Benzinga does not provide investment advice. All rights reserved.
Earnings Outlook For Ensign Group
Ensign Group ENSG is gearing up to announce its quarterly earnings on Thursday, 2024-10-24. Here’s a quick overview of what investors should know before the release.
Analysts are estimating that Ensign Group will report an earnings per share (EPS) of $1.36.
Ensign Group bulls will hope to hear the company announce they’ve not only beaten that estimate, but also to provide positive guidance, or forecasted growth, for the next quarter.
New investors should note that it is sometimes not an earnings beat or miss that most affects the price of a stock, but the guidance (or forecast).
Earnings History Snapshot
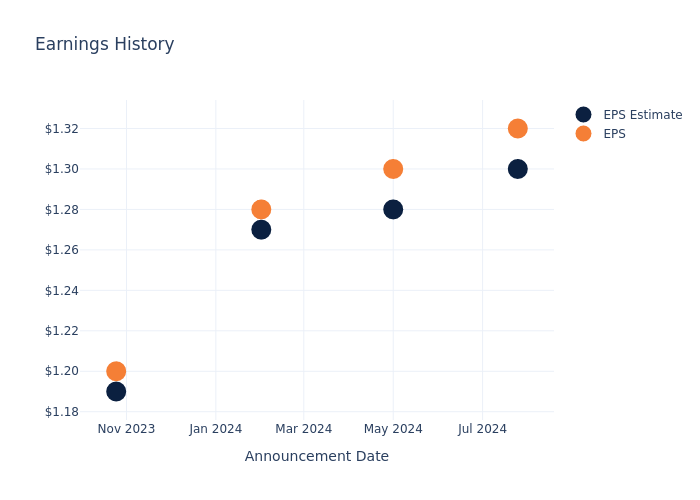
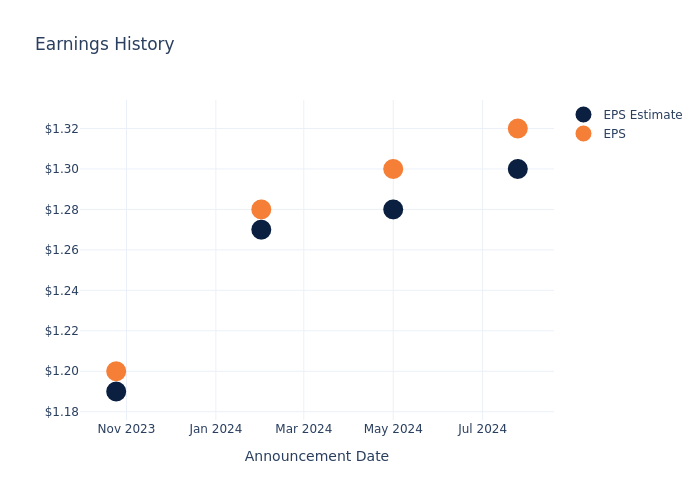
Last quarter the company beat EPS by $0.02, which was followed by a 4.87% increase in the share price the next day.
Here’s a look at Ensign Group’s past performance and the resulting price change:
| Quarter | Q2 2024 | Q1 2024 | Q4 2023 | Q3 2023 |
|---|---|---|---|---|
| EPS Estimate | 1.30 | 1.28 | 1.27 | 1.19 |
| EPS Actual | 1.32 | 1.30 | 1.28 | 1.20 |
| Price Change % | 5.0% | -2.0% | 5.0% | 0.0% |
Performance of Ensign Group Shares
Shares of Ensign Group were trading at $148.79 as of October 22. Over the last 52-week period, shares are up 55.35%. Given that these returns are generally positive, long-term shareholders are likely bullish going into this earnings release.
Analyst Views on Ensign Group
For investors, staying informed about market sentiments and expectations in the industry is paramount. This analysis provides an exploration of the latest insights on Ensign Group.
Ensign Group has received a total of 3 ratings from analysts, with the consensus rating as Outperform. With an average one-year price target of $164.0, the consensus suggests a potential 10.22% upside.
Analyzing Analyst Ratings Among Peers
The analysis below examines the analyst ratings and average 1-year price targets of Encompass Health, PACS Group and Acadia Healthcare Co, three significant industry players, providing valuable insights into their relative performance expectations and market positioning.
- As per analysts’ assessments, Encompass Health is favoring an Buy trajectory, with an average 1-year price target of $107.0, suggesting a potential 28.09% downside.
- PACS Group is maintaining an Buy status according to analysts, with an average 1-year price target of $43.71, indicating a potential 70.62% downside.
- For Acadia Healthcare Co, analysts project an Neutral trajectory, with an average 1-year price target of $86.8, indicating a potential 41.66% downside.
Summary of Peers Analysis
The peer analysis summary presents essential metrics for Encompass Health, PACS Group and Acadia Healthcare Co, unveiling their respective standings within the industry and providing valuable insights into their market positions and comparative performance.
| Company | Consensus | Revenue Growth | Gross Profit | Return on Equity |
|---|---|---|---|---|
| Ensign Group | Outperform | 12.48% | $162.65M | 4.39% |
| Encompass Health | Buy | 9.61% | $1.24B | 6.33% |
| PACS Group | Buy | 29.08% | $153.87M | -3.12% |
| Acadia Healthcare Co | Neutral | 8.85% | $768.16M | 2.70% |
Key Takeaway:
Ensign Group ranks highest in Revenue Growth among its peers. It is in the middle for Gross Profit. Ensign Group is at the bottom for Return on Equity.
Unveiling the Story Behind Ensign Group
Ensign Group Inc provides post-acute healthcare services in the United States. Its regional subsidiaries oversee skilled nursing, assisted living, home health and hospice, mobile ancillary, and urgent care operations. Medicare and Medicaid programs contribute a majority of revenue received for Ensign’s services. The firm operates through two segments, Skilled services, and Standard Bearer. The skilled services segment includes the operation of skilled nursing facilities and rehabilitation therapy services. The Standard Bearer segment comprises of properties owned by the company through its captive REIT and leased to skilled nursing and assisted living operations. The majority of the revenue is generated from the skilled services segment.
Ensign Group’s Financial Performance
Market Capitalization: Exceeding industry standards, the company’s market capitalization places it above industry average in size relative to peers. This emphasizes its significant scale and robust market position.
Revenue Growth: Ensign Group’s remarkable performance in 3 months is evident. As of 30 June, 2024, the company achieved an impressive revenue growth rate of 12.48%. This signifies a substantial increase in the company’s top-line earnings. As compared to competitors, the company surpassed expectations with a growth rate higher than the average among peers in the Health Care sector.
Net Margin: Ensign Group’s net margin excels beyond industry benchmarks, reaching 6.85%. This signifies efficient cost management and strong financial health.
Return on Equity (ROE): The company’s ROE is a standout performer, exceeding industry averages. With an impressive ROE of 4.39%, the company showcases effective utilization of equity capital.
Return on Assets (ROA): The company’s ROA is a standout performer, exceeding industry averages. With an impressive ROA of 1.62%, the company showcases effective utilization of assets.
Debt Management: Ensign Group’s debt-to-equity ratio is below the industry average. With a ratio of 1.18, the company relies less on debt financing, maintaining a healthier balance between debt and equity, which can be viewed positively by investors.
To track all earnings releases for Ensign Group visit their earnings calendar on our site.
This article was generated by Benzinga’s automated content engine and reviewed by an editor.
© 2024 Benzinga.com. Benzinga does not provide investment advice. All rights reserved.
Andrew Castellaneta Takes Money Off The Table, Sells $421K In Omnicom Group Stock
On October 22, a recent SEC filing unveiled that Andrew Castellaneta, SVP at Omnicom Group OMC made an insider sell.
What Happened: Castellaneta’s decision to sell 4,000 shares of Omnicom Group was revealed in a Form 4 filing with the U.S. Securities and Exchange Commission on Tuesday. The total value of the sale is $421,154.
In the Wednesday’s morning session, Omnicom Group‘s shares are currently trading at $101.3, experiencing a up of 0.27%.
Unveiling the Story Behind Omnicom Group
Omnicom is a holding company that owns several advertising agencies and related firms. It provides traditional and digital advertising services that include creative design, market research, data analytics, and ad placement. In addition, Omnicom provides outsourced public relations and other communications services. The firm operates globally, providing services in more than 70 countries; it generates more than one half of its revenue in North America and nearly 30% in Europe.
Omnicom Group: Financial Performance Dissected
Revenue Growth: Omnicom Group’s remarkable performance in 3 months is evident. As of 30 September, 2024, the company achieved an impressive revenue growth rate of 8.51%. This signifies a substantial increase in the company’s top-line earnings. As compared to competitors, the company encountered difficulties, with a growth rate lower than the average among peers in the Communication Services sector.
Holistic Profitability Examination:
-
Gross Margin: The company issues a cost efficiency warning with a low gross margin of 19.6%, indicating potential difficulties in maintaining profitability compared to its peers.
-
Earnings per Share (EPS): The company excels with an EPS that surpasses the industry average. With a current EPS of 1.97, Omnicom Group showcases strong earnings per share.
Debt Management: Omnicom Group’s debt-to-equity ratio stands notably higher than the industry average, reaching 1.96. This indicates a heavier reliance on borrowed funds, raising concerns about financial leverage.
Financial Valuation Breakdown:
-
Price to Earnings (P/E) Ratio: The P/E ratio of 13.8 is lower than the industry average, implying a discounted valuation for Omnicom Group’s stock.
-
Price to Sales (P/S) Ratio: The current P/S ratio of 1.3 is below industry norms, suggesting potential undervaluation and presenting an investment opportunity for those considering sales performance.
-
EV/EBITDA Analysis (Enterprise Value to its Earnings Before Interest, Taxes, Depreciation & Amortization): The company’s EV/EBITDA ratio 9.32 is below the industry average, indicating that it may be relatively undervalued compared to peers.
Market Capitalization Highlights: Above the industry average, the company’s market capitalization signifies a significant scale, indicating strong confidence and market prominence.
Now trade stocks online commission free with Charles Schwab, a trusted and complete investment firm.
The Importance of Insider Transactions
Insider transactions shouldn’t be used primarily to make an investing decision, however an insider transaction can be an important factor in the investing decision.
Exploring the legal landscape, an “insider” is defined as any officer, director, or beneficial owner holding more than ten percent of a company’s equity securities, as stipulated by Section 12 of the Securities Exchange Act of 1934. This encompasses executives in the c-suite and major hedge funds. These insiders are required to report their transactions through a Form 4 filing, which must be submitted within two business days of the transaction.
Highlighted by a company insider’s new purchase, there’s a positive anticipation for the stock to rise.
But, insider sells may not necessarily indicate a bearish view and can be motivated by various factors.
Understanding Crucial Transaction Codes
Delving into transactions, investors typically prioritize those unfolding in the open market, as precisely outlined in Table I of the Form 4 filing. A P in Box 3 indicates a purchase, while S signifies a sale. Transaction code C signals the conversion of an option, and transaction code A denotes a grant, award, or other acquisition of securities from the company.
Check Out The Full List Of Omnicom Group’s Insider Trades.
Insider Buying Alert: Profit from C-Suite Moves
Benzinga Edge reveals every insider trade in real-time. Don’t miss the next big stock move driven by insider confidence. Unlock this ultimate sentiment indicator now. Click here for access.
This article was generated by Benzinga’s automated content engine and reviewed by an editor.
Market News and Data brought to you by Benzinga APIs
© 2024 Benzinga.com. Benzinga does not provide investment advice. All rights reserved.
3 Regional Bank Stock Picks From JPMorgan: Analyst 'Encouraged' After Solid Q3
The U.S. regional banking sector is showing resilience as several mid- and small-cap banks delivered stronger-than-expected third-quarter earnings, according to JPMorgan analyst Anthony Elian.
In a note on the sector’s third-quarter earnings season, Elian highlighted widespread earnings beats and favorable outlooks, suggesting that regional bank stocks have room for further upside into 2025.
In addition to strong earnings reports, the Fed’s expected gradual rate cuts, the yield curve de-inverting, easing credit quality concerns, potential capital returns, and underweight positioning by investors all lead Elian to say he is “encouraged about the direction of regional banks.”
Earnings Beats Drive Outperformance
One week into the earnings season, seven regional banks in JPMorgan’s coverage universe have reported results, with five of them beating core earnings-per-share (EPS) estimates. The primary driver behind these beats was stronger-than-expected net interest margins (NIM) and net interest income (NII).
As a result, regional bank stocks, represented by the SPDR Regional Banking ETF KRE, have outperformed the broader market, as gauged by the SPDR S&P 500 ETF Trust SPY, so far this month.
“With more beats than misses and 4Q24 outlooks generally trending better than prior consensus expectations, regional banks are outperforming through earnings season so far,” Elian noted.
Banking Sector’s Third-Quarter Trends
Several fundamental trends emerged for U.S. banks during the quarter.
Average deposits increased at a 7% annualized rate, while average loans grew by 2% annually. On a period-end basis, deposits rose at an even stronger 11% annualized pace, and loans increased by 3% annually. Importantly, NII expanded at a robust 12% annualized rate.
Despite some concerns over office loans, credit quality remained stable overall, though a few banks reported increases in non-performing assets (NPAs) related to office loans.
Bullish Outlook For Fourth Quarter And Beyond
Looking ahead, the outlook for the fourth quarter remains largely positive.
Many banks are guiding for modest growth across key metrics such as loan growth, NII, and fee income, while expense growth is expected to remain controlled.
Despite near-term headwinds, most banks in Elian’s coverage universe expressed optimism about the NII trajectory into 2025, particularly as the Federal Reserve is expected to reduce interest rates further.
With “the Fed continuing to reduce the funds rate, this outlook should be further supported by an eventual rebound in commercial loan demand across the industry,” Elian said.
Regional Banks’ Valuation And Investment Outlook
Regional banks are still trading below historical valuations. JPMorgan’s coverage universe is currently priced at 1.3x 2025 estimated tangible book value (TBV), compared to the historical range of 1.8x to 2.0x.
This indicates substantial upside potential for a re-rating of the sector, particularly as investors remain underweight regional bank stocks. “Expect the sector to re-rate higher as investors recognize their improved financial health and earnings potential,” Elian noted.
Elian’s top picks for the sector include First Citizens BancShares Inc. FCNCA, Western Alliance Bancorp. WAL, and Pinnacle Financial Partners Inc. PNFP, all of which are well-positioned to capitalize on favorable market dynamics and potential earnings growth into 2025.
Read Next:
Image created using artificial intelligence via Midjourney.
Market News and Data brought to you by Benzinga APIs
© 2024 Benzinga.com. Benzinga does not provide investment advice. All rights reserved.
Market Whales and Their Recent Bets on Mastercard Options
Investors with a lot of money to spend have taken a bearish stance on Mastercard MA.
And retail traders should know.
We noticed this today when the trades showed up on publicly available options history that we track here at Benzinga.
Whether these are institutions or just wealthy individuals, we don’t know. But when something this big happens with MA, it often means somebody knows something is about to happen.
So how do we know what these investors just did?
Today, Benzinga‘s options scanner spotted 14 uncommon options trades for Mastercard.
This isn’t normal.
The overall sentiment of these big-money traders is split between 35% bullish and 50%, bearish.
Out of all of the special options we uncovered, 4 are puts, for a total amount of $161,337, and 10 are calls, for a total amount of $541,947.
Predicted Price Range
After evaluating the trading volumes and Open Interest, it’s evident that the major market movers are focusing on a price band between $380.0 and $540.0 for Mastercard, spanning the last three months.
Volume & Open Interest Trends
Looking at the volume and open interest is an insightful way to conduct due diligence on a stock.
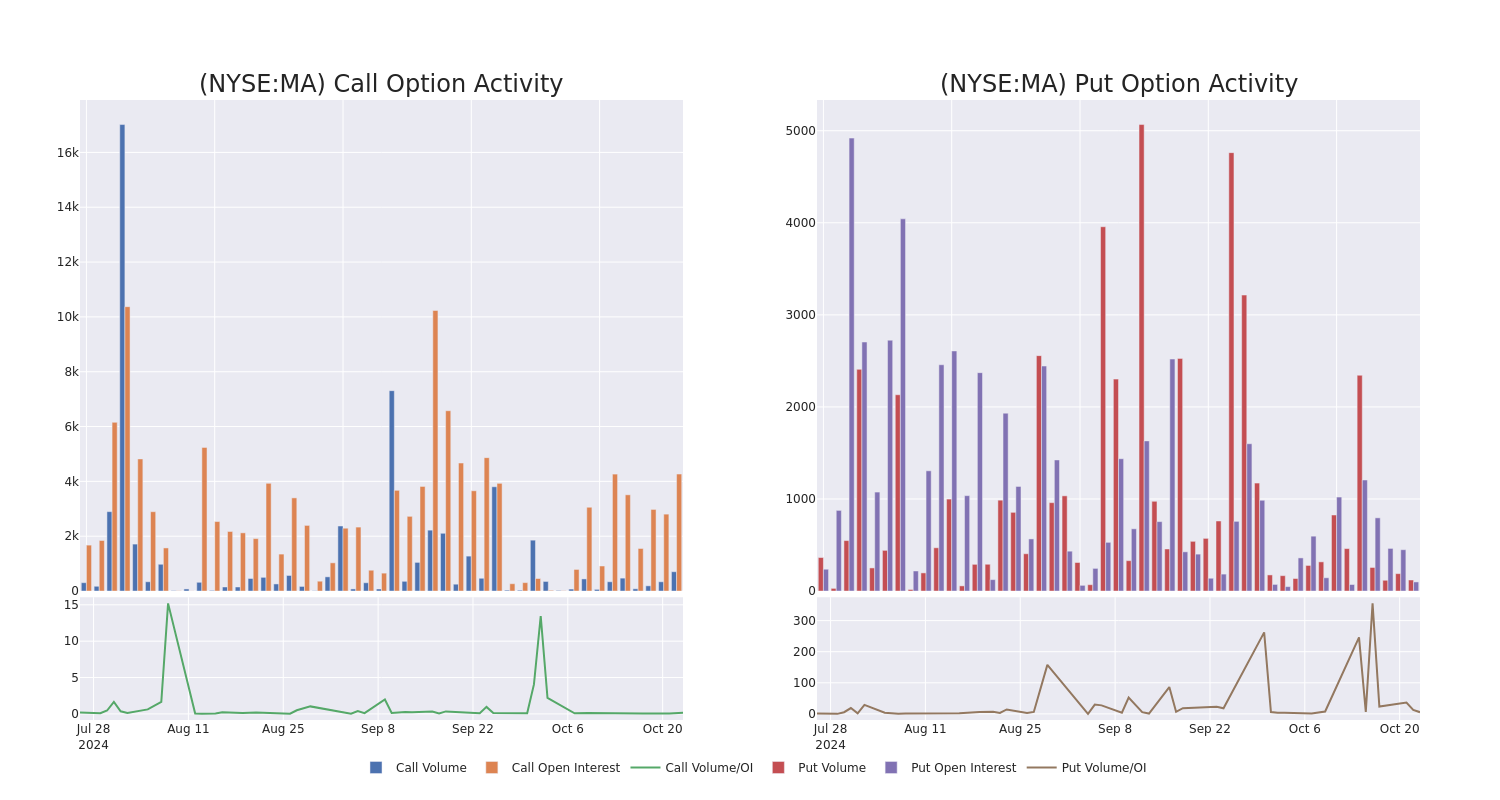
This data can help you track the liquidity and interest for Mastercard’s options for a given strike price.
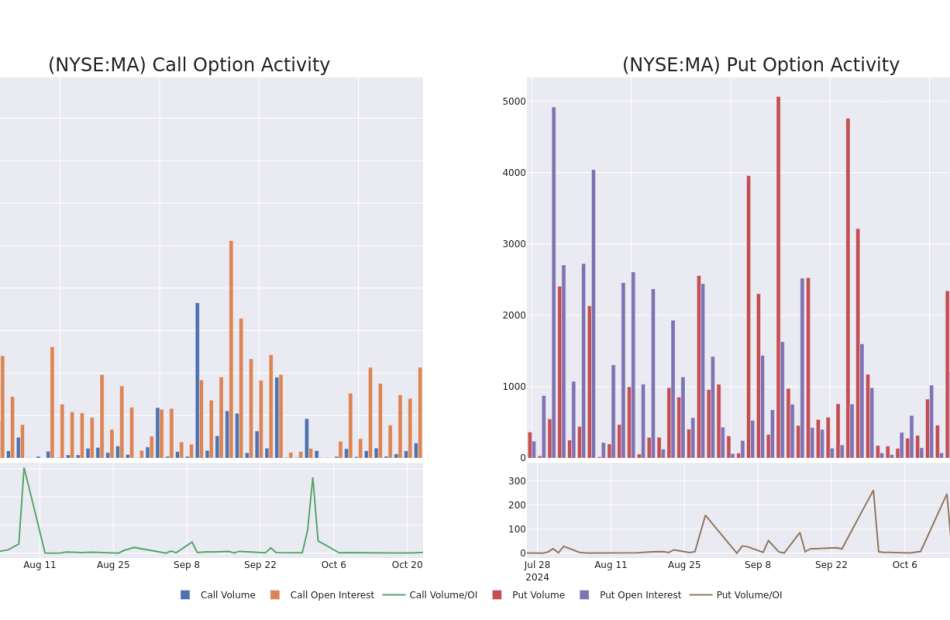
Below, we can observe the evolution of the volume and open interest of calls and puts, respectively, for all of Mastercard’s whale activity within a strike price range from $380.0 to $540.0 in the last 30 days.
Mastercard 30-Day Option Volume & Interest Snapshot
Largest Options Trades Observed:
| Symbol | PUT/CALL | Trade Type | Sentiment | Exp. Date | Ask | Bid | Price | Strike Price | Total Trade Price | Open Interest | Volume |
|---|---|---|---|---|---|---|---|---|---|---|---|
| MA | CALL | TRADE | BULLISH | 11/15/24 | $66.7 | $64.6 | $66.0 | $450.00 | $151.8K | 107 | 23 |
| MA | CALL | SWEEP | BEARISH | 06/20/25 | $28.5 | $27.75 | $27.75 | $540.00 | $135.9K | 492 | 103 |
| MA | CALL | SWEEP | BULLISH | 12/20/24 | $10.9 | $10.9 | $10.9 | $530.00 | $52.2K | 85 | 123 |
| MA | PUT | SWEEP | BEARISH | 12/20/24 | $21.2 | $20.75 | $21.05 | $525.00 | $50.7K | 78 | 24 |
| MA | PUT | TRADE | BEARISH | 12/20/24 | $21.2 | $20.75 | $21.05 | $525.00 | $48.4K | 78 | 47 |
About Mastercard
Mastercard is the second-largest payment processor in the world, having processed close to over $9 trillion in volume during 2023. Mastercard operates in over 200 countries and processes transactions in over 150 currencies.
Following our analysis of the options activities associated with Mastercard, we pivot to a closer look at the company’s own performance.
Mastercard’s Current Market Status
- With a volume of 693,191, the price of MA is up 0.08% at $513.43.
- RSI indicators hint that the underlying stock may be overbought.
- Next earnings are expected to be released in 8 days.
Professional Analyst Ratings for Mastercard
A total of 3 professional analysts have given their take on this stock in the last 30 days, setting an average price target of $581.3333333333334.
Unusual Options Activity Detected: Smart Money on the Move
Benzinga Edge’s Unusual Options board spots potential market movers before they happen. See what positions big money is taking on your favorite stocks. Click here for access.
* An analyst from JP Morgan persists with their Overweight rating on Mastercard, maintaining a target price of $593.
* An analyst from Barclays has decided to maintain their Overweight rating on Mastercard, which currently sits at a price target of $576.
* An analyst from Baird has decided to maintain their Outperform rating on Mastercard, which currently sits at a price target of $575.
Options trading presents higher risks and potential rewards. Astute traders manage these risks by continually educating themselves, adapting their strategies, monitoring multiple indicators, and keeping a close eye on market movements. Stay informed about the latest Mastercard options trades with real-time alerts from Benzinga Pro.
Market News and Data brought to you by Benzinga APIs
© 2024 Benzinga.com. Benzinga does not provide investment advice. All rights reserved.
Dividend Investor Earns $300K Per Year On $4.4M Investment: Their Top 10 Picks
Benzinga and Yahoo Finance LLC may earn commission or revenue on some items through the links below.
Dividend-paying stocks offer a versatile approach to enhancing income and growth potential, regardless of your life stage.
For those years away from retirement, reinvesting dividends can significantly boost returns.
Consider a hypothetical investment in the S&P 500 Index Fund in 1993. According to Charles Schwab, reinvesting dividends would have grown it to over $158,000 by the end of 2022, while not reinvesting would have limited it to $88,000.
Don’t Miss Out:
Investing in reliable, long-term dividend stocks usually positions investors to survive a market downturn or recession and thrive during bull markets.
About a month ago, a Redditor on r/Dividends shared their income report and portfolio, saying they hit their $300,000 12-month goal on investments of about $4 million.
Professional_Panic67, who has about 150 holdings, wrote that the top 10 stocks they’ve invested in account for about 25% of the $300,000 in earnings.
Trending: This billion-dollar fund has invested in the next big real estate boom, here’s how you can join for $10.
This is a paid advertisement. Carefully consider the investment objectives, risks, charges and expenses of the Fundrise Flagship Fund before investing. This and other information can be found in the Fund’s prospectus. Read them carefully before investing.
Professional_Panic’s top 10 in order are:
-
BlackRock Science and Technology Term Trust (NYSE:BSTZ) has an annual dividend yield of 9.18%.
-
Nuveen Real Asset Income and Growth Fund (NYSE:JR) has an annual dividend yield of 6.57%.
-
DoubleLine Income Solutions Fund Common Stock (NYSE:DSL) has an annual dividend yield of 10.36%.
-
Neuberger Berman Real Estate Securities Income Fund Inc. (NYSEAMERICAN: NRO) has an annual dividend yield of 9.4%.
-
Kayne Anderson Energy Infrastructure Fund Inc. (NYSE:KYN) has an annual dividend yield of 8.31%.
-
Western Asset High Income Opportunity Fund Inc. (NYSE:HIO) has an annual dividend yield of 10.7%.
-
Voya Infrastructure Industrials and Materials Fund (NYSE:IDE) has an annual dividend yield of 10.07%.
-
Altria Group Inc. (NYSE:MO) has an annual dividend yield of 8.22%.
-
Ares Capital Corp. (NASDAQ:ARCC) has an annual dividend yield of 8.87%.
-
BlackRock Corporate High Yield Fund Inc. (NYSE:HYT) has an annual dividend yield of 9.47%.
Mortgage Applications Fall For Fourth Straight Week As High Rates Squeeze Homebuyers
A recent surge in mortgage rates is weighing heavily on homebuyers, causing a sharp and sustained drop in mortgage applications across the U.S.
This downturn marks the fourth consecutive weekly decline, signaling growing pressure from elevated borrowing costs.
Mortgage Applications Plummet for Fourth Straight Week
For the week ending Oct. 18, mortgage applications in the U.S. tumbled by 6.7%, extending a 17% plunge from the previous week, according to data shared Wednesday by the Mortgage Bankers Association.
This represents the fourth straight week of contraction in mortgage demand, as the recent uptick in interest rates to two-month highs has increasingly discouraged potential buyers from entering the housing market.
Notably, applications to refinance existing home loans, which tend to be more sensitive to short-term interest rate changes, dropped 8.5% for the week, extending a prior 26% plunge. Applications for new home purchases also declined by 5%, reflecting a broader weakness in housing market activity.
The drop in activity coincides with a significant rise in key interest rates, driven by robust economic data and market expectations of a less accommodative stance by the Federal Reserve for the rest of 2024.
Mortgage Rates Remain Elevated
The average interest rate for a 30-year fixed-rate mortgage with conforming loan balances (up to $766,550) remained stable at 6.52%, close to its two-month high.
For larger loans (jumbo mortgages, which cover amounts above $766,550), the rate edged down slightly to 6.73%, a marginal drop of 3 basis points from the previous week.
Last week, Joel Kan, vice president and deputy chief economist at the Mortgage Bankers Association, highlighted, “Demand is holding up to an extent for prospective first-time buyers. The recent uptick in rates has put a damper on applications.”
Mortgage rates have surged in tandem with rising long-term Treasury yields, which had been steadily climbing before leveling off last week.
The rising trend in Treasury yields resumed this week, further clouding the outlook for mortgage demand.
Yields on 30-year Treasury bonds have jumped by over 10 basis points to 4.5% as of Wednesday. Given that Treasury yields serve as a key benchmark for mortgage rates, any further increases could intensify pressure on already weakened mortgage demand.
Impact On Mortgage-Related Stocks
The cooling of the housing market is also evident in the declining performance of mortgage-related stocks.
Both the iShares Mortgage Real Estate ETF REM and the VanEck Mortgage REIT Income ETF MORT have seen significant declines, falling for two consecutive days this week.
Since their highs in September, both ETFs have shed about 8-9% in value, underscoring the negative impact of declining demand in the market performance of mortgage real estate investment trusts (REITs).
The popular iShares 20+ Year Treasury Bond ETF TLT, which tracks long-term Treasury bonds, has dropped 2% for the week and is down 9.5% from its late September levels.
Looking ahead, market participants remain focused on the Federal Reserve’s next move.
The CME FedWatch tool, which tracks market-implied expectations for Federal Reserve policy, shows an 87% chance that the central bank will cut interest rates by 25 basis points at its next meeting on Nov. 7.
Read Next:
Image created using artificial intelligence via Midjourney.
Market News and Data brought to you by Benzinga APIs
© 2024 Benzinga.com. Benzinga does not provide investment advice. All rights reserved.
Shiba Inu Falls More Than 4% In 24 hours
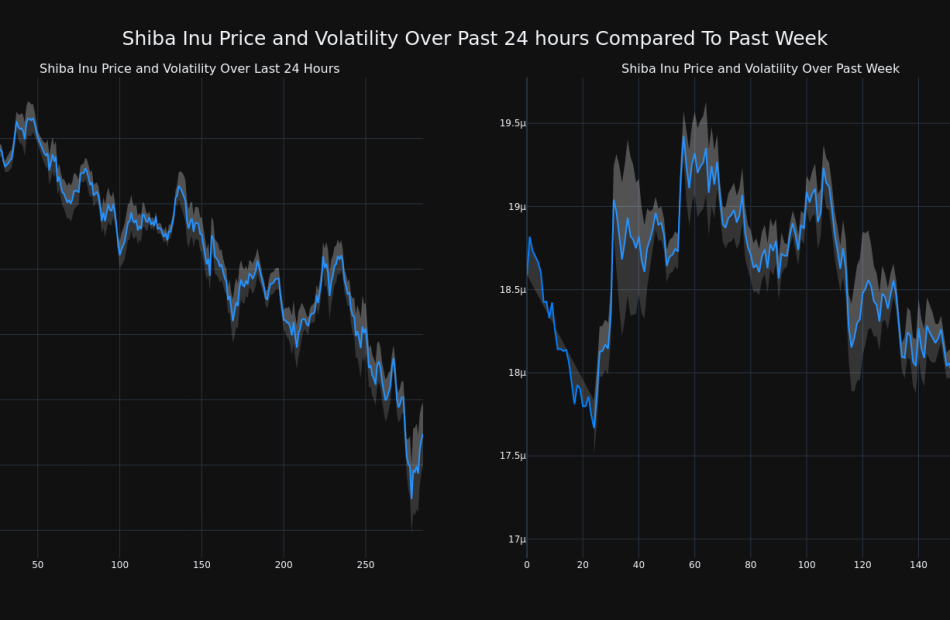
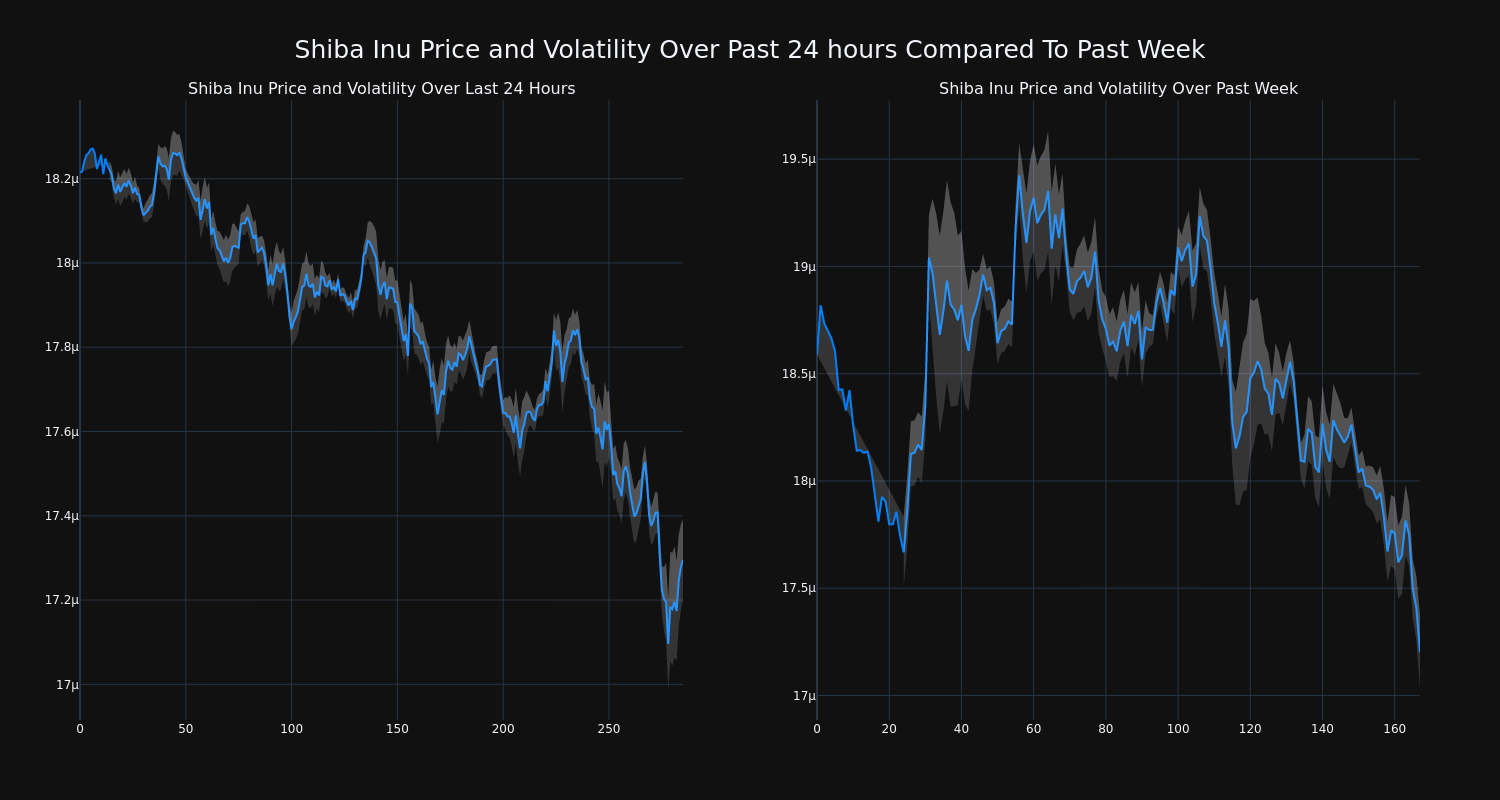
Over the past 24 hours, Shiba Inu’s SHIB/USD price has fallen 4.74% to $0.000017. This continues its negative trend over the past week where it has experienced a 7.0% loss, moving from $0.000019 to its current price.
The chart below compares the price movement and volatility for Shiba Inu over the past 24 hours (left) to its price movement over the past week (right). The gray bands are Bollinger Bands, measuring the volatility for both the daily and weekly price movements. The wider the bands are, or the larger the gray area is at any given moment, the larger the volatility.
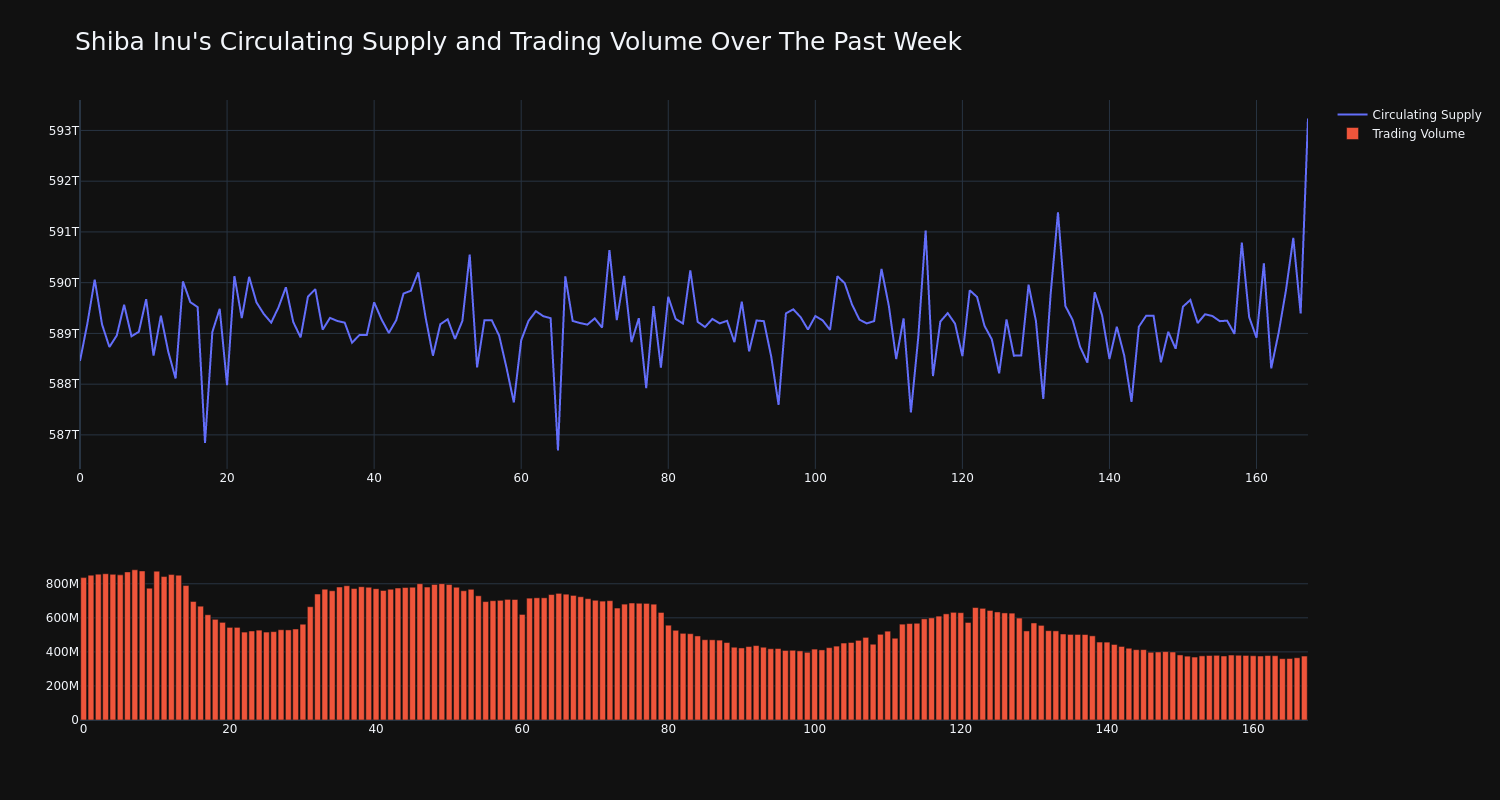
The trading volume for the coin has tumbled 55.0% over the past week while the circulating supply of the coin has risen 0.81%. This brings the circulating supply to 589.26 trillion. According to our data, the current market cap ranking for SHIB is #15 at $10.21 billion.
This article was generated by Benzinga’s automated content engine and reviewed by an editor.
Market News and Data brought to you by Benzinga APIs
© 2024 Benzinga.com. Benzinga does not provide investment advice. All rights reserved.

