Truck and Bus Radial Tire Market Size Worth US$ 30.03 Billion by 2033 at a CAGR of 6% | Fact.MR Report
Rockville, MD , Oct. 23, 2024 (GLOBE NEWSWIRE) — According to Fact.MR, a market research and competitive intelligence provider, the global truck and bus radial tire market stands at US$ 16.77 billion in 2023 and is predicted to rise at a CAGR of 6% between 2023 and 2033.
Truck and bus radial (TBR) tires are built with advanced technologies and materials to withstand heavy loads and provide reliable performance in various road conditions. The market for truck and bus radial tires is growing healthily owing to the increasing demand for commercial vehicles and improvements in tire technologies.
Rapidly growing demand for truck transportation and public transportation services is boosting the growth of the truck and bus radial tire market. The development of road networks in several countries is stimulating a higher production of trucks, buses, and other forms of public transportation, consequently boosting the demand for radial tires.
Manufacturers are developing innovative tire solutions that offer improved fuel efficiency, longer tread life, enhanced traction, and better load-carrying capacity. The adoption of these advanced tire technologies is predicted to fuel demand for improved truck and bus radial tires during the forecast period. Key market players are also focusing on the production of eco-friendly tires, which are manufactured from recycled materials.
North America and Europe hold leading positions in the global market. Emerging economies, particularly in Asia Pacific and Latin America, are witnessing significant economic growth and urbanization. This growth is accompanied by high investments in infrastructures, including transportation systems. The expanding commercial vehicle fleet in these regions is also driving the demand for truck and bus radial tires.
For More Insights into the Market, Request a Sample of this Report:
https://www.factmr.com/connectus/sample?flag=S&rep_id=5246

Key Takeaways from Market Study
- The global truck and bus radial tire market is predicted to reach US$ 30.3 billion by 2033.
- Sales of truck and bus radial tires in Germany are predicted to increase at a CAGR of 6% from 2023 to 2033.
- The market in the United States is projected to reach US$ 7.60 billion by 2033.
- The China truck and bus radial tire market is expected to reach US$ 7.75 billion by 2023.
- Sales of truck and bus radial tires through OEMs are anticipated to increase at a CAGR of 1% over the next 10 years.
“Introduction of smart and sustainable tire solutions are generating potential growth opportunities for TBR tire manufacturers,” says a Fact.MR analyst.
Leading Players Driving Innovation in the Truck and Bus Radial Tire Market
Key Players in the truck and bus radial tire market are Apollo Tyres, Balkrishna Industries Limited, Bridgestone Corporation, China National Tire & Rubber Co., Ltd., Continental AG, Cooper Tire & Rubber Company, Giti Tire, The Goodyear Tire & Rubber Company, Hankook Tire & Technology Co. Ltd., Kumho Tire Co., Inc., MICHELIN.
Recent Market Developments
- Bridgestone Americas’ (Bridgestone) truck and bus radial tire plant in Warren County, Tennessee, underwent extensive development and modernization in August 2022 with an investment of US$ 550 million, which is projected to generate 380 new jobs, increase the plant’s current size by 850,000 square feet, and hasten the adoption of cutting-edge technologies that enable safer, cleaner, and more efficient commercial truck and bus fleets.
- To increase its footprint in America through supply chain management and industry-leading retail channels, Goodyear purchased Cooper Tyre & Rubber Company in March 2021 for US$ 2.8 billion for enhancing its product offerings for SUVs and light trucks.
Get Customization on this Report for Specific Research Solutions:
https://www.factmr.com/connectus/sample?flag=S&rep_id=5246
Truck and Bus Radial Tire Industry News:
- Bridgestone Corporation declared in December 2021 that its TBR tire manufacturing facilities in China would be consolidated as part of its mid-term business plan (2021–2023). By increasing the company’s earning capacity and enabling strategic investments for future growth, this effort seeks to improve growth prospects.
More Valuable Insights on Offer
Fact.MR, in its new offering, presents an unbiased analysis of the global truck and bus radial tire market, presenting historical demand data (2018 to 2022) and forecast statistics for the period (2023 to 2033).
The study divulges essential insights into the market based on application (trucks, buses), sales channel (OEMs, aftermarket), and across five major regions of the world (North America, Europe, Asia Pacific, Latin America, and MEA).
Check out More Related Studies Published by Fact.MR:
Automotive Vibration Control System Market: Size is estimated to be valued at US$ 168.33 billion in 2024 and has been forecasted to expand at a CAGR of 3.6% to reach US$ 271.59 billion by the end of 2034.
Grader Market: Size is estimated at a valuation of US$ 4.42 billion in 2024 and is forecasted to ascend to US$ 5.77 billion by the end of 2034. Worldwide sales of graders are evaluated to rise at 2.7% CAGR from 2024 to 2034.
Automotive Exhaust Aftertreatment System Market: Size is estimated at US$ 24.1 billion in 2024 and has been calculated to increase at a CAGR of 3.6% to reach US$ 36.02 billion by the end of 2034.
Automotive Gear Market: Size is analyzed to increase from US$ 4.88 billion in 2024 to US$ 8.5 billion by the end of 2034. Sales of automotive gear systems are evaluated to rise at 5.7% CAGR from 2024 to 2034.
Electric Vehicle Sound Generator Market: Size is set to be worth US$ 115.5 million in 2024 and is forecasted to expand at a CAGR of 18.6% to reach US$ 739.3 million by the end of 2034.
Rail Gangway Market: Size is poised to be valued at US$ 507.6 million in 2024 and further expand at a CAGR of 4.9% to reach US$ 819 million by the end of 2034.
About Us:
Fact.MR is a distinguished market research company renowned for its comprehensive market reports and invaluable business insights. As a prominent player in business intelligence, we deliver deep analysis, uncovering market trends, growth paths, and competitive landscapes. Renowned for its commitment to accuracy and reliability, we empower businesses with crucial data and strategic recommendations, facilitating informed decision-making and enhancing market positioning.
With its unwavering dedication to providing reliable market intelligence, FACT.MR continues to assist companies in navigating dynamic market challenges with confidence and achieving long-term success. With a global presence and a team of experienced analysts, FACT.MR ensures its clients receive actionable insights to capitalize on emerging opportunities and stay competitive.
Contact:
11140 Rockville Pike
Suite 400
Rockville, MD 20852
United States
Tel: +1 (628) 251-1583
Sales Team: sales@factmr.com
Follow Us: LinkedIn | Twitter | Blog

© 2024 Benzinga.com. Benzinga does not provide investment advice. All rights reserved.
A Peek at ResMed's Future Earnings
ResMed RMD is set to give its latest quarterly earnings report on Thursday, 2024-10-24. Here’s what investors need to know before the announcement.
Analysts estimate that ResMed will report an earnings per share (EPS) of $2.04.
ResMed bulls will hope to hear the company announce they’ve not only beaten that estimate, but also to provide positive guidance, or forecasted growth, for the next quarter.
New investors should note that it is sometimes not an earnings beat or miss that most affects the price of a stock, but the guidance (or forecast).
Overview of Past Earnings
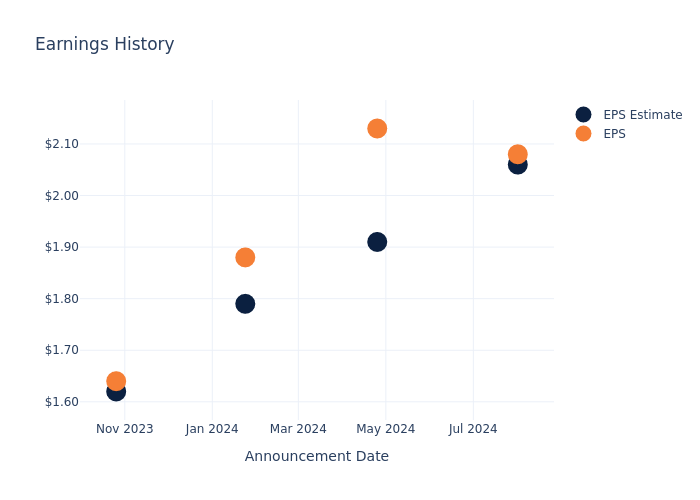
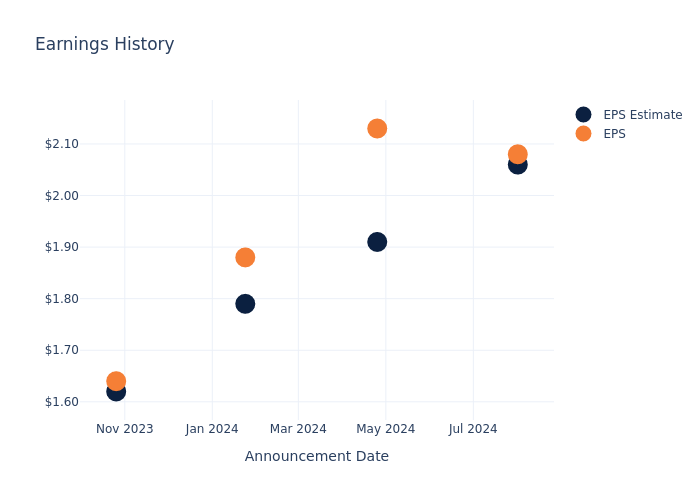
Last quarter the company beat EPS by $0.02, which was followed by a 4.23% increase in the share price the next day.
Here’s a look at ResMed’s past performance and the resulting price change:
| Quarter | Q4 2024 | Q3 2024 | Q2 2024 | Q1 2024 |
|---|---|---|---|---|
| EPS Estimate | 2.06 | 1.91 | 1.79 | 1.62 |
| EPS Actual | 2.08 | 2.13 | 1.88 | 1.64 |
| Price Change % | 4.0% | 19.0% | 8.0% | -3.0% |
Market Performance of ResMed’s Stock
Shares of ResMed were trading at $239.98 as of October 22. Over the last 52-week period, shares are up 70.56%. Given that these returns are generally positive, long-term shareholders should be satisfied going into this earnings release.
Analysts’ Perspectives on ResMed
Understanding market sentiments and expectations within the industry is crucial for investors. This analysis delves into the latest insights on ResMed.
Analysts have given ResMed a total of 8 ratings, with the consensus rating being Neutral. The average one-year price target is $235.38, indicating a potential 1.92% downside.
Understanding Analyst Ratings Among Peers
The below comparison of the analyst ratings and average 1-year price targets of IDEXX Laboratories, DexCom and GE HealthCare Techs, three prominent players in the industry, gives insights for their relative performance expectations and market positioning.
- Analysts currently favor an Neutral trajectory for IDEXX Laboratories, with an average 1-year price target of $543.75, suggesting a potential 126.58% upside.
- DexCom received a Outperform consensus from analysts, with an average 1-year price target of $97.44, implying a potential 59.4% downside.
- GE HealthCare Techs received a Buy consensus from analysts, with an average 1-year price target of $94.67, implying a potential 60.55% downside.
Peer Metrics Summary
The peer analysis summary presents essential metrics for IDEXX Laboratories, DexCom and GE HealthCare Techs, unveiling their respective standings within the industry and providing valuable insights into their market positions and comparative performance.
| Company | Consensus | Revenue Growth | Gross Profit | Return on Equity |
|---|---|---|---|---|
| ResMed | Neutral | 9.01% | $715.53M | 6.16% |
| IDEXX Laboratories | Neutral | 6.35% | $619.16M | 12.91% |
| DexCom | Outperform | 15.26% | $626.70M | 6.13% |
| GE HealthCare Techs | Buy | 0.46% | $2.00B | 5.63% |
Key Takeaway:
ResMed ranks in the top for Revenue Growth among its peers. It is in the middle for Gross Profit and Return on Equity.
Delving into ResMed’s Background
ResMed is one of the largest respiratory care device companies globally, primarily developing and supplying flow generators, masks and accessories for the treatment of sleep apnea. Increasing diagnosis of sleep apnea combined with ageing populations and increasing prevalence of obesity is resulting in a structurally growing market. The company earns roughly two thirds of its revenue in the Americas and the balance across other regions dominated by Europe, Japan and Australia. Recent developments and acquisitions have focused on digital health as ResMed is aiming to differentiate itself through the provision of clinical data for use by the patient, medical care advisor and payer in the out-of-hospital setting.
A Deep Dive into ResMed’s Financials
Market Capitalization Perspectives: The company’s market capitalization falls below industry averages, signaling a relatively smaller size compared to peers. This positioning may be influenced by factors such as perceived growth potential or operational scale.
Revenue Growth: Over the 3 months period, ResMed showcased positive performance, achieving a revenue growth rate of 9.01% as of 30 June, 2024. This reflects a substantial increase in the company’s top-line earnings. As compared to its peers, the revenue growth lags behind its industry peers. The company achieved a growth rate lower than the average among peers in Health Care sector.
Net Margin: ResMed’s net margin is impressive, surpassing industry averages. With a net margin of 23.89%, the company demonstrates strong profitability and effective cost management.
Return on Equity (ROE): ResMed’s ROE excels beyond industry benchmarks, reaching 6.16%. This signifies robust financial management and efficient use of shareholder equity capital.
Return on Assets (ROA): ResMed’s ROA surpasses industry standards, highlighting the company’s exceptional financial performance. With an impressive 4.27% ROA, the company effectively utilizes its assets for optimal returns.
Debt Management: ResMed’s debt-to-equity ratio is below the industry average. With a ratio of 0.18, the company relies less on debt financing, maintaining a healthier balance between debt and equity, which can be viewed positively by investors.
To track all earnings releases for ResMed visit their earnings calendar on our site.
This article was generated by Benzinga’s automated content engine and reviewed by an editor.
Market News and Data brought to you by Benzinga APIs
© 2024 Benzinga.com. Benzinga does not provide investment advice. All rights reserved.
Tesla surprises with sales forecast and cost efficiency, shares jump
By Akash Sriram, Abhirup Roy
(Reuters) -Tesla CEO Elon Musk said he expects vehicle sales to grow 20% to 30% next year, reassuring investors the company was improving its core business of selling electric vehicles profitably, and reducing concerns about when it could produce a robotaxi.
The forecast, building on a target for “slight growth” in deliveries this year, pushed the company’s shares up 12% in post-market trading on Wednesday. This set up Tesla to add about $80 billion in stock market value.
A drop in the cost of making vehicles added comfort for investors who saw Musk focusing on boosting Tesla’s industry-leading margin, even as he talked about a future dominated by autonomous cars.
Tesla’s long-awaited unveiling of its robotaxi on Oct. 10 failed to impress investors.
“No EV company is even profitable,” Musk told analysts on a conference call on Wednesday. “And to the best of my knowledge, there was no EV division of any company, of any existing auto company that is profitable. So it is notable that Tesla is profitable despite a very challenging automotive environment.”
Shares of Tesla’s smaller EV rivals Rivian and Lucid both rose 2% after-hours.
Musk said Tesla would roll out driverless vehicles offering paid rides next year, after the company received regulatory approval in California and Texas.
He said adoption – and sales – of the company’s supervised autopilot software, known as Full Self-Driving, increased substantially after the robotaxi event. Tesla this month again offered FSD free for a month to its current customers, for the second time this year.
The company said in a statement earlier it remained focused on expanding its vehicle lineup, cutting costs and making critical investments in AI projects and production capacity, despite uncertain demand and rivals pulling back on EV investments.
“Preparations remain underway for our offering of new vehicles – including more affordable models – which we will begin launching in the first half of 2025,” it said.
‘SWEET SPOT’
Tesla’s third-quarter profit margin from vehicle sales, excluding regulatory credits, grew to 17.05% from 14.6% in the prior three-month period, according to Reuters calculations. Wall Street had expected 14.9%, according to 24 analysts polled by Visible Alpha.
But Tesla’s finance boss, Vaibhav Taneja, said it would be “challenging” to sustain these margins in the fourth quarter ending December.
The EV giant said that the labor and material costs of making vehicles, known as the cost of goods sold per vehicle, dropped to its lowest-ever level, about $35,100. Adjusted profit of 72 cents per share in the third quarter beat an average estimate of 58 cents.
Newmont misses profit estimates on higher costs, weaker Nevada output
(Reuters) -Newmont, the world’s top gold producer, missed Wall Street expectations for third-quarter profit on Wednesday, as higher costs and lower production in Nevada took the shine away from a rise in total output.
Shares of the company fell 6.8% after the bell.
Newmont said that its costs rose due to planned maintenance at the Lihir project in Papua New Guinea — which it acquired following a $17 billion buyout of Newcrest — and higher expenditure for contract services across its portfolio.
All-in-sustaining-costs for gold, an industry metric reflecting total expenses, rose to $1,611 per ounce in the July-September quarter, from $1,426 per ounce a year ago.
The Denver, Colorado-based company’s attributable production at the Nevada Gold Mines declined by 19.3% to 242,000 ounces during the third quarter, compared to the year-ago quarter.
Newmont owns a non-operating minority stake in Nevada Gold Mines, along with rival Barrick Gold, whose third-quarter production fell short of Wall Street expectations earlier this month due to lower output at the Nevada mines.
However, the company’s total gold production rose 29.2% to 1.67 million ounces, primarily due to higher production at the Cerro Negro mine in Argentina, where production had suffered earlier due to the death of two workers.
The market had estimated the miner to produce about 1.64 million ounces of gold during the reported period.
Newmont also said it expects to produce 1.8 million gold ounces in the fourth quarter, its highest output of the year, and remained on track to reach its target of receiving $2 billion from divestment proceedings.
The company posted adjusted profit of 81 cents per share, compared to analysts’ expectations of 86 cents per share, according to data compiled by LSEG.
(Reporting by Vallari Srivastava and Sourasis Bose in Bengaluru; editing by Alan Barona)
Senior Vice President Of Steel Dynamics Sold $1.30M In Stock
It was reported on October 22, that James Stanley Anderson, Senior Vice President at Steel Dynamics STLD executed a significant insider sell, according to an SEC filing.
What Happened: After conducting a thorough analysis, Anderson sold 10,000 shares of Steel Dynamics. This information was disclosed in a Form 4 filing with the U.S. Securities and Exchange Commission on Tuesday. The total transaction value is $1,295,450.
Steel Dynamics shares are trading down 0.58% at $131.04 at the time of this writing on Wednesday morning.
Get to Know Steel Dynamics Better
Steel Dynamics Inc operates scrap-based steel minimills with roughly 16 million tons of annual steel production capacity. The company’s segment includes steel operations, metals recycling operations, steel fabrication operations, Aluminum Operations Segment, and others. It generates maximum revenue from the steel operations segment.
Steel Dynamics: Delving into Financials
Revenue Growth: Steel Dynamics’s revenue growth over a period of 3 months has faced challenges. As of 30 September, 2024, the company experienced a revenue decline of approximately -6.28%. This indicates a decrease in the company’s top-line earnings. As compared to competitors, the company encountered difficulties, with a growth rate lower than the average among peers in the Materials sector.
Navigating Financial Profits:
-
Gross Margin: The company faces challenges with a low gross margin of 13.94%, suggesting potential difficulties in cost control and profitability compared to its peers.
-
Earnings per Share (EPS): Steel Dynamics’s EPS lags behind the industry average, indicating concerns and potential challenges with a current EPS of 2.06.
Debt Management: The company maintains a balanced debt approach with a debt-to-equity ratio below industry norms, standing at 0.41.
Valuation Metrics: A Closer Look
-
Price to Earnings (P/E) Ratio: With a lower-than-average P/E ratio of 11.85, the stock indicates an attractive valuation, potentially presenting a buying opportunity.
-
Price to Sales (P/S) Ratio: The current P/S ratio of 1.17 is above industry norms, reflecting an elevated valuation for Steel Dynamics’s stock and potential overvaluation based on sales performance.
-
EV/EBITDA Analysis (Enterprise Value to its Earnings Before Interest, Taxes, Depreciation & Amortization): Boasting an EV/EBITDA ratio of 7.98, Steel Dynamics demonstrates a robust market valuation, outperforming industry benchmarks.
Market Capitalization: Exceeding industry standards, the company’s market capitalization places it above industry average in size relative to peers. This emphasizes its significant scale and robust market position.
Now trade stocks online commission free with Charles Schwab, a trusted and complete investment firm.
The Impact of Insider Transactions on Investments
In the complex landscape of investment decisions, investors should approach insider transactions as part of a comprehensive analysis, considering various elements.
Within the legal framework, an “insider” is defined as any officer, director, or beneficial owner holding more than ten percent of a company’s equity securities as per Section 12 of the Securities Exchange Act of 1934. This includes executives in the c-suite and major hedge funds. These insiders are mandated to disclose their transactions through a Form 4 filing, to be submitted within two business days of the transaction.
The initiation of a new purchase by a company insider serves as a strong indication that they expect the stock to rise.
However, insider sells may not always signal a bearish view and can be influenced by various factors.
Essential Transaction Codes Unveiled
When analyzing transactions, investors tend to focus on those in the open market, detailed in Table I of the Form 4 filing. A P in Box 3 denotes a purchase,while S signifies a sale. Transaction code C signals the conversion of an option, and transaction code A denotes a grant, award, or other acquisition of securities from the company.
Check Out The Full List Of Steel Dynamics’s Insider Trades.
Insider Buying Alert: Profit from C-Suite Moves
Benzinga Edge reveals every insider trade in real-time. Don’t miss the next big stock move driven by insider confidence. Unlock this ultimate sentiment indicator now. Click here for access.
This article was generated by Benzinga’s automated content engine and reviewed by an editor.
Market News and Data brought to you by Benzinga APIs
© 2024 Benzinga.com. Benzinga does not provide investment advice. All rights reserved.
Massive Insider Trade At Steel Dynamics
On October 22, a recent SEC filing unveiled that James Stanley Anderson, Senior Vice President at Steel Dynamics STLD made an insider sell.
What Happened: After conducting a thorough analysis, Anderson sold 10,000 shares of Steel Dynamics. This information was disclosed in a Form 4 filing with the U.S. Securities and Exchange Commission on Tuesday. The total transaction value is $1,295,450.
At Wednesday morning, Steel Dynamics shares are up by 0.13%, trading at $131.97.
Get to Know Steel Dynamics Better
Steel Dynamics Inc operates scrap-based steel minimills with roughly 16 million tons of annual steel production capacity. The company’s segment includes steel operations, metals recycling operations, steel fabrication operations, Aluminum Operations Segment, and others. It generates maximum revenue from the steel operations segment.
Steel Dynamics: Delving into Financials
Decline in Revenue: Over the 3 months period, Steel Dynamics faced challenges, resulting in a decline of approximately -6.28% in revenue growth as of 30 September, 2024. This signifies a reduction in the company’s top-line earnings. When compared to others in the Materials sector, the company faces challenges, achieving a growth rate lower than the average among peers.
Profitability Metrics: Unlocking Value
-
Gross Margin: The company issues a cost efficiency warning with a low gross margin of 13.94%, indicating potential difficulties in maintaining profitability compared to its peers.
-
Earnings per Share (EPS): Steel Dynamics’s EPS reflects a decline, falling below the industry average with a current EPS of 2.06.
Debt Management: Steel Dynamics’s debt-to-equity ratio is below industry norms, indicating a sound financial structure with a ratio of 0.41.
Financial Valuation Breakdown:
-
Price to Earnings (P/E) Ratio: The P/E ratio of 11.85 is lower than the industry average, implying a discounted valuation for Steel Dynamics’s stock.
-
Price to Sales (P/S) Ratio: The current P/S ratio of 1.17 is above industry norms, reflecting an elevated valuation for Steel Dynamics’s stock and potential overvaluation based on sales performance.
-
EV/EBITDA Analysis (Enterprise Value to its Earnings Before Interest, Taxes, Depreciation & Amortization): A high EV/EBITDA ratio of 7.98 positions the company as being more valued compared to industry benchmarks.
Market Capitalization: Exceeding industry standards, the company’s market capitalization places it above industry average in size relative to peers. This emphasizes its significant scale and robust market position.
Now trade stocks online commission free with Charles Schwab, a trusted and complete investment firm.
Uncovering the Importance of Insider Activity
It’s important to note that insider transactions alone should not dictate investment decisions, but they can provide valuable insights.
In the realm of legality, an “insider” is defined as any officer, director, or beneficial owner holding more than ten percent of a company’s equity securities under Section 12 of the Securities Exchange Act of 1934. This includes executives in the c-suite and major hedge funds. These insiders are required to disclose their transactions through a Form 4 filing, to be submitted within two business days of the transaction.
Notably, when a company insider makes a new purchase, it is considered an indicator of their positive expectations for the stock.
Conversely, insider sells may not necessarily signal a bearish stance on the stock and can be motivated by various factors.
Transaction Codes To Focus On
In the domain of transactions, investors frequently turn their focus to those taking place in the open market, as meticulously outlined in Table I of the Form 4 filing. A P in Box 3 indicates a purchase, while S signifies a sale. Transaction code C signals the conversion of an option, and transaction code A denotes a grant, award, or other acquisition of securities from the company.
Check Out The Full List Of Steel Dynamics’s Insider Trades.
Insider Buying Alert: Profit from C-Suite Moves
Benzinga Edge reveals every insider trade in real-time. Don’t miss the next big stock move driven by insider confidence. Unlock this ultimate sentiment indicator now. Click here for access.
This article was generated by Benzinga’s automated content engine and reviewed by an editor.
Market News and Data brought to you by Benzinga APIs
© 2024 Benzinga.com. Benzinga does not provide investment advice. All rights reserved.
Meta CEO Zuckerberg Dismisses Workers Making Over Six Figures For Taking Advantage Of Company Food Delivery Service
Mark Zuckerberg’s tech giant Meta recently dismissed 24 employees from its Los Angeles office for exploiting the company’s $25 meal voucher system to buy nonfood items such as toothpaste, laundry detergent and even wine glasses, according to employees’ posts on the anonymous workplace chat app Blind.
The vouchers, intended for food deliveries when working at the office, had been misused for ordering household items, an issue Meta addressed swiftly by terminating those involved.
Don’t Miss:
Meta, valued at $1.5 trillion, is known for its lavish perks, including free meals at its larger offices, a strategy designed to entice employees back into the workplace amid the rise of remote work. In smaller offices where on-site dining options aren’t available, employees are provided with meal credits for delivery services like Grubhub. This benefit, however, appears to have been stretched beyond its intended purpose by some staff.
According to The Financial Times, the misuse of meal vouchers had been happening for a while, with some employees regularly ordering cosmetics and groceries. Despite initial warnings, the situation persisted, leading to the recent terminations. Surprisingly, these sackings also involved some high-earning engineers with six-figure salaries.
Trending: This Adobe-backed AI marketing startup went from a $5 to $85 million valuation working with brands like L’Oréal, Hasbro, and Sweetgreen in just three years – here’s how there’s an opportunity to invest at $1,000 for only $0.50/share today.
While the staff involved had been given prior warnings, their continued misuse ultimately resulted in their dismissals.
This news comes as Meta makes broader cuts across several divisions, including WhatsApp, Instagram and its virtual reality unit. The company cited restructuring efforts aimed at realigning resources with long-term strategic goals.
Meta spokespersons have not directly commented on the meal voucher scandal but reiterated that restructuring involves shifting teams and roles to more critical business areas.
See Also: Maker of the $60,000 foldable home has 3 factory buildings, 600+ houses built, and big plans to solve housing — you can become an investor for $0.80 per share today.
“Today, a few teams at Meta are making changes to ensure resources are aligned with their long-term strategic goals and location strategy,” said Meta spokesperson David Arnold in a statement. “This includes moving some teams to different locations and reallocating employees into new roles. In cases where a role is eliminated, we work hard to find new opportunities within the company.”
‘You could at least kiss me’: Lawsuit reveals decades of employee texts sent to billionaire Marc Lasry in blackmail scheme
Billionaire chief executive and chairman Marc Lasry is suing ex-employee Gina Strum, alleging she carried on a decade-long campaign of harassment, lies, and blackmail and is now trying to illicitly siphon millions from Lasry and his firm.
The suit—filed jointly with his sister Sonia Gardner and the firm they cofounded together, Avenue Capital—lists a litany of alleged grievances against Strum, including obsessive and inappropriate texts to Lasry that he repeatedly rebuffed, even as they tried to placate her with phone calls, meetings, and emails. Lasry and Gardner alleged they suffered through it because they feared Strum would carry out her threats to take down both Lasry and the $12 billion global investment firm he built for 30 years alongside his sibling, the complaint states. For years, Strum allegedly alternated between praising the firm when she felt she was on the receiving end of attention and money, and then menacing them when that stopped.
The complaint alleges that Strum recently escalated her threats, saying she would make it “really, really ugly” for Lasry and Avenue Capital unless she was paid $50 million, and would destroy Lasry’s reputation personally. The suit also includes alleged lines from text messages and emails Strum sent to Lasry over the years that the complaint described as “personal, obsessive, and simply inappropriate.” The suit alleges Strum also sent photos and videos of herself to Lasry in low-cut tops, seeking his response.
For instance, Strum allegedly wrote: “U wonder why I love you so much.” And then, “Did you forget about me? My life doesn’t really work without you. Stop punishing me.” Plus, “You are a lovebug to me.” Also: “And one more thought- if I had to go through therapy and all this shit just to talk to you. You could at least kiss me. We would know everything then.”
The complaint alleges Strum would compliment Lasry’s appearance, including a black turtleneck that caused her to start “sweating.” She also allegedly told him he looked “cute,” and allegedly updated him when she went to be checked out for “Girly bits.”
Another alleges Strum wrote she was “def lonely and flirting with you.” The complaint states that Lasry apologized to Strum for being lonely, and said he could be a friend to her, “but it can never be more than that.”
The suit says Strum was employed by Avenue Capital from 2009 to 2013 but worked as a consultant on occasion in the years that followed. Strum’s LinkedIn lists her employment with Avenue Capital as managing director from 2009 to 2017. Avenue Capital’s specialty is distressed assets, which includes investing in real estate debt. Lasry has an estimated net worth of almost $2 billion, per Forbes. Unrelatedly, he’s a longtime democratic donor, according to campaign finance data from the Federal Election Commission.

