I'm Earning $275k This Year. Can I Use a Backdoor Roth Strategy to Reduce Taxes?
SmartAsset and Yahoo Finance LLC may earn commission or revenue through links in the content below.
If you’re making $275,000 a year, you can’t contribute to a Roth IRA due to income limits. However, a backdoor conversion can allow a high earner to sock away unlimited sums in a Roth account, enabling tax-free requirement withdrawals and a way past pesky required minimum distribution rules (RMDs) that many pretax retirement account require. But this will likely require sufficient after-tax funds – such as from a non-retirement bank account or brokerage account – to pay the upfront tax bill that a backdoor conversion strategy generates.
Conversions are most advisable for savers who will be in a higher tax bracket after retirement. Assuming these conditions are met, a backdoor conversion can be a useful method of avoiding Required Minimum Distributions (RMDs) and enjoying tax-free withdrawals in retirement. Consider discussing a Roth backdoor conversion with a financial advisor to make sure you understand the ins and outs of this strategy.
Roth retirement accounts allow savers to use after-tax money to fund accounts where investments accumulate earnings tax-free and, in most circumstances, withdrawals are also tax-free. Another appealing feature of Roth accounts is that they are exempt from RMD rules requiring savers to begin withdrawing from pre-tax savings accounts such as IRAs and 401(k)s after age 73, which can expose retirees to unwelcome tax bills.
Roth IRAs also have income limits that make them inaccessible to some high earners. For 2024, individuals earning $161,000, married couples filing jointly earning $240,000 and married couples filing separately earning $10,000 are all prohibited from contributing to Roth retirement accounts at all.
However, since 2010 it’s been possible for a saver to convert unlimited funds from a pre-tax retirement account to a Roth account. This backdoor conversion, as it’s known, has become a popular way for people who earn and lot and have saved a lot to get the advantages of Roth accounts.
To perform a backdoor conversion, a saver can transfer funds from a pre-tax retirement account such as a 401(k). 401(k)s and other qualified accounts may not limit an investor based on his or her income, and its annual contribution limits are also much higher than Roth IRA contribution caps. Next, they transfer funds from their other retirement account to a new Roth IRA account. Because the funds from the 401(k) are pre-tax, the saver will have to pay income taxes on the converted amounts in that tax year, as if they were withdrawals treated as ordinary income. A large transfer can generate a large tax bill if the entire amount is converted at once. Sometimes conversions of large IRAs are done gradually over several years to manage the tax bill and keep the person in lower tax brackets.
Apple iPhone 16 Discounts Roll Out on Alibaba's Tmall, AI Delays and Domestic Competitors Fuel Aggressive Pricing
Apple Inc AAPL has reduced iPhone 16 prices by up to 1,600 yuan ($225) on its Alibaba Group Holding’s BABA Tmall store to boost sales during Singles’ Day, the world’s largest shopping festival.
Beginning Monday evening, Apple offered a 500-yuan voucher for all iPhone 16 models, with the base iPhone 16 and iPhone 16 Pro Max starting at 5,499 yuan and 9,499 yuan, respectively, SCMP reports.
These price cuts come as Apple aims to counter the lukewarm initial response to the iPhone 16 on Chinese social media.
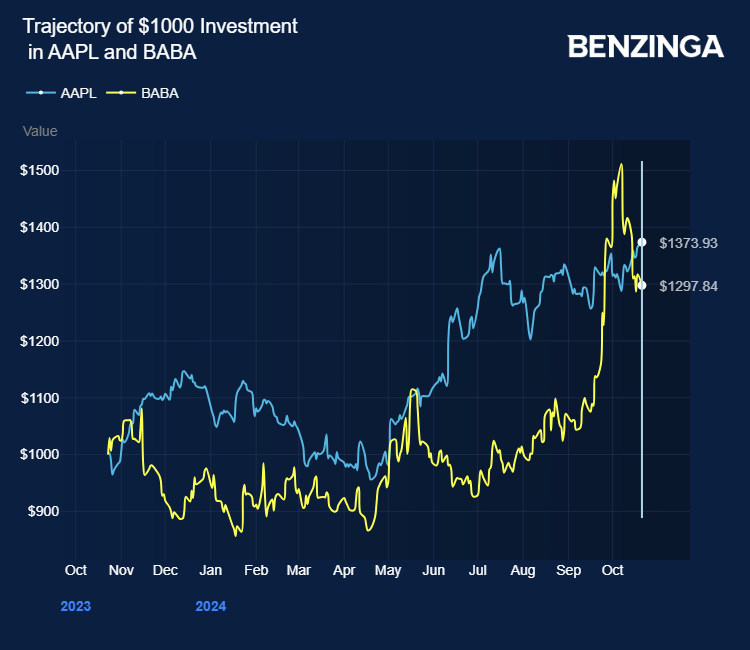
The discounting is partly due to Apple Intelligence’s on-device AI system not supporting Chinese until next year.
Tmall has also introduced a trade-in subsidy of up to 1,100 yuan, allowing customers to save as much as 1,600 yuan on iPhone 16 purchases. JD.com Inc JD announced a similar discount, offering a free AppleCare+ subscription for the iPhone 16’s base and Plus models. PDD Holdings Inc PDD Pinduoduo further slashed prices, with the 256GB iPhone 16 Pro Max now priced at 9,199 yuan.
Riding the success of its 5G comeback, Huawei Technologies Co outpaced Apple in mainland smartphone sales in August for the first time in 46 months, SCMP cites CINNO Research.
Prior reports indicated that Pinduoduo and Taobao were slashing the prices of the iPhone 16 series before its official release due to its lack of AI features.
Pinduoduo started selling the iPhone 16 Plus with 512 gigabytes of storage at a 10% discount and the 128GB iPhone 16 at an 11% discount. Both Pinduoduo and Taobao marketplace have slapped a 4% discount on the 256GB version of the high-end iPhone 16 Pro Max.
Needham analyst Laura Martin expects the iPhone to constitute 89%- 96% of Apple’s fiscal 2025 revenue.
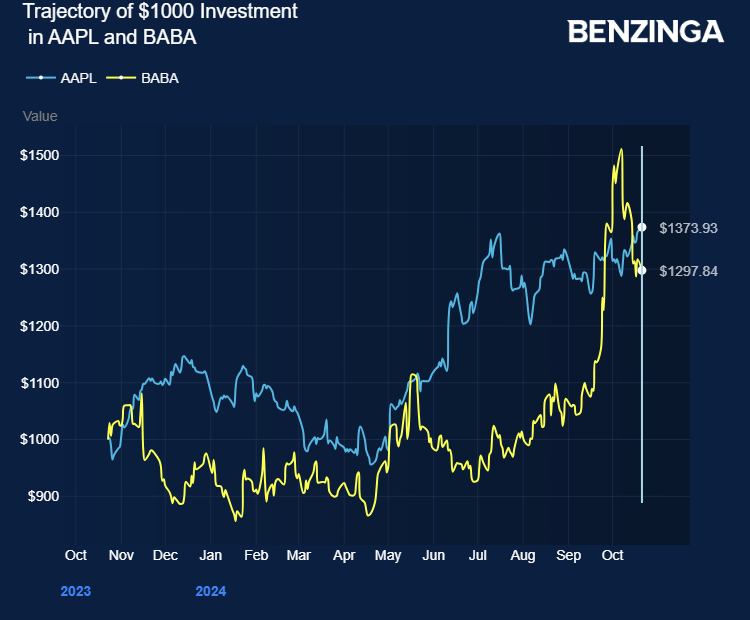
Apple stock gained 37% in the last 12 months. Investors can gain exposure to the stock through Vanguard Information Tech ETF VGT and iShares Russell 1000 Growth ETF IWF.
Price Action: AAPL stock is down 0.99% at $234.13 at the last check on Tuesday.
Also Read:
Photo courtesy: Apple
This content was partially produced with the help of AI tools and was reviewed and published by Benzinga editors.
Market News and Data brought to you by Benzinga APIs
© 2024 Benzinga.com. Benzinga does not provide investment advice. All rights reserved.
CACI International's Earnings Outlook
CACI International CACI is preparing to release its quarterly earnings on Wednesday, 2024-10-23. Here’s a brief overview of what investors should keep in mind before the announcement.
Analysts expect CACI International to report an earnings per share (EPS) of $5.06.
The announcement from CACI International is eagerly anticipated, with investors seeking news of surpassing estimates and favorable guidance for the next quarter.
It’s worth noting for new investors that guidance can be a key determinant of stock price movements.
Overview of Past Earnings
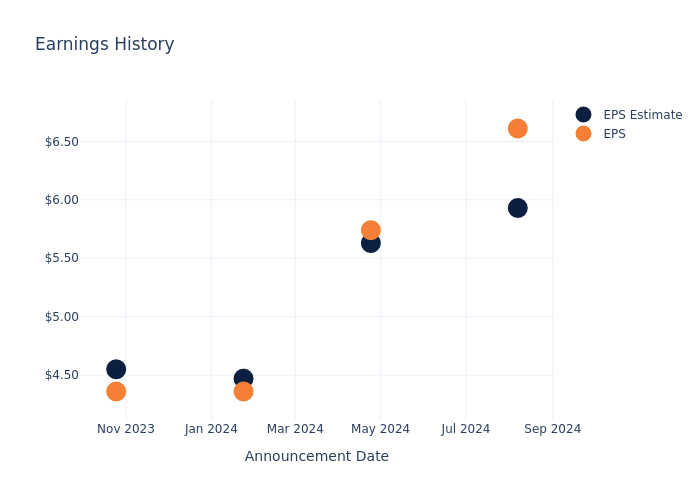
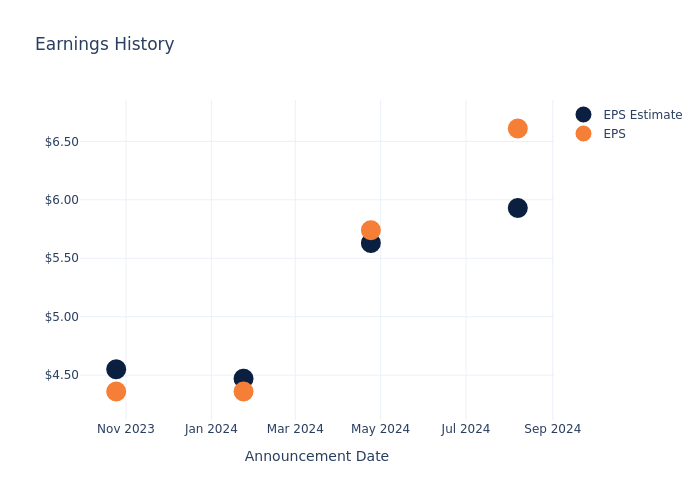
The company’s EPS beat by $0.68 in the last quarter, leading to a 3.05% increase in the share price on the following day.
Here’s a look at CACI International’s past performance and the resulting price change:
| Quarter | Q4 2024 | Q3 2024 | Q2 2024 | Q1 2024 |
|---|---|---|---|---|
| EPS Estimate | 5.93 | 5.63 | 4.47 | 4.55 |
| EPS Actual | 6.61 | 5.74 | 4.36 | 4.36 |
| Price Change % | 3.0% | 6.0% | -2.0% | 2.0% |
Stock Performance
Shares of CACI International were trading at $532.16 as of October 21. Over the last 52-week period, shares are up 64.36%. Given that these returns are generally positive, long-term shareholders are likely bullish going into this earnings release.
Analyst Opinions on CACI International
For investors, staying informed about market sentiments and expectations in the industry is paramount. This analysis provides an exploration of the latest insights on CACI International.
A total of 6 analyst ratings have been received for CACI International, with the consensus rating being Buy. The average one-year price target stands at $540.33, suggesting a potential 1.54% upside.
Peer Ratings Overview
This comparison focuses on the analyst ratings and average 1-year price targets of Parsons, UL Solutions and KBR, three major players in the industry, shedding light on their relative performance expectations and market positioning.
- As per analysts’ assessments, Parsons is favoring an Outperform trajectory, with an average 1-year price target of $105.0, suggesting a potential 80.27% downside.
- UL Solutions received a Neutral consensus from analysts, with an average 1-year price target of $53.5, implying a potential 89.95% downside.
- Analysts currently favor an Buy trajectory for KBR, with an average 1-year price target of $76.33, suggesting a potential 85.66% downside.
Comprehensive Peer Analysis Summary
In the peer analysis summary, key metrics for Parsons, UL Solutions and KBR are highlighted, providing an understanding of their respective standings within the industry and offering insights into their market positions and comparative performance.
| Company | Consensus | Revenue Growth | Gross Profit | Return on Equity |
|---|---|---|---|---|
| CACI International | Buy | 19.68% | $197.75M | 3.91% |
| Parsons | Outperform | 23.15% | $351.54M | 3.17% |
| UL Solutions | Neutral | 5.95% | $366M | 14.03% |
| KBR | Buy | 5.82% | $271M | 7.54% |
Key Takeaway:
CACI International ranks highest in Gross Profit among its peers. It is in the middle for Revenue Growth and Return on Equity.
Delving into CACI International’s Background
CACI International Inc is an information solutions and services provider, offering information solutions and services to its customers. The company’s primary customers are agencies and departments of the U.S. government, which account for the vast majority of the firm’s revenue. It provides information solutions and services supporting national security missions and government modernization for intelligence, defense, and federal civilian customers. Some of the services provided by the company are functional software development, data, and business analysis, IT operations support, naval architecture, and life cycle support intelligence among others. The company’s operating segments are; Domestic operations and International operations. It derives key revenue from the Domestic segment.
CACI International: Delving into Financials
Market Capitalization Highlights: Above the industry average, the company’s market capitalization signifies a significant scale, indicating strong confidence and market prominence.
Positive Revenue Trend: Examining CACI International’s financials over 3 months reveals a positive narrative. The company achieved a noteworthy revenue growth rate of 19.68% as of 30 June, 2024, showcasing a substantial increase in top-line earnings. As compared to its peers, the company achieved a growth rate higher than the average among peers in Industrials sector.
Net Margin: The company’s net margin is a standout performer, exceeding industry averages. With an impressive net margin of 6.61%, the company showcases strong profitability and effective cost control.
Return on Equity (ROE): CACI International’s ROE is below industry standards, pointing towards difficulties in efficiently utilizing equity capital. With an ROE of 3.91%, the company may encounter challenges in delivering satisfactory returns for shareholders.
Return on Assets (ROA): CACI International’s ROA surpasses industry standards, highlighting the company’s exceptional financial performance. With an impressive 1.98% ROA, the company effectively utilizes its assets for optimal returns.
Debt Management: CACI International’s debt-to-equity ratio is below the industry average at 0.55, reflecting a lower dependency on debt financing and a more conservative financial approach.
To track all earnings releases for CACI International visit their earnings calendar on our site.
This article was generated by Benzinga’s automated content engine and reviewed by an editor.
© 2024 Benzinga.com. Benzinga does not provide investment advice. All rights reserved.
Bitmedia Introduces Groundbreaking Wallet Targeting Technology For Web3 Advertising
Bitmedia.IO proudly announces the launch of its innovative Wallet Targeting Technology. This new feature marks an important point in Web3 advertising, offering advertisers the ability to tap into targeted blockchain audiences with unprecedented accuracy. With this wallet-targeting technology and advanced conversion tracking, Bitmedia.IO provides a platform for unmatched ROI, transforming the way brands connect with their Web3 customers.
How Bitmedia.io’s Wallet Targeting Works:
The process begins with anonymous data collection, as users connect their wallets through Bitmedia’s data providers or publishers. An anonymous ID is assigned to their device, ensuring privacy while facilitating targeted advertising based on blockchain activity.
Audience segmentation follows, with blockchain indexing to categorize individuals by their wallet’s holdings and activities. This allows for an understanding of the unique preferences and behaviors within the crypto community, leading to the display of highly relevant, personalized Web3 ads.
Furthermore, Bitmedia’s innovative Web3 cookie library supports end-to-end user engagement tracking, from ad exposure to conversion. This capability clearly shows advertisers their campaign’s effectiveness and ROI.
The company aims to expand the range of Web3 audiences further, particularly focusing on enhancing categories such as users with NFTs, coin holders across various crypto like BNB, ETH, and USDT, as well as those engaged in specific sectors like DEX/DeFi, betting, and gambling. Currently, the company identifies the following segments of Web3 audiences:
- Crypto Traders – Active market participants buying and selling crypto.
- NFT Holders – Collectors or investors owning Non-Fungible Tokens.
- Crypto Degens – High-risk crypto enthusiasts often engage in speculative investments.
- Hodlers – Individuals holding onto their cryptocurrencies long-term, regardless of market volatility.
- Holders – Individuals with diverse crypto portfolios (e.g., BNB, ETH, Matic, USDT).
- Niche Coin Enthusiasts – Users invested in specific coin categories like NFT, DEX, DeFi, and Exchange.
- Gaming/Gambling Token Gamers – Participants in betting/gambling platforms utilizing specific crypto.
Additionally, Bitmedia is committed to improving its wallet-targeting feature to better serve these diverse groups
“Wallet-based targeting opens a lot of opportunities for advertisers in terms of finding their audience and understanding it better. It is a great tool that will optimize conversion costs for our clients by making it easier to find the right customer. We will offer our users targeting options based on the assets held, and interests like NFT, games, trading etc. Bitmedia will be expanding and customizing our audience-targeting features on the go so go ahead, try it out, and share your feedback with us!“
Tanya Petrusenko, CEO at Bitmedia.IO
Step into the Future of Web3 Advertising with Bitmedia.IO
Using traditional Web 2.0 marketing strategies with the innovative capabilities of Web 3.0, Bitmedia opens up new opportunities for Web3 audience engagement and transforms the targeting of Web3 wallet owners into a key competitive advantage for crypto brands.
For more information and to launch your Web3 campaign, visit Bitmedia.IO.
This post was authored by an external contributor and does not represent Benzinga’s opinions and has not been edited for content. The information contained above is provided for informational and educational purposes only, and nothing contained herein should be construed as investment advice. Benzinga does not make any recommendation to buy or sell any security or any representation about the financial condition of any company.
Market News and Data brought to you by Benzinga APIs
© 2024 Benzinga.com. Benzinga does not provide investment advice. All rights reserved.
Check Out What Whales Are Doing With HIMS
Deep-pocketed investors have adopted a bearish approach towards Hims & Hers Health HIMS, and it’s something market players shouldn’t ignore. Our tracking of public options records at Benzinga unveiled this significant move today. The identity of these investors remains unknown, but such a substantial move in HIMS usually suggests something big is about to happen.
We gleaned this information from our observations today when Benzinga’s options scanner highlighted 16 extraordinary options activities for Hims & Hers Health. This level of activity is out of the ordinary.
The general mood among these heavyweight investors is divided, with 43% leaning bullish and 56% bearish. Among these notable options, 3 are puts, totaling $166,650, and 13 are calls, amounting to $1,382,465.
Projected Price Targets
After evaluating the trading volumes and Open Interest, it’s evident that the major market movers are focusing on a price band between $13.0 and $35.0 for Hims & Hers Health, spanning the last three months.
Volume & Open Interest Development
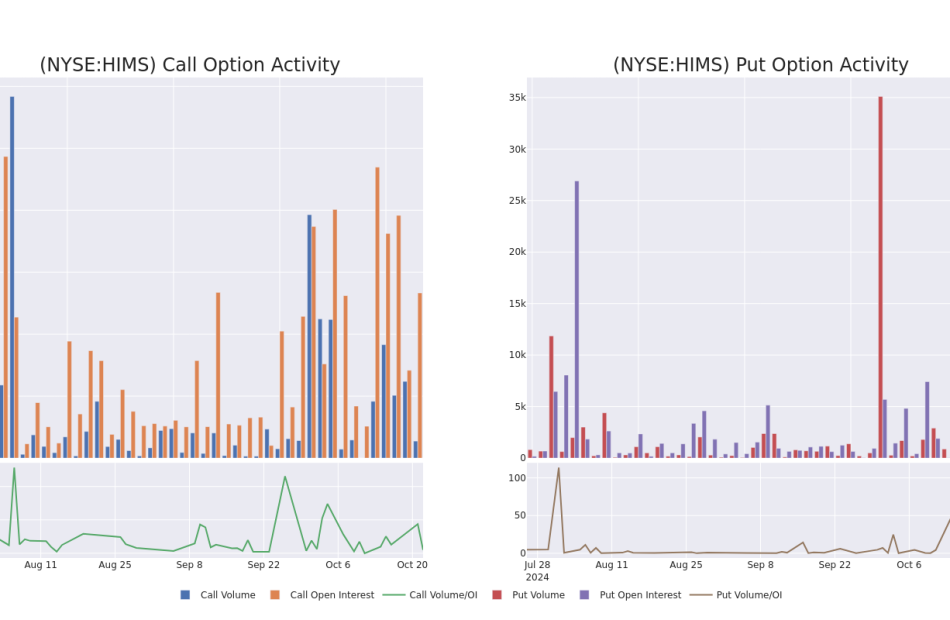
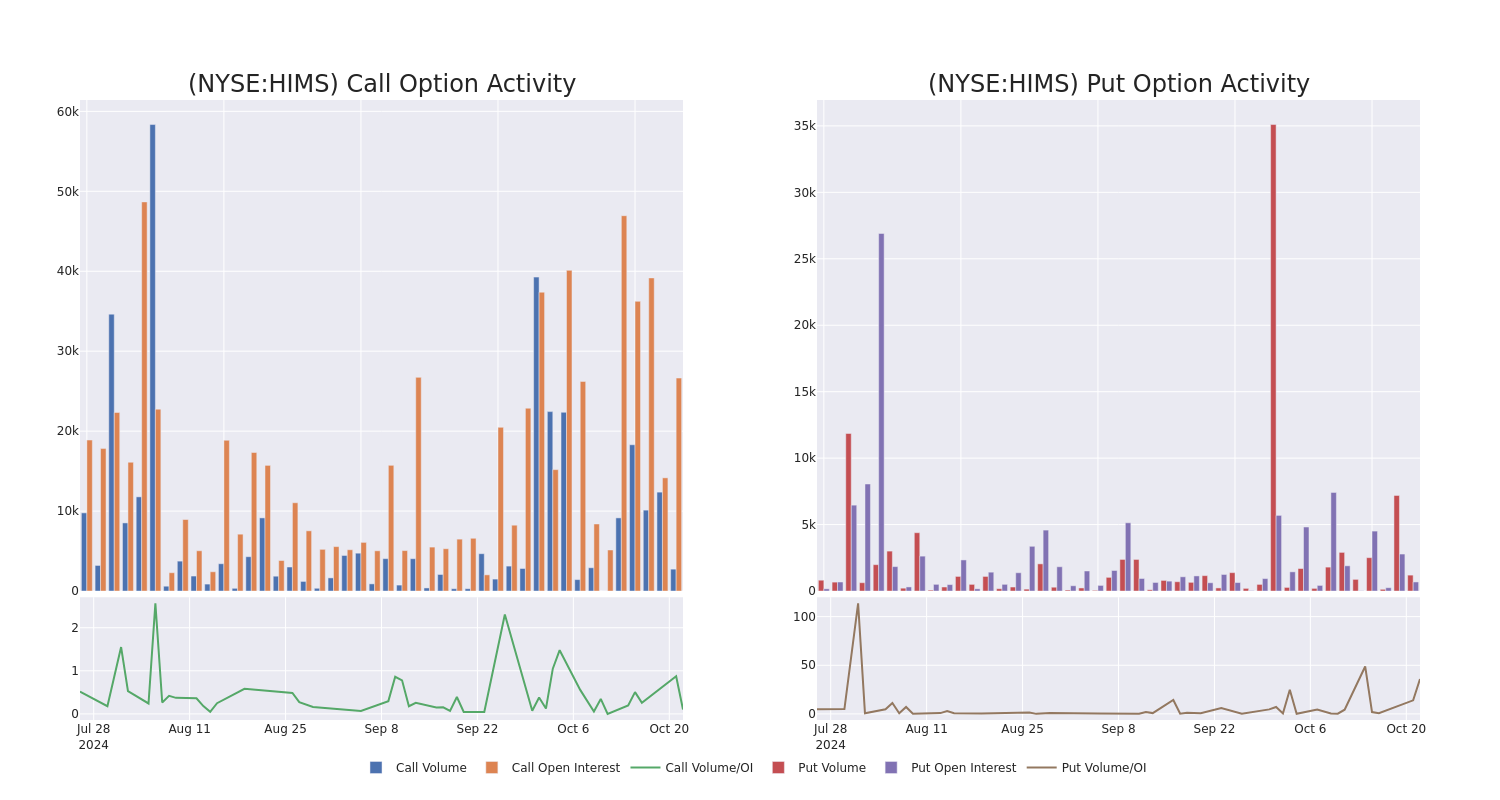
Looking at the volume and open interest is a powerful move while trading options. This data can help you track the liquidity and interest for Hims & Hers Health’s options for a given strike price. Below, we can observe the evolution of the volume and open interest of calls and puts, respectively, for all of Hims & Hers Health’s whale trades within a strike price range from $13.0 to $35.0 in the last 30 days.
Hims & Hers Health Call and Put Volume: 30-Day Overview
Significant Options Trades Detected:
| Symbol | PUT/CALL | Trade Type | Sentiment | Exp. Date | Ask | Bid | Price | Strike Price | Total Trade Price | Open Interest | Volume |
|---|---|---|---|---|---|---|---|---|---|---|---|
| HIMS | CALL | SWEEP | BULLISH | 11/15/24 | $3.4 | $3.2 | $3.38 | $21.50 | $336.4K | 12 | 1.0K |
| HIMS | CALL | TRADE | BULLISH | 01/17/25 | $7.2 | $7.1 | $7.2 | $17.00 | $323.2K | 2.4K | 474 |
| HIMS | CALL | TRADE | BEARISH | 01/17/25 | $6.0 | $5.8 | $5.85 | $19.00 | $234.0K | 1.4K | 400 |
| HIMS | CALL | SWEEP | BEARISH | 01/17/25 | $3.1 | $3.0 | $3.02 | $25.00 | $120.6K | 5.5K | 411 |
| HIMS | PUT | TRADE | BULLISH | 01/17/25 | $7.0 | $6.9 | $6.9 | $28.00 | $69.0K | 194 | 100 |
About Hims & Hers Health
Hims & Hers Health Inc is a multi-specialty telehealth platform that connects consumers to licensed healthcare professionals, enabling them to access high-quality medical care for numerous conditions related to mental health, sexual health, dermatology, primary care, and more.
In light of the recent options history for Hims & Hers Health, it’s now appropriate to focus on the company itself. We aim to explore its current performance.
Where Is Hims & Hers Health Standing Right Now?
- Currently trading with a volume of 4,706,782, the HIMS’s price is down by -1.08%, now at $22.8.
- RSI readings suggest the stock is currently may be approaching overbought.
- Anticipated earnings release is in 13 days.
What The Experts Say On Hims & Hers Health
Over the past month, 2 industry analysts have shared their insights on this stock, proposing an average target price of $24.0.
Turn $1000 into $1270 in just 20 days?
20-year pro options trader reveals his one-line chart technique that shows when to buy and sell. Copy his trades, which have had averaged a 27% profit every 20 days. Click here for access.
* Consistent in their evaluation, an analyst from B of A Securities keeps a Buy rating on Hims & Hers Health with a target price of $25.
* Maintaining their stance, an analyst from B of A Securities continues to hold a Buy rating for Hims & Hers Health, targeting a price of $23.
Options trading presents higher risks and potential rewards. Astute traders manage these risks by continually educating themselves, adapting their strategies, monitoring multiple indicators, and keeping a close eye on market movements. Stay informed about the latest Hims & Hers Health options trades with real-time alerts from Benzinga Pro.
Market News and Data brought to you by Benzinga APIs
© 2024 Benzinga.com. Benzinga does not provide investment advice. All rights reserved.
US Stock Futures Slide With Rate-Cut Path at Risk: Markets Wrap
(Bloomberg) — Stocks wavered as traders mulled prospects for a slower pace of Federal Reserve rate cuts. Treasury 10-year yields hovered near 4.2%.
Most Read from Bloomberg
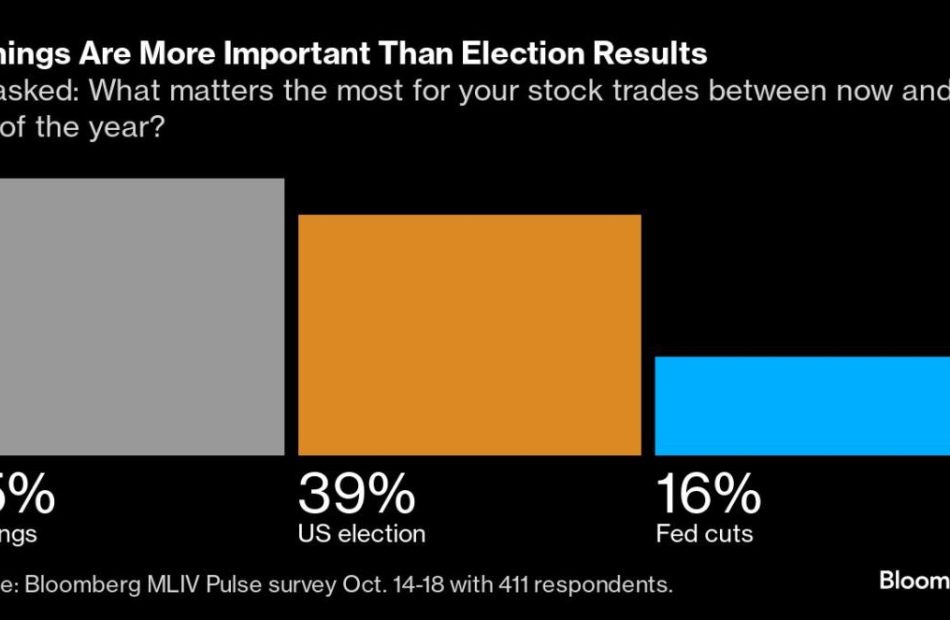
Wall Street is paring back bets on aggressive policy easing as the US economy remains robust while Fed officials sound a cautious tone over the pace of future rate decreases. Rising oil prices and the prospect of bigger fiscal deficits after the upcoming presidential election are only compounding the market’s concerns. Since the end of last week, traders have trimmed the extent of expected Fed cuts through September 2025 by more than 10 basis points.
“Of course, higher yields do not have to be negative for stocks. Let’s face it, the stock market has been advancing as these bond yields have been rising for a full month now,” said Matt Maley at Miller Tabak + Co. “However, given how expensive the market is today, these higher yields could cause some problems for the equity market before too long.”
Exposure to the S&P 500 has reached levels that were followed by a 10% slump in the past, according to Citigroup Inc. strategists. Long positions on futures linked to the benchmark index are at the highest since mid-2023 and are looking “particularly extended,” the team led by Chris Montagu wrote.
The S&P 500 was little changed. The Nasdaq 100 rose 0.1%. The Dow Jones Industrial Average was little changed. In late hours, Texas Instruments Inc. gave a lackluster revenue forecast for the fourth quarter. Starbucks Corp.’s guidance will be suspended for 2025.
Treasury 10-year yields were little changed at 4.20%. The euro hit the lowest since early August amid bets the European Central Bank will keep lowering rates. Options traders are increasing bets that Bitcoin will reach $80,000 by the end of November no matter who wins the US election.
Oil advanced as traders tracked tensions between Israel and Iran. Gold climbed to a fresh record.
The stock market has rallied this year thanks to a resilient economy, strong corporate profits and speculation about artificial-intelligence breakthroughs — sending the S&P 500 up over 20%. Yet risks keep surfacing: from a tight US election to war in the Middle East and uncertainty around the trajectory of Fed easing.
P/E Ratio Insights for Shift4 Payments
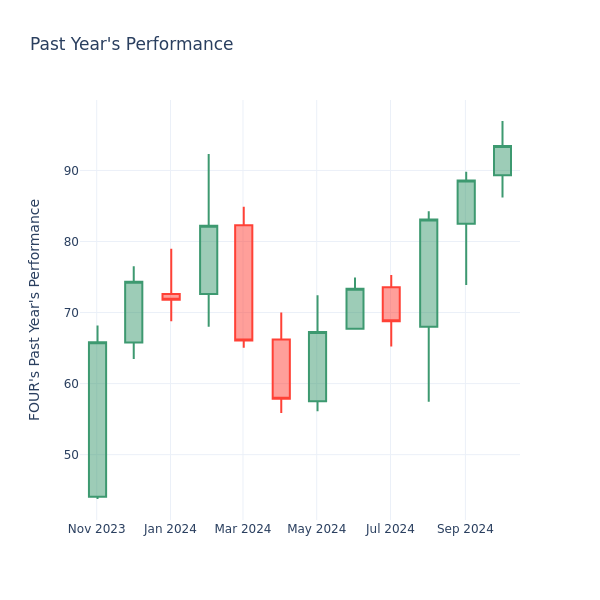
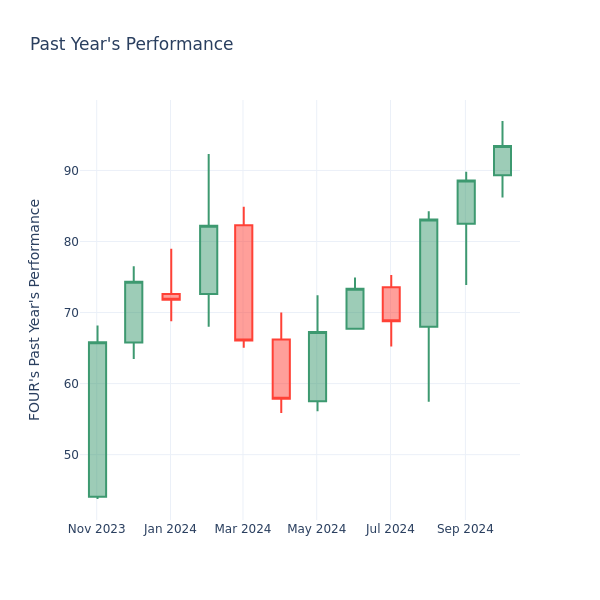
In the current market session, Shift4 Payments Inc. FOUR stock price is at $93.44, after a 1.22% decrease. However, over the past month, the company’s stock increased by 7.41%, and in the past year, by 102.95%. Shareholders might be interested in knowing whether the stock is overvalued, even if the company is not performing up to par in the current session.
Comparing Shift4 Payments P/E Against Its Peers
The P/E ratio is used by long-term shareholders to assess the company’s market performance against aggregate market data, historical earnings, and the industry at large. A lower P/E could indicate that shareholders do not expect the stock to perform better in the future or it could mean that the company is undervalued.
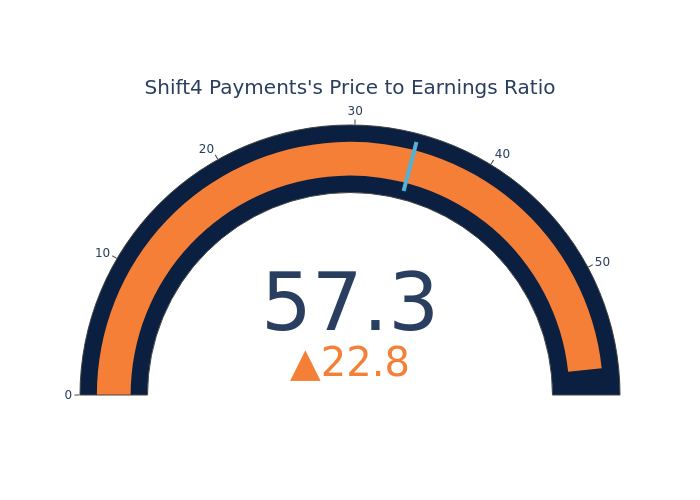
Shift4 Payments has a better P/E ratio of 57.33 than the aggregate P/E ratio of 34.45 of the Financial Services industry. Ideally, one might believe that Shift4 Payments Inc. might perform better in the future than it’s industry group, but it’s probable that the stock is overvalued.
In conclusion, the price-to-earnings ratio is a useful metric for analyzing a company’s market performance, but it has its limitations. While a lower P/E can indicate that a company is undervalued, it can also suggest that shareholders do not expect future growth. Additionally, the P/E ratio should not be used in isolation, as other factors such as industry trends and business cycles can also impact a company’s stock price. Therefore, investors should use the P/E ratio in conjunction with other financial metrics and qualitative analysis to make informed investment decisions.
Market News and Data brought to you by Benzinga APIs
© 2024 Benzinga.com. Benzinga does not provide investment advice. All rights reserved.
Motion Control Market Size is Expected to Reach US$ 35.52 Billion by 2033 | Fact.MR Report
Rockville, MD, Oct. 22, 2024 (GLOBE NEWSWIRE) — The global motion control market is predicted to touch US$ 35.52 billion by 2033, advancing at 5.1% CAGR from 2023 to 2033, as per the latest industry analysis by Fact.MR, a market research and competitive intelligence provider.
The market is expanding steadily as a result of numerous major factors. Automation and industrialization are in high demand across many industries. Companies are looking for ways to increase their manufacturing operations’ productivity, efficiency, and quality. Motion control systems provide precise positioning, speed control, and machinery synchronization, allowing industries to automate activities and optimize production lines.
Developments in motion control technologies, such as motor design, sensor technology, and control algorithms, have broadened the application possibilities and enhanced the appeal of motion control systems. These technical improvements have increased the performance, dependability, and integration capabilities of motion control systems, resulting in their widespread acceptance in industries around the world.
Integration of motion control systems with emerging technologies like the Industrial Internet of Things (IIoT) and Industry 4.0 is contributing to market expansion. Industries can acquire and analyze data, enable predictive maintenance, and accomplish real-time monitoring and control by linking motion control systems to networks. This integration enables streamlined operations, increased efficiency, and less downtime.
For More Insights into the Market, Request a Sample of this Report:
https://www.factmr.com/connectus/sample?flag=S&rep_id=335

Key Takeaways from Market Study:
- The global motion control market amounted to US$ 21.60 billion in 2023.
- Worldwide demand for motion control systems is anticipated to rise at a CAGR of 5.1% over the next ten years.
- The global market is set to garner US$ 35.52 billion by 2033.
- The Chinese market is expected to reach US$ 7.74 billion by 2033.
- Demand for AC servo motors is estimated to expand at a CAGR of 5.8% during the study period.
“Motion control systems are becoming more popular as the demand for automation and industrialization grows across industries. Companies are seeking ways to increase efficiency, productivity, and quality in their production processes, which has led to a growth in the use of motion control systems. Furthermore, expanding industries in emerging economies and favourable government measures to boost automation are driving market expansion,” says a Fact.MR analyst.
Leading Players Driving Innovation in the Motion Control Market:
The global motion control market players are Siemens AG, ABB Group, Schneider Electric, Rockwell Automation Inc, STM Microelectronics, Eaton Corp. Plc, Galil Motion Control, Kollmorgen Corp., Mitsubishi Electric Corp., Moog Inc.
Regional Analysis:
Asia Pacific, particularly China, India, and South Korea, is witnessing significant growth in the global motion control market. In China, rapid industrialization, government support for automation, and a thriving manufacturing sector are driving the demand for motion control systems.
Renowned for its technological prowess, Japan is a major market in the region. The country’s advanced manufacturing capabilities, particularly in the automotive and electronics sectors, necessitate precise motion control, leading to increased adoption of motion control systems. Moreover, South Korea, with its strong presence in the electronics and robotics industries, also contributing to market growth.
Overall, the Asia Pacific region, including China, Japan, and South Korea, is a key driver of the global motion control market, fueled by industrial growth, technological advancements, and the increasing adoption of automation in various sectors.
Get Customization on this Report for Specific Research Solutions:
https://www.factmr.com/connectus/sample?flag=S&rep_id=335
Motion Control Industry News:
- In January 2022, Moen introduced the Smart Faucet, which features cutting-edge motion control technology for completely touchless operation. With the innovative touchless technology in the next-generation Smart Faucet with motion control, users may regulate the water flow and temperature with only a few hand gestures.
More Valuable Insights on Offer:
Fact.MR, in its new offering, presents an unbiased analysis of the global motion control market, presenting historical demand data (2018 to 2022) and forecast statistics for the period of 2023 to 2033.
The study divulges essential insights on the market based on component type (motion controllers, AC drives, AC servo motors, sensors & feedback services, actuators & mechanical systems), end use (food & beverages, aerospace & defense, automotive, semiconductor & electronics, metals & machinery manufacturing, medical, printing & paper), and application (metal cutting, metal forming, material handling equipment, semiconductor machinery, packaging & labelling, robotics), across five major regions (North America, Europe, Asia Pacific, Latin America, and Middle East & Africa).
Check out More Related Studies Published by Fact.MR:
Drone Market: Sales are evaluated to climb to US$ 223.66 billion by the end of 2034, up from US$ 29.96 billion in 2024. The global drone market size is projected to expand at a remarkable CAGR of 22.3% from 2024 to 2034.
Automotive Headliner Market: Size is approximated at US$ 9.9 billion in 2024 and is forecasted to increase at a CAGR of 4% to reach US$ 14.6 billion by 2034-end.
Motorcycle Accessory Market: Size is poised to reach US$ 8.81 billion in 2024. The market has been projected to expand at a CAGR of 3.6% and reach a valuation of US$ 21.05 billion by the end of 2034.
Heavy Duty Truck Market: Sales are forecasted to increase at a CAGR of 4.6% and reach US$ 305.46 billion by 2034-end.
Third-Party Logistics Market: Demand for 3PL logistics solutions is projected to reach a market value of US$ 2.5 billion by 2034, registering a CAGR of 7.6% from 2024 to 2034.
Autonomous Farm Equipment Market: Size is anticipated to increase from a value of US$ 1.1 billion in 2024 to US$ 4.59 billion by 2034, as revealed in the recently updated industry report by Fact.MR.
About Us:
Fact.MR is a distinguished market research company renowned for its comprehensive market reports and invaluable business insights. As a prominent player in business intelligence, we deliver deep analysis, uncovering market trends, growth paths, and competitive landscapes. Renowned for its commitment to accuracy and reliability, we empower businesses with crucial data and strategic recommendations, facilitating informed decision-making and enhancing market positioning.
With its unwavering dedication to providing reliable market intelligence, FACT.MR continues to assist companies in navigating dynamic market challenges with confidence and achieving long-term success. With a global presence and a team of experienced analysts, FACT.MR ensures its clients receive actionable insights to capitalize on emerging opportunities and stay competitive.
Contact:
11140 Rockville Pike
Suite 400
Rockville, MD 20852
United States
Tel: +1 (628) 251-1583
Sales Team: sales@factmr.com
Follow Us: LinkedIn | Twitter | Blog

© 2024 Benzinga.com. Benzinga does not provide investment advice. All rights reserved.


