Earnings Preview: SLM
SLM SLM is set to give its latest quarterly earnings report on Wednesday, 2024-10-23. Here’s what investors need to know before the announcement.
Analysts estimate that SLM will report an earnings per share (EPS) of $0.06.
SLM bulls will hope to hear the company announce they’ve not only beaten that estimate, but also to provide positive guidance, or forecasted growth, for the next quarter.
New investors should note that it is sometimes not an earnings beat or miss that most affects the price of a stock, but the guidance (or forecast).
Earnings History Snapshot
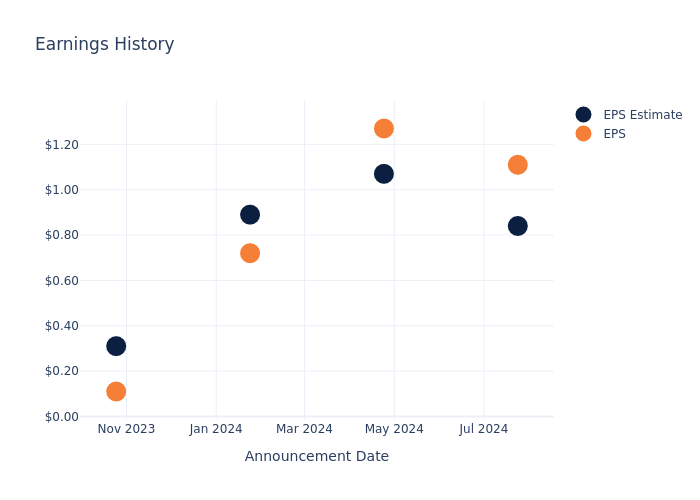
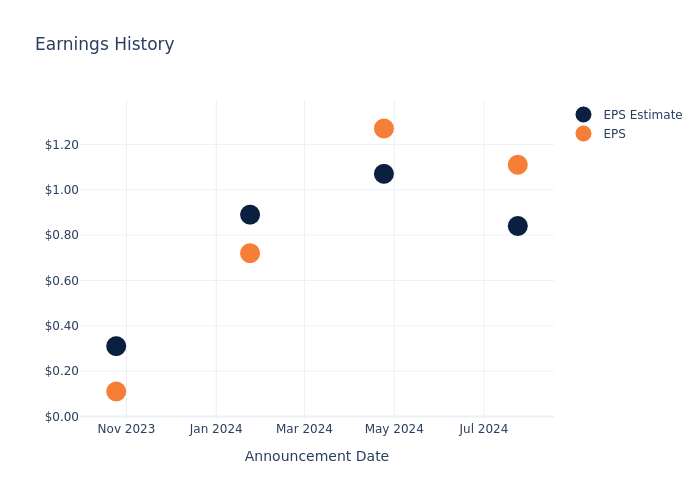
During the last quarter, the company reported an EPS beat by $0.27, leading to a 2.71% drop in the share price on the subsequent day.
Here’s a look at SLM’s past performance and the resulting price change:
| Quarter | Q2 2024 | Q1 2024 | Q4 2023 | Q3 2023 |
|---|---|---|---|---|
| EPS Estimate | 0.84 | 1.07 | 0.89 | 0.31 |
| EPS Actual | 1.11 | 1.27 | 0.72 | 0.11 |
| Price Change % | -3.0% | -1.0% | 3.0% | 1.0% |
Tracking SLM’s Stock Performance
Shares of SLM were trading at $22.95 as of October 21. Over the last 52-week period, shares are up 76.64%. Given that these returns are generally positive, long-term shareholders should be satisfied going into this earnings release.
Insights Shared by Analysts on SLM
For investors, grasping market sentiments and expectations in the industry is vital. This analysis explores the latest insights regarding SLM.
With 10 analyst ratings, SLM has a consensus rating of Outperform. The average one-year price target is $26.8, indicating a potential 16.78% upside.
Analyzing Analyst Ratings Among Peers
The below comparison of the analyst ratings and average 1-year price targets of and Enova International, three prominent players in the industry, gives insights for their relative performance expectations and market positioning.
- The consensus outlook from analysts is an Outperform trajectory for Enova International, with an average 1-year price target of $90.5, indicating a potential 294.34% upside.
Key Findings: Peer Analysis Summary
The peer analysis summary outlines pivotal metrics for and Enova International, demonstrating their respective standings within the industry and offering valuable insights into their market positions and comparative performance.
| Company | Consensus | Revenue Growth | Gross Profit | Return on Equity |
|---|---|---|---|---|
| Credit Acceptance | Sell | 12.42% | $330.70M | -2.94% |
| Enova International | Outperform | 25.83% | $299.24M | 4.69% |
Key Takeaway:
SLM ranks higher in Revenue Growth compared to its peers. However, it lags behind in Gross Profit and Return on Equity. Overall, SLM is positioned in the middle among its peers based on the provided metrics.
Unveiling the Story Behind SLM
SLM Corp is the largest student lender in the country. It makes and holds student loans through the guaranteed Federal Family Education Loan Program as well as through private channels. It also engages in debt-management operations, including accounts receivable and collections services, and runs college savings programs.
Financial Milestones: SLM’s Journey
Market Capitalization Analysis: The company exhibits a lower market capitalization profile, positioning itself below industry averages. This suggests a smaller scale relative to peers.
Revenue Challenges: SLM’s revenue growth over 3 months faced difficulties. As of 30 June, 2024, the company experienced a decline of approximately -3.15%. This indicates a decrease in top-line earnings. When compared to others in the Financials sector, the company faces challenges, achieving a growth rate lower than the average among peers.
Net Margin: SLM’s net margin surpasses industry standards, highlighting the company’s exceptional financial performance. With an impressive 48.13% net margin, the company effectively manages costs and achieves strong profitability.
Return on Equity (ROE): SLM’s ROE excels beyond industry benchmarks, reaching 12.7%. This signifies robust financial management and efficient use of shareholder equity capital.
Return on Assets (ROA): The company’s ROA is a standout performer, exceeding industry averages. With an impressive ROA of 0.87%, the company showcases effective utilization of assets.
Debt Management: SLM’s debt-to-equity ratio is notably higher than the industry average. With a ratio of 2.66, the company relies more heavily on borrowed funds, indicating a higher level of financial risk.
To track all earnings releases for SLM visit their earnings calendar on our site.
This article was generated by Benzinga’s automated content engine and reviewed by an editor.
Market News and Data brought to you by Benzinga APIs
© 2024 Benzinga.com. Benzinga does not provide investment advice. All rights reserved.
A Look Into Clorox Inc's Price Over Earnings
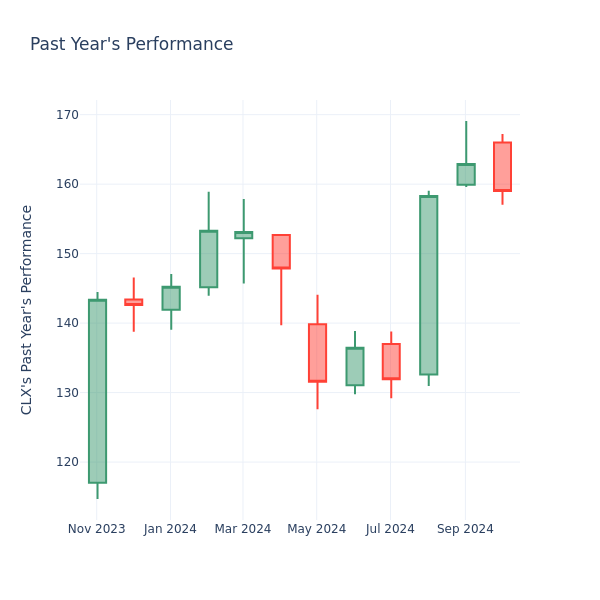
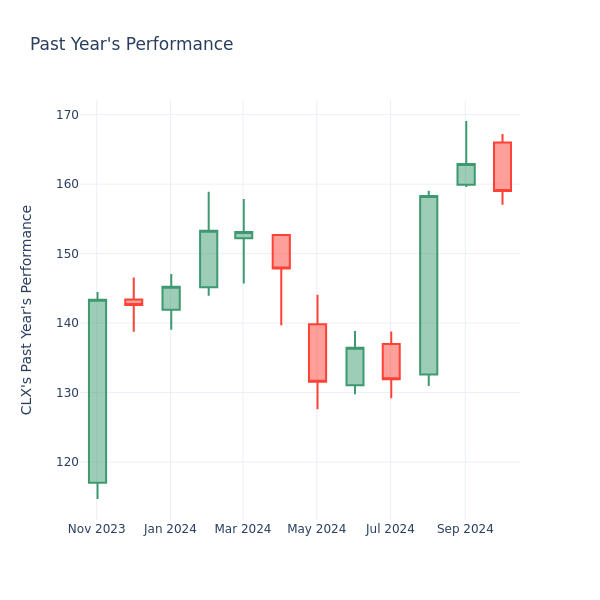
Looking into the current session, Clorox Inc. CLX shares are trading at $159.01, after a 0.86% decrease. Over the past month, the stock fell by 3.39%, but over the past year, it actually increased by 30.37%. With questionable short-term performance like this, and great long-term performance, long-term shareholders might want to start looking into the company’s price-to-earnings ratio.
How Does Clorox P/E Compare to Other Companies?
The P/E ratio is used by long-term shareholders to assess the company’s market performance against aggregate market data, historical earnings, and the industry at large. A lower P/E could indicate that shareholders do not expect the stock to perform better in the future or it could mean that the company is undervalued.
Clorox has a better P/E ratio of 71.28 than the aggregate P/E ratio of 43.32 of the Household Products industry. Ideally, one might believe that Clorox Inc. might perform better in the future than it’s industry group, but it’s probable that the stock is overvalued.
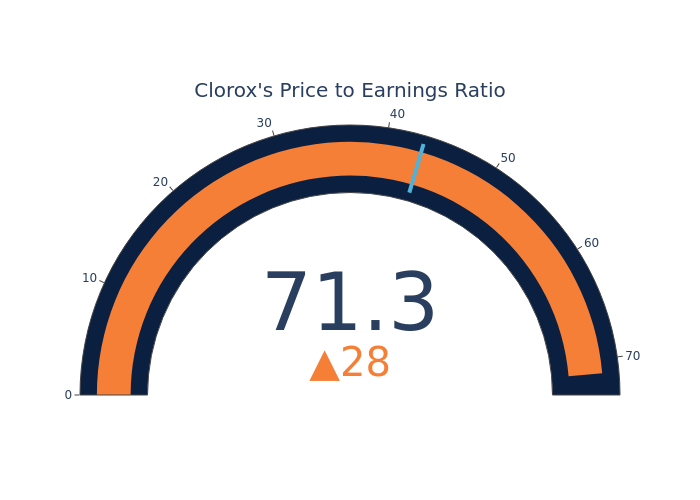
In conclusion, the price-to-earnings ratio is a useful metric for analyzing a company’s market performance, but it has its limitations. While a lower P/E can indicate that a company is undervalued, it can also suggest that shareholders do not expect future growth. Additionally, the P/E ratio should not be used in isolation, as other factors such as industry trends and business cycles can also impact a company’s stock price. Therefore, investors should use the P/E ratio in conjunction with other financial metrics and qualitative analysis to make informed investment decisions.
Market News and Data brought to you by Benzinga APIs
© 2024 Benzinga.com. Benzinga does not provide investment advice. All rights reserved.
John Anthony DiBella Expands Holdings With Simulations Plus Stock Options
A notable acquisition unfolded on October 21, as DiBella, Business Unit President at Simulations Plus SLP, reported the acquisition of stock options for 7,500 shares in an SEC filing.
What Happened: Revealed in a Form 4 filing on Monday with the U.S. Securities and Exchange Commission, DiBella, Business Unit President at Simulations Plus, strategically acquired stock options for 7,500 shares of SLP. These options empower DiBella to buy the company’s stock at a favorable exercise price of $33.29 per share.
The latest update on Tuesday morning shows Simulations Plus shares down by 0.82%, trading at $34.0. At this price, DiBella’s 7,500 shares are worth $5,325.
All You Need to Know About Simulations Plus
Simulations Plus Inc is engaged in the software industry. It develops and produces software for use in pharmaceutical research and education, and provides consulting and contract research services to the pharmaceutical industry. The company’s operating segments include Software and services. It generates maximum revenue from the software segment.
Financial Insights: Simulations Plus
Revenue Growth: Over the 3 months period, Simulations Plus showcased positive performance, achieving a revenue growth rate of 14.23% as of 31 May, 2024. This reflects a substantial increase in the company’s top-line earnings. As compared to competitors, the company surpassed expectations with a growth rate higher than the average among peers in the Health Care sector.
Exploring Profitability:
-
Gross Margin: With a low gross margin of 71.49%, the company exhibits below-average profitability, signaling potential struggles in cost efficiency compared to its industry peers.
-
Earnings per Share (EPS): Simulations Plus’s EPS is below the industry average, signaling challenges in bottom-line performance with a current EPS of 0.16.
Debt Management: With a below-average debt-to-equity ratio of 0.01, Simulations Plus adopts a prudent financial strategy, indicating a balanced approach to debt management.
Navigating Market Valuation:
-
Price to Earnings (P/E) Ratio: With a higher-than-average P/E ratio of 71.42, Simulations Plus’s stock is perceived as being overvalued in the market.
-
Price to Sales (P/S) Ratio: With a higher-than-average P/S ratio of 10.4, Simulations Plus’s stock is perceived as being overvalued in the market, particularly in relation to sales performance.
-
EV/EBITDA Analysis (Enterprise Value to its Earnings Before Interest, Taxes, Depreciation & Amortization): A high EV/EBITDA ratio of 39.26 reflects market recognition of Simulations Plus’s value, positioning it as more highly valued compared to industry peers.
Market Capitalization Analysis: Falling below industry benchmarks, the company’s market capitalization reflects a reduced size compared to peers. This positioning may be influenced by factors such as growth expectations or operational capacity.
Now trade stocks online commission free with Charles Schwab, a trusted and complete investment firm.
Unmasking the Significance of Insider Transactions
While insider transactions should not be the sole basis for making investment decisions, they can play a significant role in an investor’s decision-making process.
When discussing legal matters, the term “insider” refers to any officer, director, or beneficial owner holding more than ten percent of a company’s equity securities, as stipulated in Section 12 of the Securities Exchange Act of 1934. This includes executives in the c-suite and significant hedge funds. Such insiders are required to report their transactions through a Form 4 filing, which must be completed within two business days of the transaction.
A new purchase by a company insider is a indication that they anticipate the stock will rise.
On the other hand, insider sells may not necessarily indicate a bearish view and can be motivated by various factors.
Exploring Key Transaction Codes
When analyzing transactions, investors tend to focus on those in the open market, detailed in Table I of the Form 4 filing. A P in Box 3 denotes a purchase,while S signifies a sale. Transaction code C signals the conversion of an option, and transaction code A denotes a grant, award, or other acquisition of securities from the company.
Check Out The Full List Of Simulations Plus’s Insider Trades.
Insider Buying Alert: Profit from C-Suite Moves
Benzinga Edge reveals every insider trade in real-time. Don’t miss the next big stock move driven by insider confidence. Unlock this ultimate sentiment indicator now. Click here for access.
This article was generated by Benzinga’s automated content engine and reviewed by an editor.
Market News and Data brought to you by Benzinga APIs
© 2024 Benzinga.com. Benzinga does not provide investment advice. All rights reserved.
Stock market today: Dow, Nasdaq, S&P 500 slide as Treasury yields hit highest level since July
US stocks recovered from session lows but finished the day mixed as investors digested a recent bond market sell-off and the next wave of earnings reports.
The S&P 500 (^GSPC) and Dow Jones Industrial Average (^DJI) closed just below the flatline, while the tech-heavy Nasdaq Composite (^IXIC) ticked up around 0.2%. It was the first first back-to-back negative days for the S&P 500 since Sept. 6.
Stocks are treading carefully amid growing doubts that the Federal Reserve will continue to cut rates aggressively — or even hold steady in November. Strength in the economy, cautious Fedspeak, and concerns about the fiscal impact of an election win by Republican nominee Donald Trump are factors in play.
Read more: What the Fed rate cut means for bank accounts, CDs, loans, and credit cards
Amid the uncertainty, the 10-year Treasury yield (^TNX) steadied around 4.2% after Monday’s sharp gains helped push it above that level for the first time since July. The bond selling has weighed on rate-sensitive stocks such as real estate, with rising yields typically a catalyst for stock drawdowns.
On the earnings front, General Motors (GM) raised its guidance for the third time this year as upbeat EV sales helped deliver a quarterly profit and revenue beat. GM shares closed up more than 10%. Elsewhere in earnings, GE Aerospace (GE) sank over 8% and Verizon (VZ) shares fell around 5% on mixed third quarter reports.
At the same time, anticipation is building for earnings from Tesla (TSLA) on Wednesday as Wall Street debates whether the “Magnificent Seven” tech megacaps will lead stocks’ next leg higher.
Despite higher yields, gold (GC=F) prices rose, securing another record high. The gains came as investors sought safety with the US presidential election looming and Middle East tensions still on the rise.
LIVE 12 updatesRackspace Technology Strengthens Commitment to Global OpenStack Community with Board of Directors' Seat on OpenInfra Foundation
SAN ANTONIO, Oct. 22, 2024 (GLOBE NEWSWIRE) — Rackspace Technology® RXT, a leading hybrid, multicloud, and AI solutions company, today announced its enhanced commitment to the global OpenInfra Foundation by joining the OpenInfra Foundation Board of Directors and becoming an OpenStack community Platinum Member. This highest level of membership includes representation on the Board of Directors, the ability to influence the strategic direction of the OpenInfra Foundation community and the industry, access to open group forums and work groups, and the ability to fast-track standards.
Rackspace Technology partnered with NASA in 2010 to launch OpenStack, an open-source cloud software collaborative project, to power public and private clouds. Since then, OpenStack has grown to be one of the most active open-source projects, with enterprises all over the globe benefiting from a mature, scalable, and open cloud platform.
“As more organizations choose multicloud flexibility and hybrid infrastructure solutions to reclaim control of their infrastructure, OpenStack is experiencing record demand and accelerated adoption for companies to meet digital sovereignty and security requirements with cost-efficient cloud consumption,” said Lance Weaver, Chief Product and Technology Officer, Rackspace Private Cloud. “We look forward to expanding our contributions to the OpenInfra community through our continued commitment to OpenStack as a Platinum Member of the OpenInfra Foundation.”
OpenStack is differentiated by its ability to enable open-source, customized private clouds across on-premises and hosted infrastructure. As a mature infrastructure platform, OpenStack delivers the following advantages:
- Empowerment: provides the flexibility to build private cloud data centers or at the edge.
- Foundation: lays the foundation needed to deploy containers and orchestrators, like Kubernetes.
- Scalability: scale up or down quickly and easily to meet an organization’s needs.
- Flexibility: sync with a business’s growth and scale.
- Automation: built-in tools that make cloud management easier.
- Performance: runs on a wide range of hardware and integrates well with many different types of networking, storage, and other infrastructure.
- Development: open-source code allows experts from around the world to contribute to the platform’s development.
- Interoperability: works across a variety of platforms and software.
Given these factors, OpenStack is experiencing an enterprise cloud resurgence more than a decade after its debut due to expanding demands for data sovereignty, privacy, and cost control that are driving customers to explore alternatives to public cloud. Additionally, the introduction of custom AI models optimized for unique requirements is fueling interest in on-premises and hybrid hosting solutions.
“At the core of today’s data transformation is the need for agility. Organizations need a dynamic set of core services that provide the capabilities that empower essential platforms for modern applications, such as Kubernetes,” said Josh Villarreal, Rackspace Technology OpenStack GM. “Rackspace OpenStack solutions deliver the capability, scalability, and reliability of an enterprise-grade cloud platform at a fraction of the cost.”
How Industries are Leveraging OpenStack
- Retailers want to avoid using public cloud competitors to host proprietary systems.
- Pharmaceutical firms require keeping sensitive patient data private.
- Banks can use it to maintain strict data sovereignty regulations.
“Rackspace Technology partnered with NASA to originally launch OpenStack, so we are thrilled about Rackspace’s renewed commitment to OpenStack as a contributor and Platinum Member of the OpenInfra Foundation,” said Thierry Carrez, General Manager, OpenInfra Foundation. “Rackspace has accrued a lot of expertise at supporting OpenStack-based public and private cloud infrastructures, which they will be able to leverage as a key member of the OpenStack ecosystem.”
Click here for more information about Rackspace OpenStack.
About the Open Infrastructure Foundation
The OpenInfra Foundation builds communities who write open-source infrastructure software that runs in production. With the support of over 110,000 individuals in 187 countries, the OpenInfra Foundation hosts open-source projects and communities of practice, including infrastructure for AI, container native apps, edge computing and datacenter clouds. Join the OpenInfra movement: http://www.openinfra.dev
About Rackspace Technology
Rackspace Technology is a leading end-to-end, hybrid, multicloud, and AI solutions company. We can design, build, and operate our customers’ cloud environments across all major technology platforms, irrespective of technology stack or deployment model. We partner with our customers at every stage of their cloud journey, enabling them to modernize applications, build new products, and adopt innovative technologies.
Media Contact: Natalie Silva, publicrelations@rackspace.com

Market News and Data brought to you by Benzinga APIs
© 2024 Benzinga.com. Benzinga does not provide investment advice. All rights reserved.
FIBRA Prologis Declares Quarterly Distribution
MEXICO CITY, Oct. 21, 2024 /PRNewswire/ — FIBRA Prologis FIBRAPL, a leading owner and operator of Class-A industrial real estate in Mexico, declared today a cash distribution of Ps. 1,083.7 million (US$54.2 million), or Ps. 0.7051 per Certificado Bursátil Fiduciario Inmobiliario (“CBFI”) (US$ 0.0352 per CBFI).
The distribution is payable November 1, 2024, to CBFI holders.
Ex-dividend date of October 31, 2024.
Record date of October 31, 2024.
|
Legal Basis |
Concept |
Generated |
Payment Date |
Total Amount (Ps$) |
Number of CBFIs |
Ps$/CBFI |
|||
|
Article 187, section VI, ISR Law |
Fiscal Result Distributed in cash |
Sep-24 |
1-Nov-24 |
$ – |
– |
$ – |
|||
|
Fiscal Result Distributed in Certificates |
Sep-24 |
1-Nov-24 |
$ – |
– |
$ – |
||||
|
Total Distributed Fiscal Result (subject to withholding as applicable) |
$ – |
– |
|||||||
|
Article 188, section IX, ISR Law |
Capital reimbursement |
Sep-24 |
1-Nov-24 |
$ 1,083,701,071.49 |
1,537,049,366 |
$ 0.7051 |
|||
|
Total amount distributed (Fiscal Result + Capital Reimbursement) |
$ 1,083,701,071.49 |
1,537,049,366 |
$ 0.7051 |
||||||
ABOUT FIBRA PROLOGIS
FIBRA Prologis is a leading owner and operator of Class-A industrial real estate in Mexico. As of June 30, 2024, FIBRA Prologis was comprised of 236 logistics and manufacturing facilities in six industrial markets in Mexico totaling 46.9 million square feet (4.4 million square meters) of gross leasable area.
FORWARD-LOOKING STATEMENTS
The statements in this release that are not historical facts are forward-looking statements. These forward-looking statements are based on current expectations, estimates and projections about the industry and markets in which FIBRA Prologis operates, management’s beliefs and assumptions made by management. Such statements involve uncertainties that could significantly impact FIBRA Prologis financial results. Words such as “expects,” “anticipates,” “intends,” “plans,” “believes,” “seeks,” “estimates,” variations of such words and similar expressions are intended to identify such forward-looking statements, which generally are not historical in nature. All statements that address operating performance, events or developments that we expect or anticipate will occur in the future — including statements relating to rent and occupancy growth, acquisition activity, development activity, disposition activity, general conditions in the geographic areas where we operate, our debt and financial position, are forward-looking statements. These statements are not guarantees of future performance and involve certain risks, uncertainties and assumptions that are difficult to predict. Although we believe the expectations reflected in any forward-looking statements are based on reasonable assumptions, we can give no assurance that our expectations will be attained and therefore, actual outcomes and results may differ materially from what is expressed or forecasted in such forward-looking statements. Some of the factors that may affect outcomes and results include, but are not limited to: (i) national, international, regional and local economic climates, (ii) changes in financial markets, interest rates and foreign currency exchange rates, (iii) increased or unanticipated competition for our properties, (iv) risks associated with acquisitions, dispositions and development of properties, (v) maintenance of real estate investment trust (“FIBRA”) status and tax structuring, (vi) availability of financing and capital, the levels of debt that we maintain and our credit ratings, (vii) risks related to our investments (viii) environmental uncertainties, including risks of natural disasters, (ix) risks related to the coronavirus pandemic, and (x) those additional factors discussed in reports filed with the “Comisión Nacional Bancaria y de Valores” and the Mexican Stock Exchange by FIBRA Prologis under the heading “Risk Factors.” FIBRA Prologis undertakes no duty to update any forward-looking statements appearing in this release.
Non-Solicitation – Any securities discussed herein or in the accompanying presentations, if any, have not been registered under the Securities Act of 1933 or the securities laws of any state and may not be offered or sold in the United States absent registration or an applicable exemption from the registration requirements under the Securities Act and any applicable state securities laws. Any such announcement does not constitute an offer to sell or the solicitation of an offer to buy the securities discussed herein or in the presentations, if and as applicable.
![]() View original content to download multimedia:https://www.prnewswire.com/news-releases/fibra-prologis-declares-quarterly-distribution-302282304.html
View original content to download multimedia:https://www.prnewswire.com/news-releases/fibra-prologis-declares-quarterly-distribution-302282304.html
SOURCE FIBRA Prologis
Market News and Data brought to you by Benzinga APIs
© 2024 Benzinga.com. Benzinga does not provide investment advice. All rights reserved.
Sell Alert: Glenn Pushis Cashes Out $2.39M In Steel Dynamics Stock
Glenn Pushis, Senior Vice President at Steel Dynamics STLD, reported an insider sell on October 21, according to a new SEC filing.
What Happened: Pushis’s recent Form 4 filing with the U.S. Securities and Exchange Commission on Monday unveiled the sale of 17,941 shares of Steel Dynamics. The total transaction value is $2,387,825.
Monitoring the market, Steel Dynamics‘s shares down by 2.62% at $129.95 during Tuesday’s morning.
Get to Know Steel Dynamics Better
Steel Dynamics Inc operates scrap-based steel minimills with roughly 16 million tons of annual steel production capacity. The company’s segment includes steel operations, metals recycling operations, steel fabrication operations, Aluminum Operations Segment, and others. It generates maximum revenue from the steel operations segment.
Steel Dynamics: Delving into Financials
Decline in Revenue: Over the 3 months period, Steel Dynamics faced challenges, resulting in a decline of approximately -6.28% in revenue growth as of 30 September, 2024. This signifies a reduction in the company’s top-line earnings. When compared to others in the Materials sector, the company faces challenges, achieving a growth rate lower than the average among peers.
Evaluating Earnings Performance:
-
Gross Margin: With a low gross margin of 13.94%, the company exhibits below-average profitability, signaling potential struggles in cost efficiency compared to its industry peers.
-
Earnings per Share (EPS): Steel Dynamics’s EPS is below the industry average, signaling challenges in bottom-line performance with a current EPS of 2.06.
Debt Management: With a high debt-to-equity ratio of 0.41, Steel Dynamics faces challenges in effectively managing its debt levels, indicating potential financial strain.
Assessing Valuation Metrics:
-
Price to Earnings (P/E) Ratio: The current P/E ratio of 12.0 is below industry norms, indicating potential undervaluation and presenting an investment opportunity.
-
Price to Sales (P/S) Ratio: With a higher-than-average P/S ratio of 1.18, Steel Dynamics’s stock is perceived as being overvalued in the market, particularly in relation to sales performance.
-
EV/EBITDA Analysis (Enterprise Value to its Earnings Before Interest, Taxes, Depreciation & Amortization): A high EV/EBITDA ratio of 8.07 positions the company as being more valued compared to industry benchmarks.
Market Capitalization: Surpassing industry standards, the company’s market capitalization asserts its dominance in terms of size, suggesting a robust market position.
Now trade stocks online commission free with Charles Schwab, a trusted and complete investment firm.
Illuminating the Importance of Insider Transactions
Insider transactions are not the sole determinant of investment choices, but they are a factor worth considering.
Exploring the legal landscape, an “insider” is defined as any officer, director, or beneficial owner holding more than ten percent of a company’s equity securities, as stipulated by Section 12 of the Securities Exchange Act of 1934. This encompasses executives in the c-suite and major hedge funds. These insiders are required to report their transactions through a Form 4 filing, which must be submitted within two business days of the transaction.
Highlighted by a company insider’s new purchase, there’s a positive anticipation for the stock to rise.
But, insider sells may not necessarily indicate a bearish view and can be motivated by various factors.
Unlocking the Meaning of Transaction Codes
Delving into transactions, investors typically prioritize those unfolding in the open market, as precisely outlined in Table I of the Form 4 filing. A P in Box 3 indicates a purchase, while S signifies a sale. Transaction code C signals the conversion of an option, and transaction code A denotes a grant, award, or other acquisition of securities from the company.
Check Out The Full List Of Steel Dynamics’s Insider Trades.
Insider Buying Alert: Profit from C-Suite Moves
Benzinga Edge reveals every insider trade in real-time. Don’t miss the next big stock move driven by insider confidence. Unlock this ultimate sentiment indicator now. Click here for access.
This article was generated by Benzinga’s automated content engine and reviewed by an editor.
Market News and Data brought to you by Benzinga APIs
© 2024 Benzinga.com. Benzinga does not provide investment advice. All rights reserved.
Insider Unloading: Robert G Brown Sells $396K Worth Of SPAR Group Shares
It was reported on October 21, that Robert G Brown, 10% Owner at SPAR Group SGRP executed a significant insider sell, according to an SEC filing.
What Happened: Brown opted to sell 165,153 shares of SPAR Group, according to a Form 4 filing with the U.S. Securities and Exchange Commission on Monday. The transaction’s total worth stands at $396,421.
Monitoring the market, SPAR Group‘s shares down by 0.01% at $2.41 during Tuesday’s morning.
Unveiling the Story Behind SPAR Group
SPAR Group Inc is a supplier of merchandising and other marketing services. It also provides range of services to retailers, consumer goods manufacturers and distributors around the globe. The company divides its operations into three reportable regional segments: Americas, which is comprised of United States, Canada, Brazil and Mexico; Asia-Pacific (APAC), which is comprised of Japan, China, and India; and Europe, Middle East and Africa (EMEA), which is comprised of South Africa. It generates maximum revenue from Americas.
A Deep Dive into SPAR Group’s Financials
Revenue Challenges: SPAR Group’s revenue growth over 3 months faced difficulties. As of 30 June, 2024, the company experienced a decline of approximately -13.11%. This indicates a decrease in top-line earnings. When compared to others in the Communication Services sector, the company faces challenges, achieving a growth rate lower than the average among peers.
Holistic Profitability Examination:
-
Gross Margin: The company shows a low gross margin of 19.19%, indicating concerns regarding cost management and overall profitability relative to its industry counterparts.
-
Earnings per Share (EPS): The company excels with an EPS that surpasses the industry average. With a current EPS of 0.15, SPAR Group showcases strong earnings per share.
Debt Management: The company faces challenges in debt management with a debt-to-equity ratio higher than the industry average. With a ratio of 0.73, caution is advised due to increased financial risk.
Valuation Metrics:
-
Price to Earnings (P/E) Ratio: SPAR Group’s P/E ratio of 4.55 is below the industry average, suggesting the stock may be undervalued.
-
Price to Sales (P/S) Ratio: The current P/S ratio of 0.23 is below industry norms, suggesting potential undervaluation and presenting an investment opportunity for those considering sales performance.
-
EV/EBITDA Analysis (Enterprise Value to its Earnings Before Interest, Taxes, Depreciation & Amortization): At 2.51, SPAR Group’s EV/EBITDA ratio reflects a below-par valuation compared to industry averages signalling undervaluation
Market Capitalization Analysis: The company’s market capitalization is below the industry average, suggesting that it is relatively smaller compared to peers. This could be due to various factors, including perceived growth potential or operational scale.
Now trade stocks online commission free with Charles Schwab, a trusted and complete investment firm.
Uncovering the Importance of Insider Activity
Insider transactions are not the sole determinant of investment choices, but they are a factor worth considering.
In the context of legal matters, the term “insider” refers to any officer, director, or beneficial owner holding more than ten percent of a company’s equity securities, as outlined by Section 12 of the Securities Exchange Act of 1934. This includes executives in the c-suite and significant hedge funds. Such insiders are obligated to report their transactions through a Form 4 filing, which must be completed within two business days of the transaction.
Pointing towards optimism, a company insider’s new purchase signals their positive anticipation for the stock to rise.
Despite insider sells not always signaling a bearish sentiment, they can be driven by various factors.
Important Transaction Codes
When it comes to transactions, investors tend to focus on those in the open market, detailed in Table I of the Form 4 filing. A P in Box 3 denotes a purchase, while S indicates a sale. Transaction code C signals the conversion of an option, and transaction code A denotes a grant, award, or other acquisition of securities from the company.
Check Out The Full List Of SPAR Group’s Insider Trades.
Insider Buying Alert: Profit from C-Suite Moves
Benzinga Edge reveals every insider trade in real-time. Don’t miss the next big stock move driven by insider confidence. Unlock this ultimate sentiment indicator now. Click here for access.
This article was generated by Benzinga’s automated content engine and reviewed by an editor.
Market News and Data brought to you by Benzinga APIs
© 2024 Benzinga.com. Benzinga does not provide investment advice. All rights reserved.

