A Peek at Ally Financial's Future Earnings
Ally Financial ALLY will release its quarterly earnings report on Friday, 2024-10-18. Here’s a brief overview for investors ahead of the announcement.
Analysts anticipate Ally Financial to report an earnings per share (EPS) of $0.53.
Anticipation surrounds Ally Financial’s announcement, with investors hoping to hear about both surpassing estimates and receiving positive guidance for the next quarter.
New investors should understand that while earnings performance is important, market reactions are often driven by guidance.
Earnings Track Record
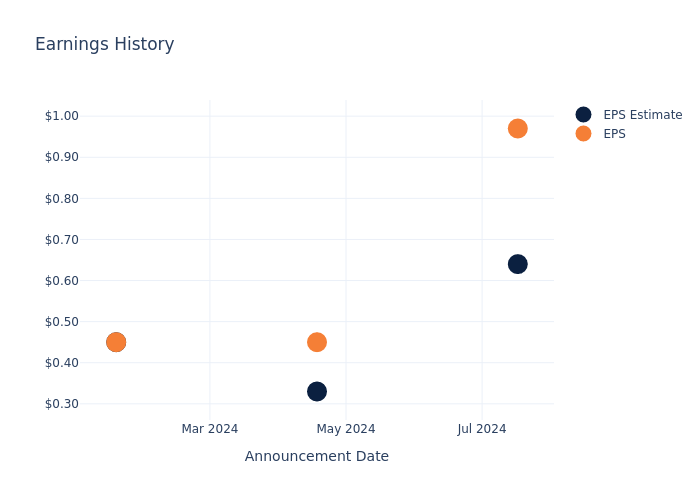
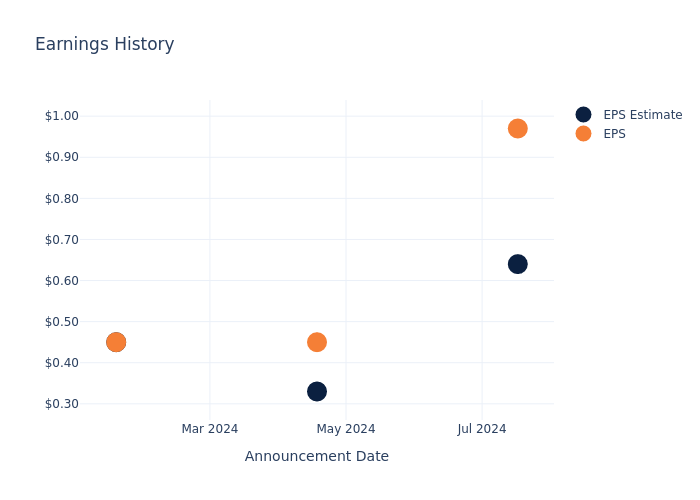
The company’s EPS beat by $0.33 in the last quarter, leading to a 2.28% drop in the share price on the following day.
Here’s a look at Ally Financial’s past performance and the resulting price change:
| Quarter | Q2 2024 | Q1 2024 | Q4 2023 | Q3 2023 |
|---|---|---|---|---|
| EPS Estimate | 0.64 | 0.33 | 0.45 | 0.80 |
| EPS Actual | 0.97 | 0.45 | 0.45 | 0.83 |
| Price Change % | -2.0% | 1.0% | 11.0% | -4.0% |
Tracking Ally Financial’s Stock Performance
Shares of Ally Financial were trading at $35.94 as of October 16. Over the last 52-week period, shares are up 49.65%. Given that these returns are generally positive, long-term shareholders are likely bullish going into this earnings release.
Analyst Opinions on Ally Financial
For investors, staying informed about market sentiments and expectations in the industry is paramount. This analysis provides an exploration of the latest insights on Ally Financial.
The consensus rating for Ally Financial is Outperform, based on 9 analyst ratings. With an average one-year price target of $38.78, there’s a potential 7.9% upside.
Peer Ratings Comparison
The analysis below examines the analyst ratings and average 1-year price targets of and Enova International, three significant industry players, providing valuable insights into their relative performance expectations and market positioning.
- The consensus among analysts is an Outperform trajectory for Enova International, with an average 1-year price target of $90.5, indicating a potential 151.81% upside.
Snapshot: Peer Analysis
The peer analysis summary offers a detailed examination of key metrics for and Enova International, providing valuable insights into their respective standings within the industry and their market positions and comparative performance.
| Company | Consensus | Revenue Growth | Gross Profit | Return on Equity |
|---|---|---|---|---|
| Credit Acceptance | Sell | 12.42% | $330.70M | -2.94% |
| Enova International | Outperform | 25.83% | $299.24M | 4.69% |
Key Takeaway:
Ally Financial ranks higher than its peers in Revenue Growth and Gross Profit, indicating stronger performance in these areas. However, it lags behind in Consensus and Return on Equity metrics compared to its peers.
Delving into Ally Financial’s Background
Formerly the captive financial arm of General Motors, Ally Financial became an independent publicly traded firm in 2014 and is one of the largest consumer auto lenders in the country. While the firm has expanded its product offerings over time, it remains primarily focused on auto lending with more than 70% of its loan book in consumer auto loans and dealer financing. Ally also offers auto insurance, commercial loans, credit cards, and holds a portfolio of mortgage debt, giving the bank a diversified business model, which includes brokerage services.
Financial Insights: Ally Financial
Market Capitalization Analysis: Reflecting a smaller scale, the company’s market capitalization is positioned below industry averages. This could be attributed to factors such as growth expectations or operational capacity.
Decline in Revenue: Over the 3 months period, Ally Financial faced challenges, resulting in a decline of approximately -4.37% in revenue growth as of 30 June, 2024. This signifies a reduction in the company’s top-line earnings. When compared to others in the Financials sector, the company faces challenges, achieving a growth rate lower than the average among peers.
Net Margin: Ally Financial’s net margin is impressive, surpassing industry averages. With a net margin of 12.29%, the company demonstrates strong profitability and effective cost management.
Return on Equity (ROE): Ally Financial’s ROE falls below industry averages, indicating challenges in efficiently using equity capital. With an ROE of 2.33%, the company may face hurdles in generating optimal returns for shareholders.
Return on Assets (ROA): Ally Financial’s ROA lags behind industry averages, suggesting challenges in maximizing returns from its assets. With an ROA of 0.14%, the company may face hurdles in achieving optimal financial performance.
Debt Management: Ally Financial’s debt-to-equity ratio is below the industry average. With a ratio of 1.53, the company relies less on debt financing, maintaining a healthier balance between debt and equity, which can be viewed positively by investors.
To track all earnings releases for Ally Financial visit their earnings calendar on our site.
This article was generated by Benzinga’s automated content engine and reviewed by an editor.
© 2024 Benzinga.com. Benzinga does not provide investment advice. All rights reserved.
Fragrance Solubilizers Market is Projected to Expand at a CAGR of 5.5%, Reaching US$ 4,061.7 Million by 2034 | Fact.MR Report
Rockville, MD , Oct. 17, 2024 (GLOBE NEWSWIRE) — The Fragrance Solubilizers Market is expected to grow from US$ 2,377.8 million in 2024 to US$ 4,061.7 million in 2034. Fact. MR’s extensive study shows that the market will expand at a growth rate of 5.5% from 2024 to 2034.
Fragrance solubilizers are frequently used in personal care, cosmetics, and home care products because they easily integrate hydrophobic (oil-based) perfumes into water-based compositions. Fragrance solubilizers are the ingredients that help ensure that fragrances are evenly distributed throughout aqueous solutions, ensuring the final product’s stability and consistency as well as the scent’s extended delivery. Their main function is to improve product performance by solubilizing oils, essential oils, or aroma compounds in water-based systems without encouraging phase separation.
Thus, the market for fragrance solubilizers is expanding due to consumer demand for personal care and cosmetic perfumes, body sprays, shampoos, lotions, and household cleaning products. The need for high-quality, long-lasting, and scented products, together with growing awareness of wellness, cleanliness, and grooming, have further propelled market expansion. Additionally, producers have been prompted to create green solubilizers in accordance with environmental requirements by current consumer preferences around being natural, organic, and environmentally friendly.
For More Insights into the Market, Request a Sample of this Report: https://www.factmr.com/connectus/sample?flag=S&rep_id=8088

Key Takeaways from Market Study:
- Global fragrance solubilizers market will grow at a CAGR of 5.5%, reaching US$ 4,061.7 million by the end of 2034.
- North America will expand at a CAGR of 5.4% from 2024 to 2034, capturing 31.2% of the market share in 2024 and offering an absolute opportunity of US$ 517.2 million.
- Western Europe will account for 24.2% of market share in 2024, generating an absolute dollar opportunity of US$ 391.2 million between 2024 and 2034.
- Between 2024 and 2034, by composition the natural fragrance solubilizers are expected to produce an absolute dollar opportunity US$ 977.1 million.
- With a 6% market share, by type segment, non-ionic solubilizers are estimated to be worth US$ 1,631.2 million in 2024.
“Rising Regulatory Pressure for the Development of Sustainable Products and Increasing Spending on Personal Care, have contributed to the growth of the Fragrance solubilizers Market” says a Fact.MR analyst.
Leading Players Driving Innovation in the Fragrance Solubilizers Market:
BASF SE; Clariant AG; DAITO KASEI KOGYO; Evonik Industries AG; Kao Chemical Company; Croda International Plc; Ashland Global Holdings Inc.; Gattefossé; Stepan Company; Innospec Inc.; SEPPIC (Air Liquide); Roquette Frères; Ross Organic; Sensient Technologies; SOCRI S.p.A; Symrise; Others.
Market Development:
The companies are focusing on biodegradable and nature-friendly product development, improving performance in various formulations, and product portfolios to cater to emerging consumer trends. The company is also increasing its innovation efforts in areas such as biodegradable solubilizers and natural ingredients while continuing to ensure regulatory standards.
As an instance:
In June 2023, Dow launched bio-based solubilizers ‘propylene glycol’ to enhance sustainability of fragrance ingredients in cosmetics industry.
In August 2022, Givaudan invested heavily in research and development to develop eco-friendly and biodegradable products including natural solubilizers.
Fragrance Solubilizers Industry News:
- In November 2020, Symrise AG signed an agreement with Sensient Technologies to expand its business in fragrance and aroma chemical activities to strengthen its market position.
- In November 2021, SOCRI S.p.A launched an innovative alternative to chemical-based solubilizers named POLYSOL® PGA. This product is well-suited for the dispersion of essential oils.
Get Customization on this Report for Specific Research Solutions: https://www.factmr.com/connectus/sample?flag=S&rep_id=8088
More Valuable Insights on Offer:
Fact.MR, in its new offering, presents an unbiased analysis of the global Fragrance solubilizers market, presenting historical data for 2019 to 2023 and forecast statistics for 2024 to 2034.
The study reveals essential insights based on Composition (Natural and Synthetic), Type (Non-ionic Solubilizers, Anionic Solubilizers, Cationic Solubilizers, and Amphoteric Solubilizers), Application (Personal Care Formulations, Cosmetic Formulations, Pharmaceutical Formulations, Food Supplements, and Others), Application Method (Spray Formulations, Emulsion-based Formulations, Liquid Formulations, and Solid Formulations), End-Use Industry (Personal Care and Cosmetics Industry; Home Care Industry; Industrial Applications; and Others) across major seven regions of the world (North America, Latin America, Western Europe, Eastern Europe, East Asia, South Asia & Pacific, and the Middle East & Africa).
Segmentation of Fragrance Solubilizers Market:
- By Composition :
- By Type :
- Non-ionic Solubilizers
- Anionic Solubilizers
- Cationic Solubilizers
- Amphoteric Solubilizers
- By Application :
- Personal Care Formulations
- Bath & Shower
- Face Care
- Hair Care
- Skin Care
- Others
- Cosmetic Formulations
- Pharmaceutical Formulations
- Food Supplements
- Flavoring Agents
- Food Additives
- Others
- Personal Care Formulations
- By Application Method :
- Spray Formulations
- Emulsion-based Formulations
- Liquid Formulations
- Solid Formulations
- By End-Use Industry :
- Personal Care and Cosmetics Industry
- Home Care Industry
- Industrial Applications
- Others
Checkout More Related Studies Published by Fact.MR Research:
The global carbon Neutral Silicones market is projected value at US$ 294.3 million in 2024 and expand at a CAGR of 4.7% to end up at US$ 465.8 million by 2034.
The global fragrance solubilizers market is projected value at US$ 2,377.8 million in 2024 and expand at a CAGR of 5.5% to end up at US$ 4,061.7 million by 2034.
The Global cellulose nanofibrils market was valued at US$ 242.7 million in 2023 and has been forecast to expand at a noteworthy CAGR of 9.2% to end up at US$ 638.9 million by 2034.
As stated in the recently updated report by Fact.MR, the global aerosol insecticides market is estimated to reach a worth of US$ 90.26 billion in 2024 and is slated to expand at a CAGR of 5.1% to reach US$ 148.51 billion by 2034.
The global chemical feed system market is estimated to reach a valuation of US$ 579.6 million in 2024 and further expand at a CAGR of 6% to end up at US$ 1.04 billion by the year 2034.
About Us:
Fact.MR is a distinguished market research company renowned for its comprehensive market reports and invaluable business insights. As a prominent player in business intelligence, we deliver deep analysis, uncovering market trends, growth paths, and competitive landscapes. Renowned for its commitment to accuracy and reliability, we empower businesses with crucial data and strategic recommendations, facilitating informed decision-making and enhancing market positioning.
With its unwavering dedication to providing reliable market intelligence, FACT.MR continues to assist companies in navigating dynamic market challenges with confidence and achieving long-term success. With a global presence and a team of experienced analysts, FACT.MR ensures its clients receive actionable insights to capitalize on emerging opportunities and stay ahead in the competitive landscape.
Contact:
US Sales Office:
11140 Rockville Pike
Suite 400
Rockville, MD 20852
United States
Tel: +1 (628) 251-1583
Sales Team: sales@factmr.com
Follow Us: LinkedIn | Twitter | Blog

© 2024 Benzinga.com. Benzinga does not provide investment advice. All rights reserved.
Unpacking the Latest Options Trading Trends in Rivian Automotive
Investors with significant funds have taken a bearish position in Rivian Automotive RIVN, a development that retail traders should be aware of.
This was brought to our attention today through our monitoring of publicly accessible options data at Benzinga. The exact nature of these investors remains a mystery, but such a major move in RIVN usually indicates foreknowledge of upcoming events.
Today, Benzinga’s options scanner identified 10 options transactions for Rivian Automotive. This is an unusual occurrence. The sentiment among these large-scale traders is mixed, with 20% being bullish and 70% bearish. Of all the options we discovered, 9 are puts, valued at $399,432, and there was a single call, worth $162,000.
What’s The Price Target?
Based on the trading activity, it appears that the significant investors are aiming for a price territory stretching from $9.0 to $22.5 for Rivian Automotive over the recent three months.
Volume & Open Interest Trends
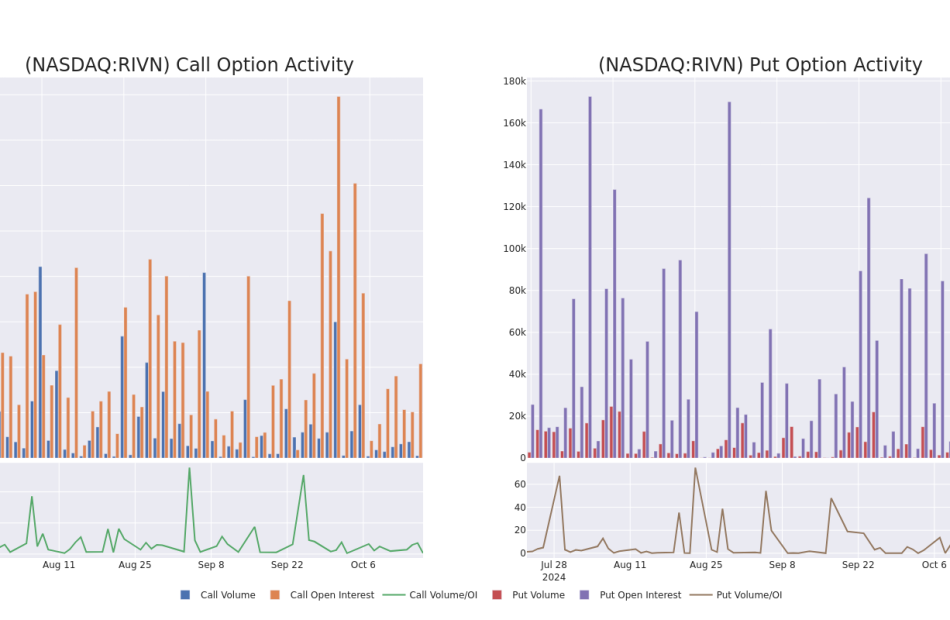
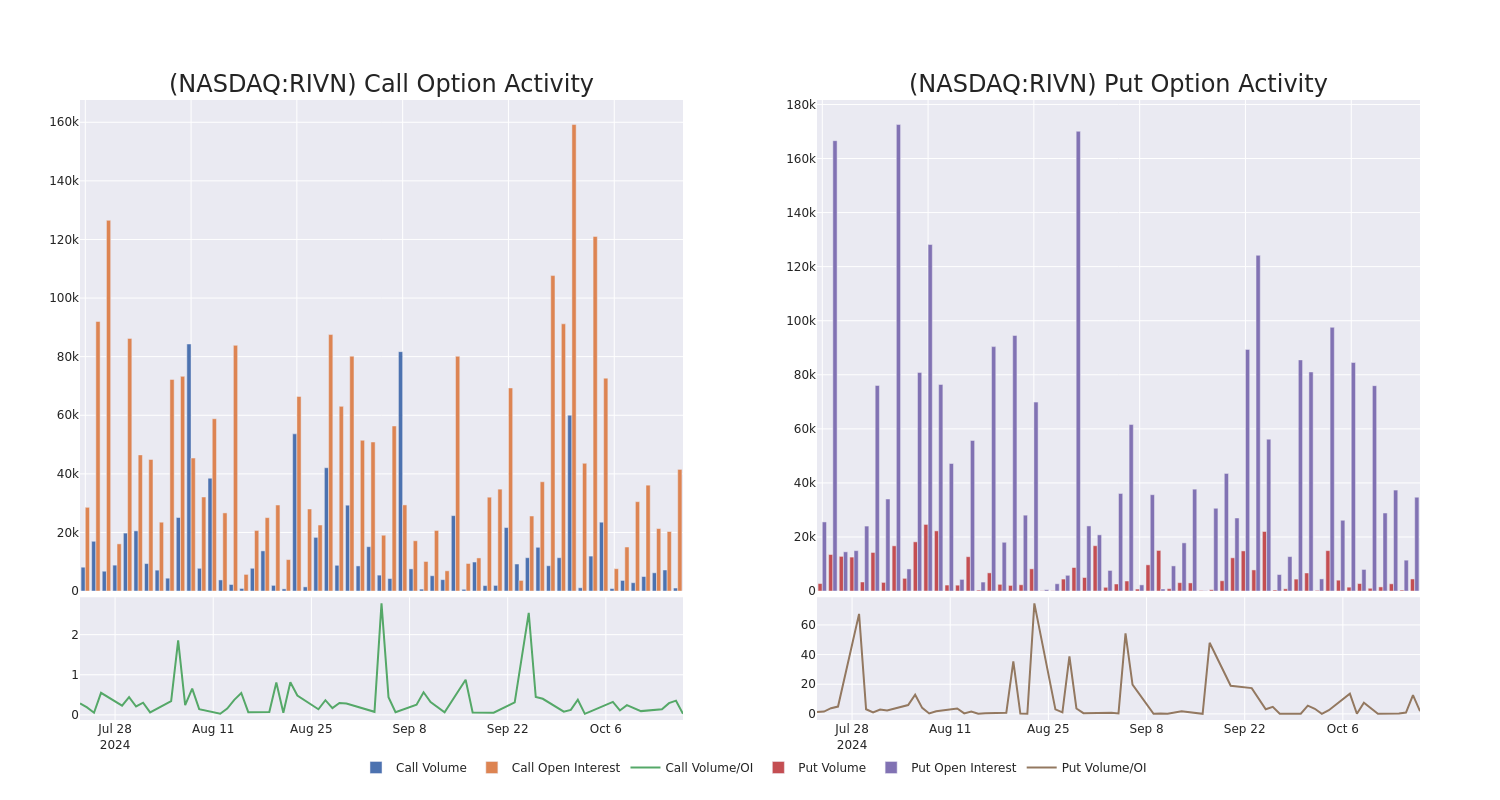
In today’s trading context, the average open interest for options of Rivian Automotive stands at 10888.86, with a total volume reaching 5,495.00. The accompanying chart delineates the progression of both call and put option volume and open interest for high-value trades in Rivian Automotive, situated within the strike price corridor from $9.0 to $22.5, throughout the last 30 days.
Rivian Automotive Option Volume And Open Interest Over Last 30 Days
Noteworthy Options Activity:
| Symbol | PUT/CALL | Trade Type | Sentiment | Exp. Date | Ask | Bid | Price | Strike Price | Total Trade Price | Open Interest | Volume |
|---|---|---|---|---|---|---|---|---|---|---|---|
| RIVN | CALL | SWEEP | BEARISH | 01/17/25 | $1.64 | $1.62 | $1.62 | $10.00 | $162.0K | 41.5K | 1.0K |
| RIVN | PUT | SWEEP | BEARISH | 10/18/24 | $1.86 | $1.71 | $1.86 | $12.00 | $74.1K | 1.5K | 1 |
| RIVN | PUT | SWEEP | BEARISH | 11/15/24 | $0.55 | $0.54 | $0.55 | $9.00 | $72.0K | 5.0K | 1.5K |
| RIVN | PUT | SWEEP | BULLISH | 12/20/24 | $1.32 | $1.31 | $1.31 | $10.00 | $57.9K | 20.3K | 771 |
| RIVN | PUT | SWEEP | BEARISH | 10/18/24 | $1.9 | $1.89 | $1.9 | $12.00 | $38.0K | 1.5K | 1.0K |
About Rivian Automotive
Rivian Automotive Inc designs, develops, and manufactures category-defining electric vehicles and accessories. In the consumer market, the company launched the R1 platform with the first generation of consumer vehicles: the R1T, a two-row, five-passenger pickup truck, and the R1S, a three-row, seven-passenger sport utility vehicle (SUV).
After a thorough review of the options trading surrounding Rivian Automotive, we move to examine the company in more detail. This includes an assessment of its current market status and performance.
Present Market Standing of Rivian Automotive
- With a volume of 16,578,088, the price of RIVN is down -2.12% at $10.02.
- RSI indicators hint that the underlying stock may be oversold.
- Next earnings are expected to be released in 21 days.
Professional Analyst Ratings for Rivian Automotive
A total of 5 professional analysts have given their take on this stock in the last 30 days, setting an average price target of $14.6.
Turn $1000 into $1270 in just 20 days?
20-year pro options trader reveals his one-line chart technique that shows when to buy and sell. Copy his trades, which have had averaged a 27% profit every 20 days. Click here for access.
* An analyst from Wells Fargo has decided to maintain their Equal-Weight rating on Rivian Automotive, which currently sits at a price target of $11.
* An analyst from Goldman Sachs persists with their Neutral rating on Rivian Automotive, maintaining a target price of $11.
* An analyst from Cantor Fitzgerald downgraded its action to Overweight with a price target of $19.
* An analyst from Morgan Stanley downgraded its action to Equal-Weight with a price target of $13.
* An analyst from Cantor Fitzgerald downgraded its action to Overweight with a price target of $19.
Options are a riskier asset compared to just trading the stock, but they have higher profit potential. Serious options traders manage this risk by educating themselves daily, scaling in and out of trades, following more than one indicator, and following the markets closely.
If you want to stay updated on the latest options trades for Rivian Automotive, Benzinga Pro gives you real-time options trades alerts.
Market News and Data brought to you by Benzinga APIs
© 2024 Benzinga.com. Benzinga does not provide investment advice. All rights reserved.
A Look at SLB's Upcoming Earnings Report
SLB SLB is preparing to release its quarterly earnings on Friday, 2024-10-18. Here’s a brief overview of what investors should keep in mind before the announcement.
Analysts expect SLB to report an earnings per share (EPS) of $0.88.
The announcement from SLB is eagerly anticipated, with investors seeking news of surpassing estimates and favorable guidance for the next quarter.
It’s worth noting for new investors that guidance can be a key determinant of stock price movements.
Performance in Previous Earnings
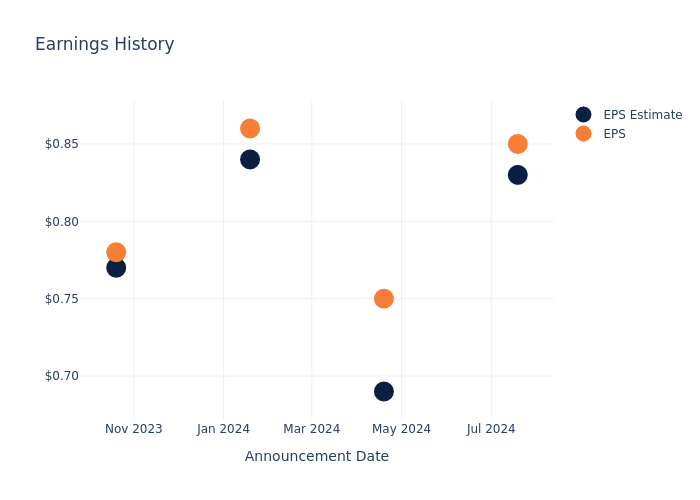
The company’s EPS beat by $0.02 in the last quarter, leading to a 0.0% drop in the share price on the following day.
Here’s a look at SLB’s past performance and the resulting price change:
| Quarter | Q2 2024 | Q1 2024 | Q4 2023 | Q3 2023 |
|---|---|---|---|---|
| EPS Estimate | 0.83 | 0.69 | 0.84 | 0.77 |
| EPS Actual | 0.85 | 0.75 | 0.86 | 0.78 |
| Price Change % | 2.0% | -2.0% | 2.0% | -3.0% |

Analysts’ Perspectives on SLB
Understanding market sentiments and expectations within the industry is crucial for investors. This analysis delves into the latest insights on SLB.
The consensus rating for SLB is Outperform, derived from 17 analyst ratings. An average one-year price target of $62.44 implies a potential 42.95% upside.
Peer Ratings Overview
In this comparison, we explore the analyst ratings and average 1-year price targets of Baker Hughes, Halliburton and TechnipFMC, three prominent industry players, offering insights into their relative performance expectations and market positioning.
- Baker Hughes received a Outperform consensus from analysts, with an average 1-year price target of $43.42, implying a potential 0.6% downside.
- Analysts currently favor an Buy trajectory for Halliburton, with an average 1-year price target of $42.17, suggesting a potential 3.46% downside.
- Analysts currently favor an Buy trajectory for TechnipFMC, with an average 1-year price target of $33.0, suggesting a potential 24.45% downside.
Snapshot: Peer Analysis
In the peer analysis summary, key metrics for Baker Hughes, Halliburton and TechnipFMC are highlighted, providing an understanding of their respective standings within the industry and offering insights into their market positions and comparative performance.
| Company | Consensus | Revenue Growth | Gross Profit | Return on Equity |
|---|---|---|---|---|
| Schlumberger | Outperform | 12.84% | $1.88B | 5.32% |
| Baker Hughes | Outperform | 13.05% | $1.49B | 3.74% |
| Halliburton | Buy | 0.60% | $1.12B | 7.22% |
| TechnipFMC | Buy | 17.92% | $500.90M | 6.24% |
Key Takeaway:
SLB ranks highest in Gross Profit and Return on Equity among its peers. It is in the middle for Revenue Growth.
Unveiling the Story Behind SLB
SLB is the largest oilfield service firm in the world, with expertise in myriad disciplines, including reservoir performance, well construction, production enhancement, and more recently, digital solutions. It maintains a reputation as one of the industry’s leading innovators, which has earned it dominant share in numerous end markets.
SLB: Delving into Financials
Market Capitalization Highlights: Above the industry average, the company’s market capitalization signifies a significant scale, indicating strong confidence and market prominence.
Positive Revenue Trend: Examining SLB’s financials over 3 months reveals a positive narrative. The company achieved a noteworthy revenue growth rate of 12.84% as of 30 June, 2024, showcasing a substantial increase in top-line earnings. In comparison to its industry peers, the company stands out with a growth rate higher than the average among peers in the Energy sector.
Net Margin: SLB’s financial strength is reflected in its exceptional net margin, which exceeds industry averages. With a remarkable net margin of 12.17%, the company showcases strong profitability and effective cost management.
Return on Equity (ROE): SLB’s ROE surpasses industry standards, highlighting the company’s exceptional financial performance. With an impressive 5.32% ROE, the company effectively utilizes shareholder equity capital.
Return on Assets (ROA): SLB’s ROA excels beyond industry benchmarks, reaching 2.29%. This signifies efficient management of assets and strong financial health.
Debt Management: SLB’s debt-to-equity ratio is below industry norms, indicating a sound financial structure with a ratio of 0.63.
To track all earnings releases for SLB visit their earnings calendar on our site.
This article was generated by Benzinga’s automated content engine and reviewed by an editor.
Market News and Data brought to you by Benzinga APIs
© 2024 Benzinga.com. Benzinga does not provide investment advice. All rights reserved.
Alcoa Analysts Increase Their Forecasts After Upbeat Earnings
Alcoa Corporation AA reported better-than-expected earnings for the third quarter on Wednesday.
The company reported third quarter sales of $2.904 billion, missing the consensus of $2.967 billion. Adjusted EPS of 57 cents exceeded the consensus of 28 cents.
Alcoa maintains its 2024 Alumina segment production forecast at 9.8 to 10 million metric tons while increasing its shipment projection to 12.9 to 13.1 million metric tons, up by 0.2 million metric tons from the prior forecast due to higher trading volumes.
Alcoa President and CEO William F. Oplinger said, “We gained flexibility after closing the Alumina Limited acquisition and announced the sale of our interest in the Ma’aden joint ventures.”
Alcoa shares fell 3.5% to trade at $40.60 on Thursday.
These analysts made changes to their price targets on Alcoa following earnings announcement.
- B. Riley Securities analyst Lucas Pipes upgraded Alcoa from Neutral to Buy and raised the price target from $41 to $50.
- BMO Capital analyst Katja Jancic maintained the stock with a Market Perform and raised the price target from $42 to $45.
- JP Morgan analyst Bill Peterson maintained Alcoa with a Neutral and raised the price target from $36 to $39.
Read More:
Market News and Data brought to you by Benzinga APIs
© 2024 Benzinga.com. Benzinga does not provide investment advice. All rights reserved.
Global Surgical Robots Market to Develop at a Stellar 13.4% CAGR through 2031 | SkyQuest Technology
Westford, USA, Oct. 17, 2024 (GLOBE NEWSWIRE) — SkyQuest projects that the Surgical Robots Market will attain a value of USD 32.33 billion by 2031, with a CAGR of 13.4% over the forecast period (2024-2031). Advancements in robotic technologies and growing penetration of digital technologies in the healthcare industry are forecasted to primarily bolster the demand for surgical robots over the coming years. Increasing burden on medical professionals and growing acceptance of robotic surgeries are also projected to drive sales of surgical robots in the future.
Browse in-depth TOC on “Surgical Robots Market”
To Learn More About This Report, Request a Free Sample Copy – https://www.skyquestt.com/sample-request/surgical-robots-market
Surgical Robots Market Overview:
| Report Coverage | Details |
| Market Revenue in 2023 | $ 9.53 billion |
| Estimated Value by 2031 | $ 32.33 billion |
| Growth Rate | Poised to grow at a CAGR of 13.4% |
| Forecast Period | 2024–2031 |
| Forecast Units | Value (USD Billion) |
| Report Coverage | Revenue Forecast, Competitive Landscape, Growth Factors, and Trends |
| Segments Covered | Component, Application, End User, and Region |
| Geographies Covered | North America, Europe, Asia Pacific, Middle East & Africa, Latin America |
| Report Highlights | Updated financial information / product portfolio of players |
| Key Market Opportunities | Integration of advanced technologies to enhance capabilities of surgical robots |
| Key Market Drivers | Advancements in robotic technologies and growing use of digital technologies in healthcare |
Surgical Robots Market Segmental Analysis
The Global Surgical Robots Market is segmented based on Offering, Application, End User, Region.
In terms of Offering, the market is trifurcated into Instruments & Accessories and Services.
Based on the Application, the market is segmented into Research Institutes, Pharmaceutical & Biotechnology Companies and Others.
Based on the End User, the market is divided into Hospitals & Clinics and Ambulatory Surgery Centers.
Based on Region, the market is segmented into North America, Europe, Asia Pacific, Central & South America and Middle East & Africa.
Robot Systems to Account for a Dominant Share of the Global Surgical Robot Demand Outlook
Robot systems are complete surgical systems that can operate without the need for other instruments or equipment. Robot systems can be supervised or partially controlled by surgeons to improve the safety of the surgical procedure. Increasing acceptance of robotic surgeries among patients will bolster the demand for autonomous surgical robots and contribute to the high market share of this segment.
Get Customization on this Report for Specific Research Solutions: https://www.skyquestt.com/speak-with-analyst/surgical-robots-market
Demand for Rapid Medical Response in Emergency Boosting Adoption of Surgical Robots in Ambulatory Surgical Centers
Rising incidence of accidents and disasters around the world has bolstered the demand for emergency medical response. Robots can adhere to guidelines and stay calm in face of adversities as compared to humans who might be affected in certain situations. This factor is primarily boosting sales of surgical robots for ambulatory surgical centers around the world.
North America to Spearhead Surgical Robots Consumption Owing to High Acceptance of Robotic Surgeries
North American patient population is open to robotic surgeries and has been known to quickly adopt advanced healthcare solutions, which makes this region a dominant one. Moreover, the presence of a developed healthcare infrastructure and easy availability of robotic surgery procedures in multiple healthcare establishments also help promote the demand for surgical robots in this region. The United States and Canada are forecasted to be the most opportune markets for surgical robot providers in this region.
Surgical Robots Market Insights:
Drivers
- Advancements in robotics technologies
- Acceptance of robotic surgeries
- Increasing use of digital technologies in the healthcare industry
Restraints
- High costs of surgical robots
- Risk of malfunction or surgical errors
Prominent Players in Surgical Robots Market
- Intuitive Surgical
- Stryker
- Medtronic
- Smith+Nephew
- Zimmer Biomet
- Asensus Surgical
- Siemens Healthineers
- CMR Surgical
- Johnson & Johnson
- Renishaw Plc
- avateramedical GmbH
- Brainlab AG
- THINK Surgical
- Medicaroid Corporation
- Globus Medical, Inc.
Take Action Now: Secure Your Surgical Robots Market Today – https://www.skyquestt.com/buy-now/surgical-robots-market
Key Questions Answered in Surgical Robots Market Report
- What drives the global Surgical Robots market growth?
- Who are the leading Surgical Robots providers in the world?
- Which region leads the demand for Surgical Robots in the world?
This report provides the following insights:
Analysis of key drivers (growing use of digital technologies in healthcare, rising acceptance of robotic surgeries, advancements in robotic technologies), restraints (high costs of surgical robots, risk of surgical errors and malfunctioning, stringent regulatory mandates for approval), and opportunities (integration of new technologies, targeting emerging countries), influencing the growth of Surgical Robots market.
- Market Penetration: All-inclusive analysis of product portfolio of different market players and status of new product launches.
- Product Development/Innovation: Elaborate assessment of R&D activities, new product development, and upcoming trends of the Surgical Robots market.
- Market Development: Detailed analysis of potential regions where the market has potential to grow.
- Market Diversification: Comprehensive assessment of new product launches, recent developments, and emerging regional markets.
- Competitive Landscape: Detailed analysis of growth strategies, revenue analysis, and product innovation by new and established market players.
Read Surgical Robots Market Report Today – https://www.skyquestt.com/report/surgical-robots-market
Checkout More Related Studies Published by SkyQuest Technology:
Nanorobots Market is growing at a CAGR of 11.10% in the forecast period (2024-2031)
Pharmaceutical Robots Market is growing at a CAGR of 9.20% in the forecast period (2024-2031)
Medical Robotic System Market is growing at a CAGR of 14.23% in the forecast period (2024-2031)
Surgical Blade Market is growing at a CAGR of 4.54% in the forecast period (2024-2031)
Hand-held Surgical Instruments Market is growing at a CAGR of 7.2% in the forecast period (2024-2031)
About Us:
SkyQuest is an IP focused Research and Investment Bank and Accelerator of Technology and assets. We provide access to technologies, markets and finance across sectors viz. Life Sciences, CleanTech, AgriTech, NanoTech and Information & Communication Technology.
We work closely with innovators, inventors, innovation seekers, entrepreneurs, companies and investors alike in leveraging external sources of R&D. Moreover, we help them in optimizing the economic potential of their intellectual assets. Our experiences with innovation management and commercialization have expanded our reach across North America, Europe, ASEAN and Asia Pacific.
Contact Us:
Mr. Jagraj Singh
Skyquest Technology
1 Apache Way,
Westford,
Massachusetts 01886
USA (+1) 351-333-4748
Email: sales@skyquestt.com
Visit Our Website: https://www.skyquestt.com/

© 2024 Benzinga.com. Benzinga does not provide investment advice. All rights reserved.
Texas Instruments Options Trading: A Deep Dive into Market Sentiment
Financial giants have made a conspicuous bullish move on Texas Instruments. Our analysis of options history for Texas Instruments TXN revealed 11 unusual trades.
Delving into the details, we found 54% of traders were bullish, while 36% showed bearish tendencies. Out of all the trades we spotted, 4 were puts, with a value of $150,106, and 7 were calls, valued at $671,550.
What’s The Price Target?
Based on the trading activity, it appears that the significant investors are aiming for a price territory stretching from $175.0 to $250.0 for Texas Instruments over the recent three months.
Volume & Open Interest Trends
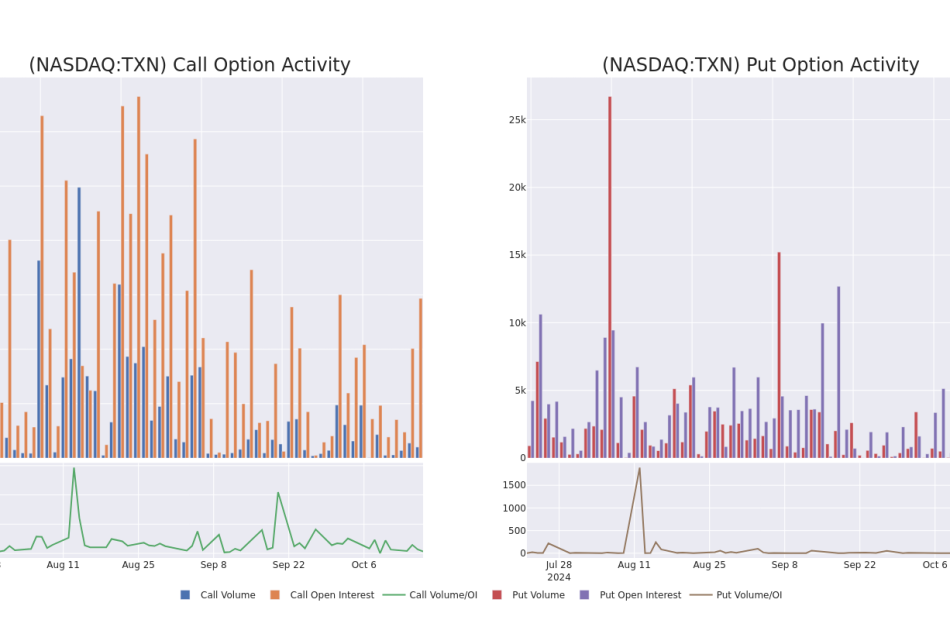
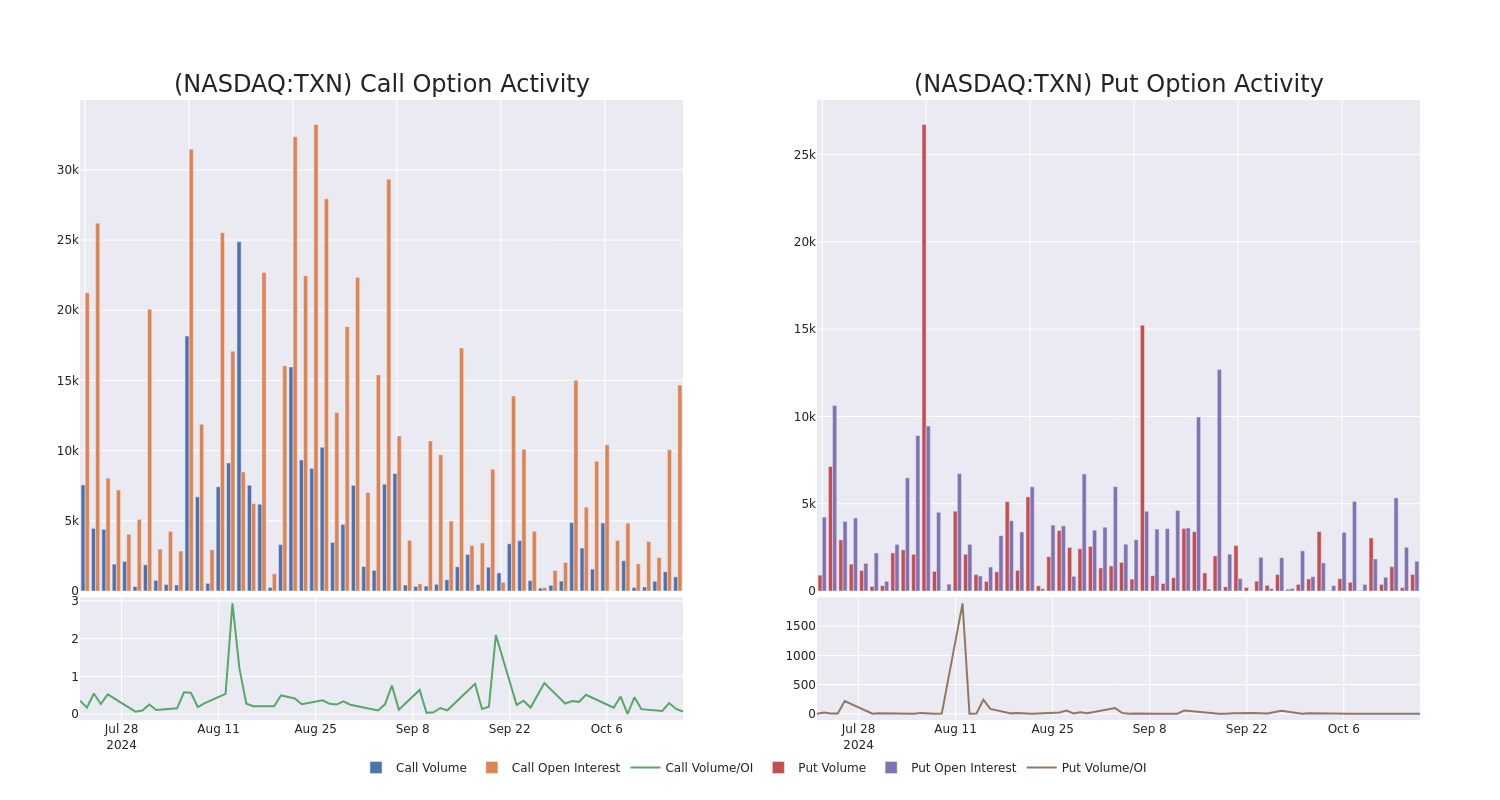
In today’s trading context, the average open interest for options of Texas Instruments stands at 1820.33, with a total volume reaching 1,961.00. The accompanying chart delineates the progression of both call and put option volume and open interest for high-value trades in Texas Instruments, situated within the strike price corridor from $175.0 to $250.0, throughout the last 30 days.
Texas Instruments 30-Day Option Volume & Interest Snapshot
Biggest Options Spotted:
| Symbol | PUT/CALL | Trade Type | Sentiment | Exp. Date | Ask | Bid | Price | Strike Price | Total Trade Price | Open Interest | Volume |
|---|---|---|---|---|---|---|---|---|---|---|---|
| TXN | CALL | SWEEP | NEUTRAL | 03/21/25 | $12.4 | $12.2 | $12.3 | $210.00 | $245.4K | 1.1K | 202 |
| TXN | CALL | TRADE | BEARISH | 12/20/24 | $6.8 | $6.55 | $6.63 | $210.00 | $238.6K | 2.1K | 379 |
| TXN | CALL | SWEEP | BULLISH | 10/25/24 | $5.25 | $4.9 | $5.16 | $202.50 | $51.5K | 103 | 109 |
| TXN | CALL | SWEEP | BULLISH | 03/21/25 | $12.5 | $12.3 | $12.3 | $210.00 | $49.2K | 1.1K | 246 |
| TXN | PUT | SWEEP | BULLISH | 10/25/24 | $1.99 | $1.97 | $1.97 | $190.00 | $47.8K | 566 | 268 |
About Texas Instruments
Dallas-based Texas Instruments generates over 95% of its revenue from semiconductors and the remainder from its well-known calculators. Texas Instruments is the world’s largest maker of analog chips, which are used to process real-world signals such as sound and power. Texas Instruments also has a leading market share position in processors and microcontrollers used in a wide variety of electronics applications.
Following our analysis of the options activities associated with Texas Instruments, we pivot to a closer look at the company’s own performance.
Present Market Standing of Texas Instruments
- Trading volume stands at 1,538,568, with TXN’s price down by -0.12%, positioned at $200.45.
- RSI indicators show the stock to be is currently neutral between overbought and oversold.
- Earnings announcement expected in 5 days.
What Analysts Are Saying About Texas Instruments
A total of 2 professional analysts have given their take on this stock in the last 30 days, setting an average price target of $225.0.
Turn $1000 into $1270 in just 20 days?
20-year pro options trader reveals his one-line chart technique that shows when to buy and sell. Copy his trades, which have had averaged a 27% profit every 20 days. Click here for access.
* An analyst from Rosenblatt has decided to maintain their Buy rating on Texas Instruments, which currently sits at a price target of $250.
* Maintaining their stance, an analyst from Cantor Fitzgerald continues to hold a Neutral rating for Texas Instruments, targeting a price of $200.
Options are a riskier asset compared to just trading the stock, but they have higher profit potential. Serious options traders manage this risk by educating themselves daily, scaling in and out of trades, following more than one indicator, and following the markets closely.
If you want to stay updated on the latest options trades for Texas Instruments, Benzinga Pro gives you real-time options trades alerts.
Market News and Data brought to you by Benzinga APIs
© 2024 Benzinga.com. Benzinga does not provide investment advice. All rights reserved.
Dry Van Container Market is Predicted to Reach US$ 9.6 Billion by 2033, Expanding at a CAGR of 5.4% | Fact.MR Report
Rockville, MD, Oct. 17, 2024 (GLOBE NEWSWIRE) — Expanding at a CAGR of 5.4% from 2023 to 2033, the global dry van containers market is estimated to reach a valuation of US$ 9.6 billion by the end of 2033. This study by Fact.MR, a market research and competitive intelligence provider, reveals that Asian countries such as India, China, and Japan are projected to make APAC the leading regional market for dry van containers.
Rapid industrialization and globalization are the two prime prospects that are anticipated to boost sales of dry van containers in the Asia Pacific region over the next ten years. Supportive government initiatives to boost manufacturing sector growth and expanding population in countries such as China and India are also estimated to increase the number of imports and exports from the region, resulting in high dry van container demand through 2033.
Meanwhile, the North American European regions are estimated to tussle for the second position in terms of share of the global dry van container market across the study period. Increasing adoption of smart containers in these regions is projected to create new opportunities for dry van container companies.
For More Insights into the Market, Request a Sample of this Report:
https://www.factmr.com/connectus/sample?flag=S&rep_id=1015

Key Takeaways from Market Study
- The global dry van container market stands at a valuation of US$ 5.65 billion in 2023.
- Demand for dry van containers is projected to expand at a CAGR of 4% from 2023 to 2033.
- The market is anticipated to reach a size of US$ 9.6 billion by 2033-end.
- Increasing globalization, supportive government initiatives to boost trading activity, growing world population, and increasing demand for imports and exports are set to be prime market drivers.
- High availability of alternative shipping containers is projected to hurt market growth prospects to some extent.
- Asia Pacific accounts for around 40% share of the global market in 2023.
- A majority of dry van containers are currently manufactured using steel.
- Sea transport is forecasted to account for high sales of dry van containers through 2033.
“Dry van container manufacturers need to focus on product innovation to cash in on the growing popularity of smart containers in the logistics industry,” says a Fact.MR analyst
Leading Players Driving Innovation in the Dry Van Container Market:
Dry van container market players are W&K Containers Inc., Sea Box Inc., Singamas Container Holdings Limited, A.P. Moller – Maersk A/S, China Shipping Container Lines Co. Ltd., Charleston Marine Containers Inc., CIMC Group, CXIC Group Containers Company Limited, Hyundai Translead Inc., Hapag-Lloyd AG.
Winning Strategy
Dry van container producers are focusing on expanding their business scope and making it futureproof by integrating advanced technologies that create smart containers. Automation of the global supply chain and changing trade conditions are also estimated to open up new avenues of opportunities for dry van container suppliers in the long run.
Dry Van Container Industry News:
- Ocean Network Express (ONE), a well-known brand in the container transportation sector, declared in February 2023 that it will be working with Sony Network Communications Europe to provide an intelligent container solution. ONE intends to embrace the era of smart logistics by integrating this solution for its worldwide fleet.
Get Customization on this Report for Specific Research Solutions:
https://www.factmr.com/connectus/sample?flag=S&rep_id=1015
More Valuable Insights on Offer
Fact.MR, in its new offering, presents an unbiased analysis of the global dry van containers market, presenting historical demand data (2018 to 2022) and forecast statistics for the period (2023 to 2033).
The study divulges essential insights on the market based on container size (dry van 20 ft., dry van 40 ft., dry van 40 ft. high cube, others), material (steel, aluminium, others), application (sea transport, land transport, intermodal transport), and end-use industry (chemicals, pharmaceuticals, food & beverages, electronics, automotive, others), across five major regions of the world (North America, Europe, Asia Pacific, Latin America, and MEA).
Check out More Related Studies Published by Fact.MR:
Logging Trailer Market: Size is expected to grow at a compound annual growth rate (CAGR) of 4.4%, from US$ 535.6 million in 2024 to US$ 823.8 million by the end of 2034.
Compact Wheel Loader Market: Size is set to reach a value of US$ 40.64 billion in 2024. Projections are that the market will expand at a CAGR of 5.1% to end up at US$ 66.83 billion by the year 2034.
Automotive Automatic Transmission Market: Size is estimated at US$ 76.11 billion in 2024 and has been forecasted to increase at 3.6% CAGR to climb to US$ 122.81 billion by the end of 2034.
Electric Vehicle Market: Size is estimated at US$ 442.34 billion in 2024 and has been projected to increase at a CAGR of 14% to reach US$ 1,639.84 billion by the end of 2034.
Fixed Wing Drone Market: Size is estimated to reach US$ 8.3 billion in 2024 and has been forecasted to climb to a value of US$ 40.6 billion by the end of 2034, expanding at a CAGR of 17.2% between 2024 and 2034.
Automotive Tire Market: Size is projected to increase from a value of US$ 403.53 billion in 2024 to US$ 626.67 billion by the end of 2034. Worldwide sales of automobile tires have been projected to rise at 3.6% CAGR from 2024 to 2034.
About Us:
Fact.MR is a distinguished market research company renowned for its comprehensive market reports and invaluable business insights. As a prominent player in business intelligence, we deliver deep analysis, uncovering market trends, growth paths, and competitive landscapes. Renowned for its commitment to accuracy and reliability, we empower businesses with crucial data and strategic recommendations, facilitating informed decision-making and enhancing market positioning.
With its unwavering dedication to providing reliable market intelligence, FACT.MR continues to assist companies in navigating dynamic market challenges with confidence and achieving long-term success. With a global presence and a team of experienced analysts, FACT.MR ensures its clients receive actionable insights to capitalize on emerging opportunities and stay competitive.
Contact:
11140 Rockville Pike
Suite 400
Rockville, MD 20852
United States
Tel: +1 (628) 251-1583
Sales Team: sales@factmr.com
Follow Us: LinkedIn | Twitter | Blog

© 2024 Benzinga.com. Benzinga does not provide investment advice. All rights reserved.

