Uncategorized

Wall Street Poised To Open Higher As TSMC Earnings Expected To Kick Off Rally In Tech Stocks: Strategist Says AI Trade Will Have Legs Even In Case Of Recession In 2025

Technology stocks, specifically chipmakers, could lead from the front on Thursday as a stellar third-quarter earnings report from Taiwan Semiconductor Manufacturing Company Ltd. TSM is triggering positive sentiment toward all artificial intelligence plays. Oil prices have rebounded and gold traded at a fresh record, while bond yields held steady ahead of a slew of market-moving data that include retail sales, a regional manufacturing activity index, industrial production, and jobless claims.

Earnings news could provide an offsetting impact in the eventuality of the market construing the economic data as inclement. Netflix, Inc. NFLX is the first among the mega-cap earnings due after the market close and the results could evince interest among traders and set the tone for the tech reporting season.

Futures Performance (+/-)
Nasdaq 100 +0.81%
S&P 500 +0.42%
Dow +0.11%
R2K -0.09%

In premarket trading on Thursday, the SPDR S&P 500 ETF Trust SPY edged up 0.42% to $584.76 and the Invesco QQQ ETF QQQ jumped 0.83% to $495, according to Benzinga Pro data.

Cues From Last Session:

Small-caps ripped higher on Wednesday, extending their recent gains amid hopes of a benign economic environment but the major averages opened on a tentative note. Solid earnings reports from financial companies and strong gains by real-estate and utility stocks helped the major indices close firmly in the green.

The Dow Jones Industrial Average turned solidly higher immediately after spending the better part of the session above the unchanged line. The 30-stock blue-chip average ended at a fresh high, although it did not have enough momentum to break above its Oct. 15 intraday high of 43,277.78.

The S&P 500 Index and the Nasdaq Composite had a lackluster first-half before picking up momentum in the afternoon.

Of the 11 S&P 500 sector classes, only communication services and consumer discretionary stocks declined in Wednesday’s session.

Index Performance (+/) Value
Nasdaq Composite +0.28% 18,367.08
S&P 500 Index +0.47% 5,842.47
Dow Industrials +0.79 43,077.70
Russell 2000 +1.64% 2,286.68

Insights From Analysts:

Delving into the small-cap rally that has been on, LPL Financial Chief Technical Strategist Adam Turnquist said after being stuck in a consolidation phase over the past few months, small-caps have picked up some momentum in recent sessions, with the growth outlook recently improving — underpinned by better-than-feared labor market conditions — and increased visibility into Fed rate cuts, he said.

The strategist noted that the Russell 2,000 Index, or RTY, has rallied off the lower end of its rising price channel. “Recent strength in the banking space — the RTY’s largest sector by weighting — has further supported small caps,” he said.

Technically, a close above 2,275 would confirm a breakout from its current symmetrical triangle and leave the 2021 highs (2,243) as the next resistance hurdle to clear, Turnquist said, adding that momentum indicators have also recently turned bullish, adding to the evidence of a topside breakout.

“Despite the improving absolute performance, the RTY vs. S&P 500 ratio chart still remains in a downtrend and below its declining 200-day moving average (DMA),” he said. A close above the July highs would validate a trend reversal in favor of small caps outperforming, he added.

Meanwhile, a fund manager thinks AI-levered companies could be defensive plays. Louis Navellier said, “Semiconductor demand has become the new proxy for global growth trends, being incorporated into almost everything, and also has geopolitical implications with technology export controls in place and China continuing to saber rattle about taking Taiwan back.”

“The upshot here is the inference that AI will still have legs even if we slide into a global recession in ’25,” he added.

See also: Best Futures Trading Software

Upcoming Economic Data:

  • The Labor Department is scheduled to release the weekly jobless claim report at 8:30 a.m. EDT. Economists, on average, expect the number of individuals claiming unemployment insurance to come in at 260,000 in the week ended Oct. 12, up from 258,000 in the previous week.
  • The Commerce Department will release its September retail sales report at 8:30 a.m. EDT. The consensus estimates call for a 0.3% month-over-month increase in headline retail sales and a more modest 0.1% rise in retail sales, excluding the volatile auto sales. This compares to 0.1% increases for both in August.
  • The Philadelphia Fed is due to release the results of its manufacturing survey at 8:30 a.m. EDT. The diffusion index of business activity is expected to rise from 1.7 in September to 3 in October.
  • The Federal Reserve will release its industrial production report for September at 9:15 a.m. EDT. The consensus estimate models a 0.2% month-over-month decline in industrial output compared to 0.8% growth in August.
  • The Commerce Department’s business inventories report, due at 10 a.m. EDT, is expected to show a 0.3% month-over-month increase in business inventories for August, slightly slower than July’s 0.4% increase.
  • The National Association of Home Builders will release its housing market index for October at 10 a.m. EDT. The headline index, which measures confidence among homebuilders, is expected to rise a point from September to 42. A reading below 50 suggests a lack of confidence.
  • The Energy Information Administration will release its weekly oil inventories report at 11 p.m. EDT.
  • The Treasury is scheduled to auction four- and eight-week bills at 11:30 a.m. EDT.

Stocks In Focus:

  • Alcoa Corporation AA climbed nearly 5% in premarket trading following the aluminum maker’s quarterly results, and TSMC surged up over 8% on a beat-and-raise quarter.
  • Other stocks moving on earnings are CSX Corporation CSX (down about 5%) Nokia Oyj NOK (down nearly 6%), and Steel Dynamics, Inc. STLD (up over 3%).
  • Blackstone Inc. (BX), Marsh & McLennan Companies, Inc. MMC, Travelers Companies, Inc. TRV, KeyCorp KEY, and M&T Bank Corporation MTB are among the noteworthy companies reporting ahead of the market opening.
  • Those reporting after the close include Netflix, Intuitive Surgical, Inc. ISRG, Crown Holdings, Inc. CCK, WD-40 Company WDFC, and Western Alliance Bancorporation WAL.
  • Expedia Group, Inc. EXPE climbed over 7.7% on the news that Uber Technologies, Inc. UBER might be interested in buying the company.
  • Lucid Group, Inc. LCID plunged over 15% on a common stock offering.

Commodities, Bonds And Global Equity Markets:

Crude oil futures are reversing course and were up modestly after their recent pullback and gold futures traded at a record. Bitcoin BTC/USD slipped over 1% over the past 24 hours and was at a sub-$67K level.

The 10-year U.S. Treasury note yield was little changed at 4.036%.

The Asian markets ended mixed on Wednesday, as the Japanese, Chinese, Hong Kong, Indian, and South Korean markets retreated. Most other markets ended on a firm note, tracking higher energy prices and the positive close on Wall Street overnight.

European stocks traded in the green in the early hours, thanks to earnings optimism.

Read Next:

Photo courtesy: Shutterstock

© 2024 Benzinga.com. Benzinga does not provide investment advice. All rights reserved.

Uncategorized

Alcoa, Netflix And 3 Stocks To Watch Heading Into Thursday

With U.S. stock futures trading lower this morning on Thursday, some of the stocks that may grab investor focus today are as follows:

  • Wall Street expects The Travelers Companies, Inc. TRV to report quarterly earnings at $3.64 per share on revenue of $11.49 billion before the opening bell, according to data from Benzinga Pro. Travelers shares gained 0.9% to $242.95 in after-hours trading.
  • Alcoa Corporation AA reported better-than-expected earnings for its third quarter. The company posted adjusted earnings of 57 cents per share, beating market estimates of 28 cents per share. Alcoa shares climbed 6% to $44.61 in the after-hours trading session.
  • Analysts expect Netflix Inc. NFLX to post quarterly earnings at $5.12 per share on revenue of $9.77 billion. The company will release earnings after the markets close. Netflix shares slipped 0.1% to $701.61 in after-hours trading.

Check out our premarket coverage here

  • Steel Dynamics Inc STLD reported stronger-than-expected earnings for its third quarter on Wednesday. The company said it shipped 3.2 million tons of steel during the third quarter and generated cash flow from operations of $760 million. Steel Dynamics shares gained 1.9% to $132.26 in the after-hours trading session.
  • Analysts expect Marsh & McLennan Companies, Inc. MMC to report quarterly earnings at $1.61 per share on revenue of $5.70 billion before the opening bell. Marsh & McLennan shares rose 0.5% to $228.99 in after-hours trading.

Check This Out:

Photo courtesy: Wikimedia

Market News and Data brought to you by Benzinga APIs

Uncategorized

The stock market is in a 'mania' that will push it higher before a potential 26% drop in 2025, Stifel says

A bear with a downward stock arrow behind it

The S&P 500 looks like it’s in another “mania,” according to a Stifel analysis of the last 139 years of market history. Adobe Firefly, Tyler Le/BI

  • The S&P 500 could lose a quarter of its value next year, according to Stifel.

  • The benchmark index looks like it’s caught in a “mania,” the firm’s strategists said in a note.

  • Investors could be impacted long-term, as manias tend to lead to poor returns in the next decade.

The S&P 500 looks like it’s in the midst of another “mania,” and investors could see a steep drop in the benchmark index sometime next year, according to Stifel.

Strategists at the investment firm pointed to lofty valuations, with the S&P 500 breaking through a series of record highs this year on the back of an improving economic outlook, expectations for Fed rate cuts, and hype for artificial intelligence.

But the benchmark index now looks similar to the past four manias that have taken place, the firm said, comparing the current investing environment to the pandemic stock boom, the dot-com bubble, and stock run-ups in the 1920s and late 1800s.

Growth returns “excess of Value” in today’s market look “almost exactly the same” as they did leading up to the 1929 stock crash, the firm added.

Graph showing S&P 500 price to earnings ratio over trendline

The S&P 500 looks like the fifth stock mania, according to a Stifel analysis spanning the last 139 years.Bloomberg data, Stifel estimates

“We took a clean sheet look at the equity market and came away with the same smh (shaking my head) emoji reaction. Despite all the soft-ladning and Fed rate cut optimism, the S&P 500 up almost 40% y/y has simply over-shot,” strategists said in a note on Tuesday.

If the S&P 500 follows the path of a “classic mania,” that implies the benchmark index will rally to around 6,400 before falling back to 4,750 next year, strategists said.

“Sure, we can cherry-pick with the best of them and apply the most over-valued cyclically adjusted valuation level of the past 35 years to show about 10% further upside, but that same analysis of a century of manias also returns the S&P 500 in 2025 to where 2024 began (down 26% from that prospective peak),” the note added.

Stocks could be challenged next year due to the uncertain outlook for Fed rate cuts, the strategists suggested. While the Fed has signaled more cuts are coming, central bankers also risk undermining their inflation goals if they cut rates too soon.

“The conclusion … is that if the Fed cuts rates in 2025 absent a recession (two 25’s as this year comes to a close do not count) then that would be a mistake, with investors paying the price in latter 2025 / 2026, based on historical precedent,” strategists wrote.

Investors could be impacted for the long-term, they added, pointing to previous manias, which historically led to weak stock returns over the following decade.

“Or at least that has been the case for the past three generations, making manias as disruptive for capital markets on the way down as they are euphoric on the way up,” they said.

A handful of other Wall Street forecasters have also said stocks look overvalued, but investors remain generally optimistic about the outlook for equities, particularly as they expect more rate cuts into 2025.

Read the original article on Business Insider

Uncategorized

Westamerica Bancorporation Reports Third Quarter 2024 Financial Results

SAN RAFAEL, Calif., Oct. 17, 2024 (GLOBE NEWSWIRE) — Westamerica Bancorporation WABC, parent company of Westamerica Bank, generated net income for the third quarter 2024 of $35.1 million and diluted earnings per common share (“EPS”) of $1.31, which includes gains from life insurance and sales of other assets equivalent to $0.04 EPS. Third quarter 2024 results compare to second quarter 2024 net income of $35.5 million and EPS of $1.33.

“Westamerica’s third quarter 2024 results benefited from the Company’s valuable low-cost deposit base, of which 48 percent was represented by non-interest bearing checking accounts during the quarter; the annualized cost of funding our loan and bond portfolios was 0.37 percent in the quarter. Operating expenses remained well controlled at 35 percent of total revenues in the third quarter 2024. The Company recognized no provision for credit losses in the third quarter 2024. At September 30, 2024, nonperforming assets were stable at $0.9 million and the allowance for credit losses was $15.3 million,” said Chairman, President and CEO David Payne. “Third quarter 2024 results generated an annualized 13.7 percent return on average common equity. Shareholders were paid a $0.44 per common share dividend during the third quarter 2024,” concluded Payne.

Net interest income on a fully-taxable equivalent (FTE) basis was $62.5 million for the third quarter 2024, compared to $64.1 million for the second quarter 2024. The annualized yield earned on loans, bonds and cash for the third quarter 2024 was 4.45 percent compared to 4.50 percent for the second quarter 2024. The annualized cost of funding the loan and bond portfolios was 0.37 percent for the third quarter 2024, compared to 0.35 percent for the second quarter 2024.

Noninterest income for the third quarter 2024 totaled $11.9 million compared to $10.5 million for the second quarter 2024. Third quarter 2024 results include $1.6 million in gains from life insurance and sales of other assets.

Noninterest expenses for the third quarter 2024 were $26.3 million compared to $26.1 million for the second quarter 2024.

Westamerica Bancorporation’s wholly owned subsidiary Westamerica Bank, operates commercial banking and trust offices throughout Northern and Central California.

Westamerica Bancorporation
1108 Fifth Avenue, San Rafael, CA 94901
Robert A. Thorson – SVP & Treasurer
707-863-6840
investments@westamerica.com

The following appears in accordance with the Private Securities Litigation Reform Act of 1995:

This press release may contain forward-looking statements about the Company, including descriptions of plans or objectives of its management for future operations, products or services, and forecasts of its revenues, earnings or other measures of economic performance. Forward-looking statements can be identified by the fact that they do not relate strictly to historical or current facts. They often include the words “believe,” “expect,” “anticipate,” “intend,” “plan,” “estimate,” or words of similar meaning, or future or conditional verbs such as “will,” “would,” “should,” “could,” or “may.”

Forward-looking statements, by their nature, are subject to risks and uncertainties. A number of factors — many of which are beyond the Company’s control — could cause actual conditions, events or results to differ significantly from those described in the forward-looking statements. The Company’s most recent reports filed with the Securities and Exchange Commission, including the annual report for the year ended December 31, 2023 filed on Form 10-K and quarterly report for the quarter ended June 30, 2024 filed on Form 10-Q, describe some of these factors, including certain credit, interest rate, operational, liquidity and market risks associated with the Company’s business and operations. Other factors described in these reports include changes in business and economic conditions, competition, fiscal and monetary policies, disintermediation, cyber security risks, legislation including the Dodd-Frank Wall Street Reform and Consumer Protection Act of 2010, the Sarbanes-Oxley Act of 2002 and the Gramm-Leach-Bliley Act of 1999, and mergers and acquisitions.

Forward-looking statements speak only as of the date they are made. The Company does not undertake to update forward-looking statements to reflect circumstances or events that occur after the date forward looking statements are made.

  Public Information October 17, 2024  WESTAMERICA BANCORPORATION         FINANCIAL HIGHLIGHTS         September 30, 2024                     1. Net Income Summary.             (in thousands except per-share amounts)         %       Q3’2024 Q3’2023 Change Q2’2024               Net Interest and Loan Fee           Income (FTE) $ 62,465   $ 72,092   -13.4 % $ 64,100     Provision for           Credit Losses       400   n/m         Noninterest Income   11,925     11,281   5.7 %   10,500     Noninterest Expense   26,309     25,650   2.6 %   26,130     Income Before Taxes (FTE)   48,081     57,323   -16.1 %   48,470     Income Tax Provision (FTE)   13,024     15,722   -17.2 %   13,008     Net Income $ 35,057   $ 41,601   -15.7 % $ 35,462                 Average Common Shares           Outstanding   26,685     26,648   0.1 %   26,680     Diluted Average Common           Shares Outstanding   26,686     26,650   0.1 %   26,681                 Operating Ratios:           Basic Earnings Per Common           Share $ 1.31   $ 1.56   -16.0 % $ 1.33     Diluted Earnings Per           Common Share   1.31     1.56   -16.0 %   1.33     Return On Assets (a)   2.16 %   2.41 %     2.18 %   Return On Common           Equity (a)   13.7 %   18.3 %     14.4 %   Net Interest Margin (FTE) (a)   4.08 %   4.43 %     4.15 %   Efficiency Ratio (FTE)   35.4 %   30.8 %     35.0 %               Dividends Paid Per Common           Share $ 0.44   $ 0.44   0.0 % $ 0.44     Common Dividend Payout           Ratio   33 %   28 %     33 %                     %       9/30’24YTD 9/30’23YTD Change                 Net Interest and Loan Fee           Income (FTE) $ 192,659   $ 211,935   -9.1 %     Provision (Reversal           of Provision) for           Credit Losses (1)   300     (1,150 ) n/m       Noninterest Income   32,522     32,530   -0.0 %     Noninterest Expense   78,538     77,699   1.1 %     Income Before Taxes (FTE)   146,343     167,916   -12.8 %     Income Tax Provision (FTE)   39,407     45,616   -13.6 %     Net Income $ 106,936   $ 122,300   -12.6 %                 Average Common Shares           Outstanding   26,680     26,718   -0.1 %     Diluted Average Common           Shares Outstanding   26,681     26,721   -0.1 %                 Operating Ratios:           Basic Earnings Per Common           Share $ 4.01   $ 4.58   -12.4 %     Diluted Earnings Per           Common Share   4.01     4.58   -12.4 %     Return On Assets (a)   2.19 %   2.36 %       Return On Common           Equity (a)   14.4 %   18.6 %       Net Interest Margin (FTE) (a)   4.18 %   4.32 %       Efficiency Ratio (FTE)   34.9 %   31.8 %                   Dividends Paid Per Common           Share $ 1.32   $ 1.28   3.1 %     Common Dividend Payout           Ratio   33 %   28 %                 2. Net Interest Income.             (dollars in thousands)         %       Q3’2024 Q3’2023 Change Q2’2024               Interest and Loan Fee           Income (FTE) $ 68,110   $ 73,225   -7.0 % $ 69,407     Interest Expense   5,645     1,133   398.2 %   5,307     Net Interest and Loan Fee           Income (FTE) $ 62,465   $ 72,092   -13.4 % $ 64,100                 Average Earning Assets $ 6,062,174   $ 6,438,411   -5.8 % $ 6,145,626     Average Interest-Bearing           Liabilities   2,950,093     3,118,632   -5.4 %   3,001,786                 Yield on Earning Assets           (FTE) (a)   4.45 %   4.50 %     4.50 %   Cost of Funds (a)   0.37 %   0.07 %     0.35 %   Net Interest Margin (FTE) (a)   4.08 %   4.43 %     4.15 %   Interest Expense /           Interest-Bearing           Liabilities (a)   0.76 %   0.14 %     0.71 %   Net Interest Spread (FTE) (a)   3.69 %   4.36 %     3.79 %                     %       9/30’24YTD 9/30’23YTD Change                 Interest and Loan Fee           Income (FTE) $ 206,612   $ 214,146   -3.5 %     Interest Expense   13,953     2,211   531.1 %     Net Interest and Loan Fee           Income (FTE) $ 192,659   $ 211,935   -9.1 %                 Average Earning Assets $ 6,108,885   $ 6,519,448   -6.3 %     Average Interest-Bearing           Liabilities   2,969,078     3,182,734   -6.7 %                 Yield on Earning Assets           (FTE) (a)   4.48 %   4.36 %       Cost of Funds (a)   0.30 %   0.04 %       Net Interest Margin (FTE) (a)   4.18 %   4.32 %       Interest Expense /           Interest-Bearing           Liabilities (a)   0.63 %   0.09 %       Net Interest Spread (FTE) (a)   3.85 %   4.27 %                 3. Loans & Other Earning Assets.             (average volume, dollars in thousands)         %       Q3’2024 Q3’2023 Change Q2’2024               Total Assets $ 6,461,843   $ 6,847,691   -5.6 % $ 6,549,203     Total Earning Assets   6,062,174     6,438,411   -5.8 %   6,145,626     Total Loans   831,418     903,854   -8.0 %   838,016     Commercial Loans   136,160     151,431   -10.1 %   133,605     Commercial Real Estate           Loans   493,272     493,072   0.0 %   487,209     Consumer Loans   201,986     259,351   -22.1 %   217,202     Total Investment Securities   4,736,024     5,247,118   -9.7 %   4,944,191     Debt Securities Available for           Sale   3,881,678     4,353,794   -10.8 %   4,079,896     Debt Securities Held to           Maturity   854,346     893,324   -4.4 %   864,295     Total Interest-Bearing Cash   494,732     287,439   72.1 %   363,419                 Loans / Deposits   16.3 %   15.8 %     16.1 %                     %       9/30’24YTD 9/30’23YTD Change                 Total Assets $ 6,512,138   $ 6,940,897   -6.2 %     Total Earning Assets   6,108,885     6,519,448   -6.3 %     Total Loans   840,961     925,351   -9.1 %     Commercial Loans   134,402     158,204   -15.0 %     Commercial Real Estate           Loans   489,836     492,702   -0.6 %     Consumer Loans   216,723     274,445   -21.0 %     Total Investment Securities   4,925,557     5,385,986   -8.5 %     Debt Securities Available for           Sale   4,061,358     4,482,376   -9.4 %     Debt Securities Held to           Maturity   864,199     903,610   -4.4 %     Total Interest-Bearing Cash   342,367     208,111   64.5 %                 Loans / Deposits   16.1 %   15.8 %                 4. Deposits, Other Interest-Bearing Liabilities & Equity.         (average volume, dollars in thousands)         %       Q3’2024 Q3’2023 Change Q2’2024               Total Deposits $ 5,092,244   $ 5,722,817   -11.0 % $ 5,202,620     Noninterest Demand   2,425,646     2,721,358   -10.9 %   2,485,023     Interest-Bearing Transaction   937,694     1,149,483   -18.4 %   981,703     Savings   1,639,997     1,741,994   -5.9 %   1,642,806     Time greater than $100K   32,815     43,073   -23.8 %   34,721     Time less than $100K   56,092     66,909   -16.2 %   58,367     Total Short-Term Borrowings   283,495     117,173   141.9 %   284,189     Bank Term Funding Program           Borrowings   167,391       n/m     200,000     Securities Sold under           Repurchase Agreements   116,104     117,173   -0.9 %   84,189     Shareholders’ Equity   1,016,642     902,300   12.7 %   990,927                 Demand Deposits /           Total Deposits   47.6 %   47.6 %     47.8 %   Transaction & Savings           Deposits / Total Deposits   98.3 %   98.1 %     98.2 %                     %       9/30’24YTD 9/30’23YTD Change                 Total Deposits $ 5,224,158   $ 5,859,506   -10.8 %     Noninterest Demand   2,480,815     2,774,282   -10.6 %     Interest-Bearing Transaction   992,363     1,180,551   -15.9 %     Savings   1,658,106     1,783,891   -7.1 %     Time greater than $100K   34,550     51,481   -32.9 %     Time less than $100K   58,324     69,301   -15.8 %     Total Short-Term Borrowings   225,735     97,510   131.5 %     Bank Term Funding Program           Borrowings   143,412       n/m           Securities Sold under           Repurchase Agreements   82,323     97,510   -15.6 %     Shareholders’ Equity   991,229     879,740   12.7 %                 Demand Deposits /           Total Deposits   47.5 %   47.3 %       Transaction & Savings           Deposits / Total Deposits   98.2 %   97.9 %                 5. Interest Yields Earned & Rates Paid.             (dollars in thousands)       Q3’2024       Average Income/ Yield (a) /       Volume Expense Rate (a)                 Interest & Loan Fee Income Earned:           Total Earning Assets (FTE) $ 6,062,174   $ 68,110   4.45 %     Total Loans (FTE)   831,418     11,526   5.52 %     Commercial Loans (FTE)   136,160     2,393   7.00 %     Commercial Real Estate           Loans   493,272     6,308   5.09 %     Consumer Loans   201,986     2,825   5.57 %     Total Investments (FTE)   4,736,024     49,822   4.17 %     Total Debt Securities           Available for Sale (FTE)   3,881,678     41,133   4.19 %     Corporate Securities   2,074,145     14,268   2.75 %     Collateralized Loan           Obligations   1,166,189     21,459   7.20 %     Agency Mortgage Backed           Securities   244,994     1,638   2.68 %     Securities of U.S.           Government sponsored           entities   310,138     2,777   3.58 %     Obligations of States and           Political Subdivisions           (FTE)   67,141     518   3.08 %     U.S. Treasury Securities   4,844     62   5.13 %     Other Debt Securities           Available for Sale (FTE)   14,227     411   11.55 %     Total Debt Securities Held to           Maturity (FTE)   854,346     8,689   4.07 %     Agency Mortgage Backed           Securities   65,545     376   2.29 %     Corporate Securities   732,689     7,815   4.27 %     Obligations of States and           Political Subdivisions           (FTE)   56,112     498   3.55 %     Total Interest-Bearing Cash   494,732     6,762   5.35 %                 Interest Expense Paid:           Total Earning Assets   6,062,174     5,645   0.37 %     Total Interest-Bearing           Liabilities   2,950,093     5,645   0.76 %     Total Interest-Bearing           Deposits   2,666,598     3,113   0.46 %     Interest-Bearing Transaction   937,694     47   0.02 %     Savings   1,639,997     2,990   0.73 %     Time less than $100K   56,092     46   0.33 %     Time greater than $100K   32,815     30   0.36 %     Total Short-Term Borrowings   283,495     2,532   3.54 %     Bank Term Funding Program           Borrowings   167,391     2,278   5.40 %     Securities Sold under           Repurchase Agreements   116,104     254   0.87 %                 Net Interest Income and           Margin (FTE)   $ 62,465   4.08 %       Q3’2023       Average Income/ Yield (a) /       Volume Expense Rate (a)                 Interest & Loan Fee Income Earned:           Total Earning Assets (FTE) $ 6,438,411   $ 73,225   4.50 %     Total Loans (FTE)   903,854     12,016   5.27 %     Commercial Loans (FTE)   151,431     2,743   7.19 %     Commercial Real Estate           Loans   493,072     5,914   4.76 %     Consumer Loans   259,351     3,359   5.14 %     Total Investments (FTE)   5,247,118     57,280   4.32 %     Total Debt Securities           Available for Sale (FTE)   4,353,794     48,285   4.38 %     Corporate Securities   2,148,308     14,851   2.77 %     Collateralized Loan           Obligations   1,530,992     28,023   7.16 %     Agency Mortgage Backed           Securities   276,755     1,676   2.42 %     Securities of U.S.           Government sponsored           entities   307,106     2,777   3.62 %     Obligations of States and           Political Subdivisions           (FTE)   76,406     573   3.00 %     Other Debt Securities           Available for Sale (FTE)   14,227     385   10.82 %     Total Debt Securities Held to           Maturity (FTE)   893,324     8,995   4.03 %     Agency Mortgage Backed           Securities   88,147     475   2.16 %     Corporate Securities   725,862     7,815   4.31 %     Obligations of States and           Political Subdivisions           (FTE)   79,315     705   3.55 %     Total Interest-Bearing Cash   287,439     3,929   5.35 %                 Interest Expense Paid:           Total Earning Assets   6,438,411     1,133   0.07 %     Total Interest-Bearing           Liabilities   3,118,632     1,133   0.14 %     Total Interest-Bearing           Deposits   3,001,459     1,095   0.14 %     Interest-Bearing Transaction   1,149,483     131   0.05 %     Savings   1,741,994     886   0.20 %     Time less than $100K   66,909     52   0.31 %     Time greater than $100K   43,073     26   0.24 %     Total Short-Term Borrowings   117,173     38   0.13 %     Securities Sold under           Repurchase Agreements   117,173     38   0.13 %                 Net Interest Income and           Margin (FTE)   $ 72,092   4.43 %               6. Noninterest Income.             (dollars in thousands except per-share amounts)         %       Q3’2024 Q3’2023 Change Q2’2024               Service Charges on Deposit           Accounts $ 3,585   $ 3,705   -3.2 % $ 3,469     Merchant Processing           Services   2,474     2,911   -15.0 %   2,733     Debit Card Fees   1,702     1,717   -0.9 %   1,706     Trust Fees   846     783   8.0 %   811     ATM Processing Fees   533     640   -16.7 %   540     Other Service Fees   454     463   -1.9 %   450     Life Insurance Gains   202     278   n/m         Other Noninterest Income   2,129     784   171.6 %   791     Total Noninterest Income $ 11,925   $ 11,281   5.7 % $ 10,500                 Operating Ratios:           Total Revenue (FTE) $ 74,390   $ 83,373   -10.8 % $ 74,600     Noninterest Income /           Revenue (FTE)   16.0 %   13.5 %     14.1 %   Service Charges /           Avg. Deposits (a)   0.28 %   0.26 %     0.27 %   Total Revenue (FTE) Per           Avg. Common Share (a) $ 11.09   $ 12.41   -10.7 % $ 11.25                       %       9/30’24YTD 9/30’23YTD Change                 Service Charges on Deposit           Accounts $ 10,524   $ 10,629   -1.0 %     Merchant Processing           Services   7,714     8,417   -8.4 %     Debit Card Fees   4,951     5,118   -3.3 %     Trust Fees   2,451     2,358   3.9 %     ATM Processing Fees   1,664     1,996   -16.6 %     Other Service Fees   1,342     1,320   1.7 %     Life Insurance Gains   202     278   n/m       Securities Losses       (125 ) n/m       Other Noninterest Income   3,674     2,539   44.7 %     Total Noninterest Income $ 32,522   $ 32,530   -0.0 %                 Operating Ratios:           Total Revenue (FTE) $ 225,181   $ 244,465   -7.9 %     Noninterest Income /           Revenue (FTE)   14.4 %   13.3 %       Service Charges /           Avg. Deposits (a)   0.27 %   0.24 %       Total Revenue (FTE) Per           Avg. Common Share (a) $ 11.27   $ 12.23   -7.8 %               7. Noninterest Expense.             (dollars in thousands)         %       Q3’2024 Q3’2023 Change Q2’2024               Salaries and Related Benefits $ 12,762   $ 11,820   8.0 % $ 12,483     Occupancy and Equipment   5,256     5,065   3.8 %   5,158     Outsourced Data Processing   2,614     2,473   5.7 %   2,511     Limited Partnership           Operating Losses   1,210     1,440   -16.0 %   1,440     Professional Fees   337     401   -16.0 %   362     Courier Service   682     745   -8.5 %   686     Other Noninterest Expense   3,448     3,706   -7.0 %   3,490     Total Noninterest Expense $ 26,309   $ 25,650   2.6 % $ 26,130                 Operating Ratios:           Noninterest Expense /           Avg. Earning Assets (a)   1.73 %   1.58 %     1.71 %   Noninterest Expense /           Revenues (FTE)   35.4 %   30.8 %     35.0 %                     %       9/30’24YTD 9/30’23YTD Change                 Salaries and Related Benefits $ 37,831   $ 35,715   5.9 %     Occupancy and Equipment   15,454     15,562   -0.7 %     Outsourced Data Processing   7,661     7,405   3.5 %     Limited Partnership           Operating Losses   4,090     4,314   -5.2 %     Professional Fees   1,101     1,362   -19.2 %     Courier Service   2,017     1,971   2.3 %     Other Noninterest Expense   10,384     11,370   -8.7 %     Total Noninterest Expense $ 78,538   $ 77,699   1.1 %                 Operating Ratios:           Noninterest Expense /           Avg. Earning Assets (a)   1.72 %   1.59 %       Noninterest Expense /           Revenues (FTE)   34.9 %   31.8 %                 8. Allowance for Credit Losses.             (dollars in thousands)         %       Q3’2024 Q3’2023 Change Q2’2024               Average Total Loans $ 831,418   $ 903,854   -8.0 % $ 838,016                 Beginning of Period           Allowance for Credit           Losses on Loans (ACLL) $ 15,952   $ 18,480   -13.7 % $ 15,879     Provision for           Credit Losses       400   n/m         Net ACLL (Losses)           Recoveries   (634 )   (1,136 ) -44.2 %   73     End of Period ACLL $ 15,318   $ 17,744   -13.7 % $ 15,952                 Gross ACLL Recoveries /           Gross ACLL Losses   62 %   46 %     105 %   Net ACLL (Losses)           Recoveries /           Avg. Total Loans (a)   -0.30 %   -0.50 %     0.04 %                     %       9/30’24YTD 9/30’23YTD Change                 Average Total Loans $ 840,961   $ 925,351   -9.1 %                 Beginning of Period ACLL $ 16,867   $ 20,284   -16.8 %     Provision (Reversal           of Provision) for           Credit Losses (1)   300     (1,150 ) n/m       Net ACLL Losses   (1,849 )   (1,390 ) 33.0 %     End of Period ACLL $ 15,318   $ 17,744   -13.7 %                 Gross ACLL Recoveries /           Gross ACLL Losses   64 %   76 %       Net ACLL Losses /           Avg. Total Loans (a)   -0.29 %   -0.20 %                     (dollars in thousands)         %       9/30/24 9/30/23 Change 6/30/24   Allowance for Credit Losses           on Loans $ 15,318   $ 17,744   -13.7 % $ 15,952     Allowance for Credit Losses           on Held to Maturity           Securities   1     1   0.0 %   1     Total Allowance for Credit           Losses $ 15,319   $ 17,745   -13.7 % $ 15,953                 Allowance for Unfunded           Credit Commitments $ 201   $ 201   0.0 % $ 201               9. Credit Quality.             (dollars in thousands)         %       9/30/24 9/30/23 Change 6/30/24               Nonperforming Loans:           Nonperforming Nonaccrual           Loans $ 252   $ 205   22.9 % $ 971     Performing Nonaccrual           Loans       4   n/m         Total Nonaccrual Loans   252     209   20.6 %   971     Accruing Loans 90+ Days           Past Due   667     1,029   -35.2 %   580     Total Nonperforming Loans $ 919   $ 1,238   -25.8 % $ 1,551                 Total Loans Outstanding $ 833,967   $ 885,850   -5.9 % $ 831,842                 Total Assets   6,161,143     6,567,288   -6.2 %   6,312,145                 Loans:           Allowance for Credit Losses           on Loans $ 15,318   $ 17,744   -13.7 % $ 15,952     Allowance for Credit Losses           on Loans / Loans   1.84 %   2.00 %     1.92 %   Nonperforming Loans /           Total Loans   0.11 %   0.14 %     0.19 %             10. Liquidity.                       At September 30, 2024, the Company had $502,945 thousand in cash balances. During the twelve months ending September 30, 2025, the Company expects to receive $321,000 thousand in principal payments from its debt securities. If additional operational liquidity is required, the Company can pledge debt securities as collateral for borrowing purposes; at September 30, 2024, the Company’s debt securities which qualify as collateral for borrowing totaled $3,696,256 thousand. In the ordinary course of business, the Company pledges debt securities as collateral for certain depository customers; at September 30, 2024, the Company had pledged $764,404 thousand in debt securities for depository customers. In the ordinary course of business, the Company pledges debt securities as collateral for borrowing from the Federal Reserve Bank; at September 30, 2024, the Company had pledged $815,919 thousand in debt securities at the Federal Reserve Bank. During the nine months ended September 30, 2024, the Company’s average borrowings from the Federal Reserve Bank and other correspondent banks were $143,412 thousand and $-0- thousand, respectively, and at September 30, 2024, the Company had no borrowings from the Federal Reserve Bank or other correspondent banks. At September 30, 2024, the Company had access to borrowing from the Federal Reserve up to $815,919 thousand based on collateral pledged at September 30, 2024. At September 30, 2024, the Company’s estimated unpledged collateral qualifying debt securities totaled $1,663,673 thousand. Debt securities eligible as collateral are shown at market value.                       (in thousands)           9/30/24   Debt Securities Eligible as           Collateral:           Corporate Securities       $ 2,625,616     Collateralized Loan           Obligations rated AAA         356,221     Obligations of States and           Political Subdivisions         117,521     Agency Mortgage Backed           Securities         288,390     Securities of U.S. Government           Sponsored Entities         303,609     U.S. Treasury Securities         4,899     Total Debt Securities Eligible           as Collateral       $ 3,696,256                 Debt Securities Pledged           as Collateral:           Deposits by Public Entities       ($ 764,404 )   Securities Sold under           Repurchase Agreements         (442,940 )   Debt Securities Pledged           at the Federal Reserve Bank         (815,919 )   Other         (9,320 )   Total Debt Securities Pledged           as Collateral       ($ 2,032,583 )               Estimated Debt Securities           Available to Pledge       $ 1,663,673               11. Capital.             (in thousands, except per-share amounts)         %       9/30/24 9/30/23 Change 6/30/24               Shareholders’ Equity $ 909,040   $ 648,423   40.2 % $ 815,600     Total Assets   6,161,143     6,567,288   -6.2 %   6,312,145     Shareholders’ Equity/           Total Assets   14.75 %   9.87 %     12.92 %   Shareholders’ Equity/           Total Loans   109.00 %   73.20 %     98.05 %   Tangible Common Equity           Ratio   13.03 %   8.17 %     11.21 %   Common Shares Outstanding   26,686     26,649   0.1 %   26,683     Common Equity Per Share $ 34.06   $ 24.33   40.0 % $ 30.57     Market Value Per Common           Share   49.42     43.25   14.3 %   48.53                   (shares in thousands)         %       Q3’2024 Q3’2023 Change Q2’2024   Share issuances (Retirements):           Total Shares Retired         n/m         Average Retirement Price $   $   n/m   $     Net Shares Issued   (3 )   (1 ) n/m     (5 )                     %       9/30’24YTD 9/30’23YTD Change                 Total Shares Retired   4     274   n/m       Average Retirement Price $ 45.58   $ 50.11   n/m       Net Shares (Issued) Retired   (15 )   264   n/m                 12. Period-End Balance Sheets.             (unaudited, dollars in thousands)         %       9/30/24 9/30/23 Change 6/30/24   Assets:           Cash and Due from Banks $ 502,945   $ 420,550   19.6 % $ 486,124                 Debt Securities Available for           Sale:           Corporate Securities   1,901,617     1,814,424   4.8 %   1,855,618     Collateralized Loan           Obligations   1,078,920     1,503,078   -28.2 %   1,255,110     Agency Mortgage Backed           Securities   227,565     239,728   -5.1 %   222,806     Securities of U.S.           Government sponsored           entities   303,609     279,364   8.7 %   291,206     Obligations of States and           Political Subdivisions   63,876     69,639   -8.3 %   69,758     U.S. Treasury Securities   4,899       n/m     4,820     Total Debt Securities           Available for Sale   3,580,486     3,906,233   -8.3 %   3,699,318                 Debt Securities Held to           Maturity:           Agency Mortgage Backed           Securities   62,745     84,347   -25.6 %   67,777     Corporate Securities   733,748     726,951   0.9 %   732,049     Obligations of States and           Political Subdivisions (2)   53,768     77,558   -30.7 %   61,042     Total Debt Securities           Held to Maturity (2)   850,261     888,856   -4.3 %   860,868                 Loans   833,967     885,850   -5.9 %   831,842     Allowance For Credit Losses           on Loans   (15,318 )   (17,744 ) -13.7 %   (15,952 )   Total Loans, net   818,649     868,106   -5.7 %   815,890                 Premises and Equipment, net   26,129     27,490   -5.0 %   26,275     Identifiable Intangibles, net   178     404   -55.8 %   234     Goodwill   121,673     121,673   0.0 %   121,673     Other Assets   260,822     333,976   -21.9 %   301,763                 Total Assets $ 6,161,143   $ 6,567,288   -6.2 % $ 6,312,145                 Liabilities and Shareholders’           Equity:           Deposits:           Noninterest-Bearing $ 2,375,958   $ 2,723,403   -12.8 % $ 2,459,467     Interest-Bearing Transaction   925,455     1,138,220   -18.7 %   936,186     Savings   1,677,332     1,732,849   -3.2 %   1,646,781     Time   86,305     104,541   -17.4 %   89,006     Total Deposits   5,065,050     5,699,013   -11.1 %   5,131,440                 Bank Term Funding           Program Borrowings         n/m     200,000     Securities Sold under           Repurchase Agreements   132,487     115,341   14.9 %    100,167     Total Short-Term           Borrowed Funds   132,487     115,341   14.9 %   300,167                 Other Liabilities   54,566     104,511   -47.8 %   64,938     Total Liabilities   5,252,103     5,918,865   -11.3 %   5,496,545                 Shareholders’ Equity:           Common Equity:           Paid-In Capital   475,096     471,862   0.7 %   474,618     Accumulated Other           Comprehensive Loss   (127,653 )   (285,709 ) -55.3 %   (197,300 )   Retained Earnings   561,597     462,270   21.5 %   538,282     Total Shareholders’ Equity   909,040     648,423   40.2 %   815,600                 Total Liabilities and           Shareholders’ Equity $ 6,161,143   $ 6,567,288   -6.2 % $ 6,312,145               13. Income Statements.             (unaudited, in thousands except per-share amounts)         %       Q3’2024 Q3’2023 Change Q2’2024   Interest and Loan Fee Income:           Loans $ 11,441   $ 11,925   -4.1 % $ 11,354     Equity Securities   175     152   15.1 %   175     Debt Securities Available           for Sale   40,829     47,994   -14.9 %   43,927     Debt Securities Held to           Maturity   8,587     8,848   -2.9 %   8,655     Interest-Bearing Cash   6,762     3,929   72.1 %   4,961     Total Interest and Loan           Fee Income   67,794     72,848   -6.9 %   69,072                 Interest Expense:           Transaction Deposits   47     131   -64.1 %   69     Savings Deposits   2,990     886   237.5 %   2,322     Time Deposits   76     78   -2.6 %   69     Bank Term Funding Program           Borrowings   2,278       n/m     2,692     Securities Sold under           Repurchase Agreements   254     38   565.8 %   155     Total Interest Expense   5,645     1,133   398.2 %   5,307                 Net Interest and Loan           Fee Income   62,149     71,715   -13.3 %   63,765                 Provision for Credit Losses       400   n/m                     Noninterest Income:                       Service Charges on Deposit           Accounts   3,585     3,705   -3.2 %   3,469     Merchant Processing           Services   2,474     2,911   -15.0 %   2,733     Debit Card Fees   1,702     1,717   -0.9 %   1,706     Trust Fees   846     783   8.0 %   811     ATM Processing Fees   533     640   -16.7 %   540     Other Service Fees   454     463   -1.9 %   450     Life Insurance Gains   202     278   n/m         Other Noninterest Income   2,129     784   171.6 %   791     Total Noninterest Income   11,925     11,281   5.7 %   10,500                 Noninterest Expense:           Salaries and Related Benefits   12,762     11,820   8.0 %   12,483     Occupancy and Equipment   5,256     5,065   3.8 %   5,158     Outsourced Data Processing   2,614     2,473   5.7 %   2,511     Limited Partnership           Operating Losses   1,210     1,440   -16.0 %   1,440     Professional Fees   337     401   -16.0 %   362     Courier Service   682     745   -8.5 %   686     Other Noninterest Expense   3,448     3,706   -7.0 %   3,490     Total Noninterest Expense   26,309     25,650   2.6 %   26,130                 Income Before Income Taxes   47,765     56,946   -16.1 %   48,135     Income Tax Provision   12,708     15,345   -17.2 %   12,673     Net Income $ 35,057   $ 41,601   -15.7 % $ 35,462                 Average Common Shares           Outstanding   26,685     26,648   0.1 %   26,680     Diluted Average Common           Shares Outstanding   26,686     26,650   0.1 %   26,681                 Per Common Share Data:           Basic Earnings $ 1.31   $ 1.56   -16.0 % $ 1.33     Diluted Earnings   1.31     1.56   -16.0 %   1.33     Dividends Paid   0.44     0.44   0.0 %   0.44           %       9/30’24YTD 9/30’23YTD Change     Interest and Loan Fee Income:           Loans $ 34,119   $ 35,510   -3.9 %     Equity Securities   524     456   14.9 %     Debt Securities Available           for sale   130,999     142,256   -7.9 %     Debt Securities Held to           Maturity   25,964     26,758   -3.0 %     Interest-Bearing Cash   14,006     7,981   75.5 %     Total Interest and Loan           Fee Income   205,612     212,961   -3.5 %                 Interest Expense:           Transaction Deposits   235     329   -28.6 %     Savings Deposits   7,229     1,562   362.8 %     Time Deposits   215     244   -11.9 %     Bank Term Funding Program           Borrowings   5,813       n/m       Securities Sold under           Repurchase Agreements   461     76   506.6 %     Total Interest Expense   13,953     2,211   531.1 %                 Net Interest and Loan           Fee Income   191,659     210,750   -9.1 %                 Provision (Reversal           of Provision) for           Credit Losses (1)   300     (1,150 ) n/m                   Noninterest Income:                       Service Charges on Deposit   10,524     10,629   -1.0 %     Accounts           Merchant Processing           Services   7,714     8,417   -8.4 %     Debit Card Fees   4,951     5,118   -3.3 %     Trust Fees   2,451     2,358   3.9 %     ATM Processing Fees   1,664     1,996   -16.6 %     Other Service Fees   1,342     1,320   1.7 %     Life Insurance Gains   202     278   n/m       Securities Losses       (125 ) n/m       Other Noninterest Income   3,674     2,539   44.7 %     Total Noninterest Income   32,522     32,530   -0.0 %                 Noninterest Expense:           Salaries and Related Benefits   37,831     35,715   5.9 %     Occupancy and Equipment   15,454     15,562   -0.7 %     Outsourced Data Processing   7,661     7,405   3.5 %     Limited Partnership           Operating Losses   4,090     4,314   -5.2 %     Professional Fees   1,101     1,362   -19.2 %     Courier Service   2,017     1,971   2.3 %     Other Noninterest Expense   10,384     11,370   -8.7 %     Total Noninterest Expense   78,538     77,699   1.1 %                 Income Before Income Taxes   145,343     166,731   -12.8 %     Income Tax Provision   38,407     44,431   -13.6 %     Net Income $ 106,936   $ 122,300   -12.6 %                 Average Common Shares           Outstanding   26,680     26,718   -0.1 %     Diluted Average Common           Shares Outstanding   26,681     26,721   -0.1 %                 Per Common Share Data:           Basic Earnings $ 4.01   $ 4.58   -12.4 %     Diluted Earnings   4.01     4.58   -12.4 %     Dividends Paid   1.32     1.28   3.1 %                             Footnotes and Abbreviations:                       (1) A recovery in excess of principal charged off on the loan in the first quarter 2023 resulted in a $1,550 thousand reversal of the allowance for credit loss provision in the first quarter 2023.               (2) Debt Securities Held To Maturity and Obligations of States and Political Subdivisions are net of related reserve for expected credit losses of $1 thousand at September 30, 2024, June 30, 2024 and September 30, 2023.               (FTE) Fully Taxable Equivalent. The Company presents its net interest margin and net interest income on a FTE basis using the current statutory federal tax rate. Management believes the FTE basis is valuable to the reader because the Company’s loan and investment securities portfolios contain a portion of municipal loans and securities that are federally tax exempt. The Company’s tax exempt loans and securities composition may not be similar to that of other banks, therefore in order to reflect the impact of the federally tax exempt loans and securities on the net interest margin and net interest income for comparability with other banks, the Company presents its net interest margin and net interest income on a FTE basis.               (a) Annualized        

Uncategorized

Dollar Gen Options Trading: A Deep Dive into Market Sentiment

High-rolling investors have positioned themselves bearish on Dollar Gen DG, and it’s important for retail traders to take note.
This activity came to our attention today through Benzinga’s tracking of publicly available options data. The identities of these investors are uncertain, but such a significant move in DG often signals that someone has privileged information.

Today, Benzinga’s options scanner spotted 9 options trades for Dollar Gen. This is not a typical pattern.

The sentiment among these major traders is split, with 44% bullish and 55% bearish. Among all the options we identified, there was one put, amounting to $39,618, and 8 calls, totaling $435,556.

Projected Price Targets

Taking into account the Volume and Open Interest on these contracts, it appears that whales have been targeting a price range from $78.0 to $105.0 for Dollar Gen over the last 3 months.

Analyzing Volume & Open Interest

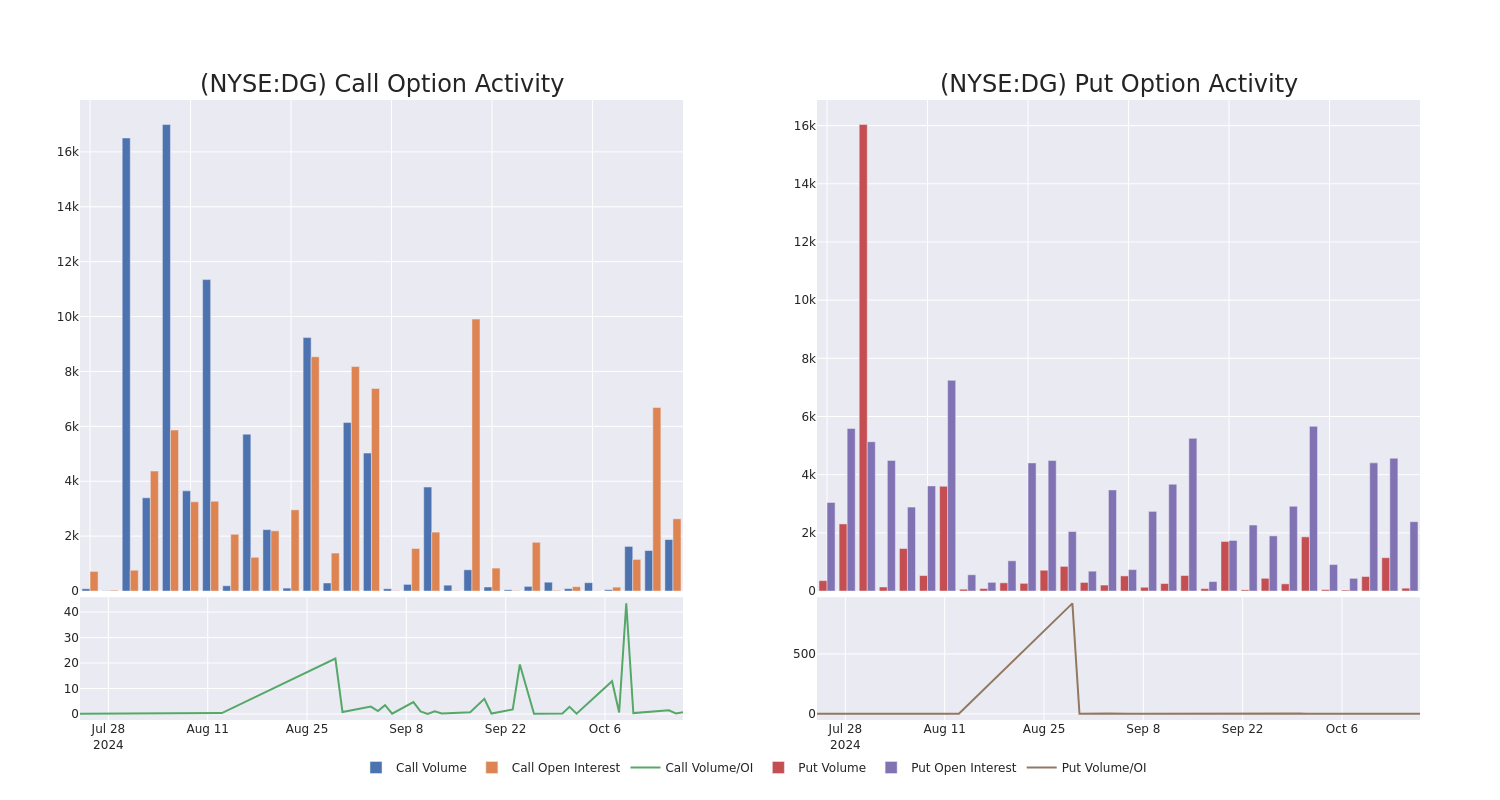
In today’s trading context, the average open interest for options of Dollar Gen stands at 836.0, with a total volume reaching 1,975.00. The accompanying chart delineates the progression of both call and put option volume and open interest for high-value trades in Dollar Gen, situated within the strike price corridor from $78.0 to $105.0, throughout the last 30 days.

Dollar Gen Option Volume And Open Interest Over Last 30 Days
Options Call Chart

Biggest Options Spotted:

Symbol PUT/CALL Trade Type Sentiment Exp. Date Ask Bid Price Strike Price Total Trade Price Open Interest Volume
DG CALL TRADE BEARISH 01/16/26 $9.3 $9.2 $9.2 $100.00 $91.9K 766 249
DG CALL TRADE BEARISH 01/16/26 $7.95 $7.8 $7.8 $105.00 $87.3K 97 114
DG CALL SWEEP BULLISH 10/25/24 $3.8 $3.15 $3.79 $78.00 $54.1K 4 144
DG CALL SWEEP BEARISH 11/15/24 $5.15 $4.8 $5.0 $80.00 $54.0K 914 108
DG CALL TRADE BULLISH 01/16/26 $9.3 $9.2 $9.3 $100.00 $50.2K 766 8

About Dollar Gen

With more than 20,000 locations, Dollar General’s banner is nearly ubiquitous across the rural United States. Dollar General serves as a convenient shopping destination for fill-in store trips, with its value proposition most relevant to consumers in small communities with a dearth of shopping options. The retailer operates a frugal store of about 7,500 square feet and primarily offers an assortment of branded and private-label consumable items (80% of net sales) such as paper and cleaning products, packaged and perishable food, tobacco, and health and beauty items at low prices. Dollar General also offers a limited assortment of seasonal merchandise, home products, and apparel. The firm sells most items at a price point of $10 or less.

After a thorough review of the options trading surrounding Dollar Gen, we move to examine the company in more detail. This includes an assessment of its current market status and performance.

Present Market Standing of Dollar Gen

  • Trading volume stands at 3,735,581, with DG’s price down by -0.44%, positioned at $81.87.
  • RSI indicators show the stock to be is currently neutral between overbought and oversold.
  • Earnings announcement expected in 49 days.

Expert Opinions on Dollar Gen

2 market experts have recently issued ratings for this stock, with a consensus target price of $79.0.

Unusual Options Activity Detected: Smart Money on the Move

Benzinga Edge’s Unusual Options board spots potential market movers before they happen. See what positions big money is taking on your favorite stocks. Click here for access.
* An analyst from Melius Research downgraded its action to Hold with a price target of $85.
* In a cautious move, an analyst from Citigroup downgraded its rating to Sell, setting a price target of $73.

Options trading presents higher risks and potential rewards. Astute traders manage these risks by continually educating themselves, adapting their strategies, monitoring multiple indicators, and keeping a close eye on market movements. Stay informed about the latest Dollar Gen options trades with real-time alerts from Benzinga Pro.

Market News and Data brought to you by Benzinga APIs

Uncategorized

Iridium's Q3 Revenue Soars 8%, FY24 Outlook Brightens As Subscriber Base Expands

Iridium Communications Inc. IRDM shares are trading higher after the company reported better-than-expected third-quarter revenue results and revised its FY24 OEBITDA guidance.

The company reported earnings per share of 21 cents, in line with the consensus estimate. Quarterly sales of $212.77 million beat the street view of $206.18 million.

Overall, total revenue increased by 8% compared to the same period in 2023, driven largely by higher commercial service revenue and government engineering revenue.

The company reported $159.9 million in service revenue and $52.9 million from equipment sales and engineering support projects.

Service revenue, primarily recurring income from Iridium’s expanding subscriber base, grew 5% year-over-year, accounting for 75% of total revenue in the third quarter of 2024.

Also Read: ShiftPixy’s Big AI Move: Supercharges Workforce Management With $150M TurboScale Deal

The company concluded the quarter with 2.48 million total billable subscribers, up from 2.23 million in the same period last year and an increase from 2.41 million as of June 30. This represents an 11% year-over-year growth in total billable subscribers, driven primarily by an increase in commercial IoT.

Iridium paid a dividend of 14 cents per common share on September 30, resulting in year-to-date dividend payments of $49.1 million to stockholders.

“Since 2021, Iridium has returned over $1 billion to common shareholders through stock repurchase and dividend activities,” said Matt Desch, CEO, Iridium. Desch added, “Most recently, our board of directors further expanded our buyback program by authorizing the repurchase of an additional $500 million of Iridium common stock through December 31, 2027.”

Outlook: Iridium anticipates a 5% growth in service revenue for FY24, compared to the previous estimate of 4% to 6%, and expects OEBITDA to be between $465 million and $470 million, revised from the prior range of $460 million to $470 million.

Net leverage is expected to remain below 4.0 times OEBITDA through 2026, with a target of falling below 2.0 times OEBITDA by the end of the decade, assuming continued execution of the company’s share repurchase program and consistent quarterly dividend payments.

Price Action: IRDM shares are trading higher by 14.2% to $34.48 at last check Thursday.

Read Next:

Market News and Data brought to you by Benzinga APIs

Uncategorized

Celsius Holdings Unusual Options Activity For October 17

Investors with a lot of money to spend have taken a bearish stance on Celsius Holdings CELH.

And retail traders should know.

We noticed this today when the trades showed up on publicly available options history that we track here at Benzinga.

Whether these are institutions or just wealthy individuals, we don’t know. But when something this big happens with CELH, it often means somebody knows something is about to happen.

So how do we know what these investors just did?

Today, Benzinga‘s options scanner spotted 8 uncommon options trades for Celsius Holdings.

This isn’t normal.

The overall sentiment of these big-money traders is split between 37% bullish and 62%, bearish.

Out of all of the special options we uncovered, 2 are puts, for a total amount of $85,400, and 6 are calls, for a total amount of $291,424.

Projected Price Targets

Based on the trading activity, it appears that the significant investors are aiming for a price territory stretching from $27.5 to $65.0 for Celsius Holdings over the recent three months.

Volume & Open Interest Trends

Looking at the volume and open interest is an insightful way to conduct due diligence on a stock.

This data can help you track the liquidity and interest for Celsius Holdings’s options for a given strike price.

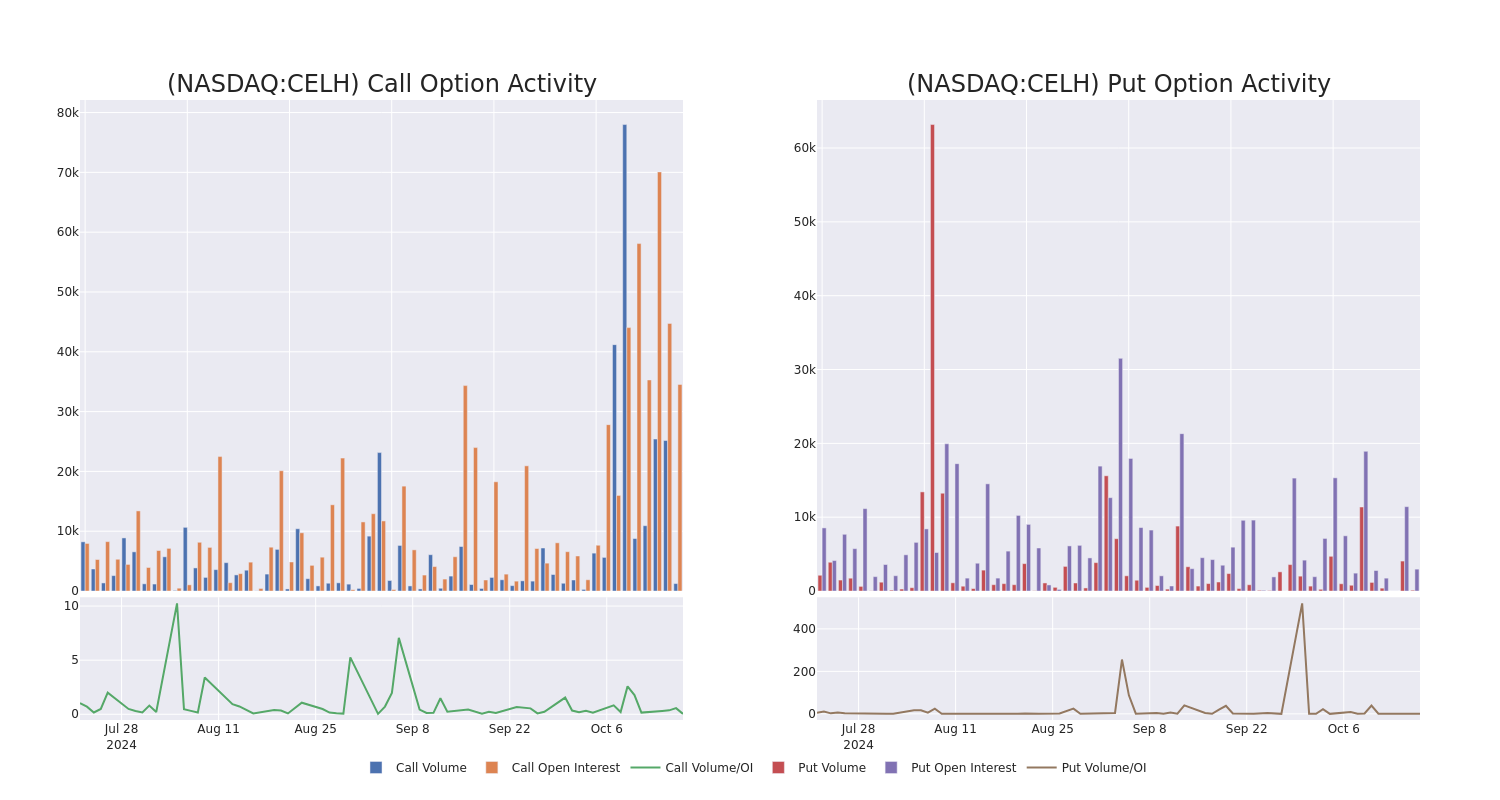
Below, we can observe the evolution of the volume and open interest of calls and puts, respectively, for all of Celsius Holdings’s whale activity within a strike price range from $27.5 to $65.0 in the last 30 days.

Celsius Holdings Option Activity Analysis: Last 30 Days
Options Call Chart

Biggest Options Spotted:

Symbol PUT/CALL Trade Type Sentiment Exp. Date Ask Bid Price Strike Price Total Trade Price Open Interest Volume
CELH CALL SWEEP BULLISH 01/16/26 $11.35 $11.05 $11.3 $30.00 $79.1K 1.2K 82
CELH CALL SWEEP BULLISH 01/16/26 $3.7 $3.6 $3.7 $65.00 $58.8K 1.3K 11
CELH PUT TRADE BEARISH 01/17/25 $17.5 $17.35 $17.5 $48.33 $50.7K 2.0K 29
CELH CALL TRADE BULLISH 11/15/24 $2.29 $2.2 $2.29 $35.00 $45.8K 8.0K 415
CELH CALL SWEEP BEARISH 11/15/24 $2.45 $2.26 $2.25 $35.00 $44.8K 8.0K 415

About Celsius Holdings

Celsius Holdings plays in the energy drink subsegment of the global nonalcoholic beverage market, with 96% of revenue concentrated in North America. Celsius’ products contain natural ingredients and a metabolism-enhancing formulation, appealing to fitness and active lifestyle enthusiasts. The firm’s portfolio includes its namesake Celsius Originals beverages (including those that are naturally caffeinated with stevia), Celsius Essentials line (containing aminos), and Celsius On-the-Go powder packets. Celsius dedicates its efforts to branding and innovation, while it utilizes third parties for the manufacturing, packaging, and distribution of its products. In 2022, Celsius forged a 20-year distribution agreement with PepsiCo, which holds an 8.5% stake in the business.

After a thorough review of the options trading surrounding Celsius Holdings, we move to examine the company in more detail. This includes an assessment of its current market status and performance.

Where Is Celsius Holdings Standing Right Now?

  • Trading volume stands at 8,625,394, with CELH’s price down by -5.6%, positioned at $31.89.
  • RSI indicators show the stock to be is currently neutral between overbought and oversold.
  • Earnings announcement expected in 19 days.

Professional Analyst Ratings for Celsius Holdings

In the last month, 3 experts released ratings on this stock with an average target price of $41.666666666666664.

Turn $1000 into $1270 in just 20 days?

20-year pro options trader reveals his one-line chart technique that shows when to buy and sell. Copy his trades, which have had averaged a 27% profit every 20 days. Click here for access.
* An analyst from Piper Sandler persists with their Overweight rating on Celsius Holdings, maintaining a target price of $47.
* Maintaining their stance, an analyst from Roth MKM continues to hold a Buy rating for Celsius Holdings, targeting a price of $43.
* An analyst from Truist Securities persists with their Hold rating on Celsius Holdings, maintaining a target price of $35.

Options trading presents higher risks and potential rewards. Astute traders manage these risks by continually educating themselves, adapting their strategies, monitoring multiple indicators, and keeping a close eye on market movements. Stay informed about the latest Celsius Holdings options trades with real-time alerts from Benzinga Pro.

Market News and Data brought to you by Benzinga APIs

Uncategorized

Lucid sparks selloff with plan for dilutive new stock sale, Q3 loss expectations

(Reuters) -Electric vehicle maker Lucid Group said it anticipates to report a bigger-than-expected loss for the third quarter and announced a public offering of over 262 million shares, sending its shares down 12% in after-market trading on Wednesday.

Additionally, Saudi Arabia’s Public Investment Fund, a majority stockholder in Lucid, said it would purchase 374.7 million shares of the company. The fund expects to maintain an ownership of nearly 59% in Lucid.

The latest investment by the sovereign wealth fund underscores the importance of this lifeline for Lucid in the race for survival among struggling EV startups.

The electric carmaker intends to use the proceeds from the offering as well the private placement from PIF to fund its capital expenditure and other corporate finance needs.

PIF had said in August that it would inject up to $1.5 billion in cash through its affiliate, Ayar Third Investment, as Lucid looks to ramp up production of a new SUV.

The Saudi government, which has maintained a nearly 60% stake in Lucid, has invested billions in the company as part of the kingdom’s strategy to diversify its economy beyond oil.

Lucid expects to report a loss from operations in the range of $765 million to $790 million for the quarter ended Sept. 30, compared with analysts’ average estimate of $751.65 million loss, according to data compiled by LSEG.

The company is scheduled to report its third-quarter results on Nov. 7.

Demand for electric vehicles in the United States has been weakening due to high interest rates and the availability of cheaper hybrid alternatives.

EV firms such as Tesla, Rivian and Lucid have slashed their prices and have been offering incentives such as cheaper financing options to woo customers.

(Reporting by Shivansh Tiwary in Bengaluru; Editing by Shreya Biswas)