e.l.f. Beauty Is Considered a Good Investment by Brokers: Is That True?
Investors often turn to recommendations made by Wall Street analysts before making a Buy, Sell, or Hold decision about a stock. While media reports about rating changes by these brokerage-firm employed (or sell-side) analysts often affect a stock’s price, do they really matter?
Before we discuss the reliability of brokerage recommendations and how to use them to your advantage, let’s see what these Wall Street heavyweights think about e.l.f. Beauty ELF.
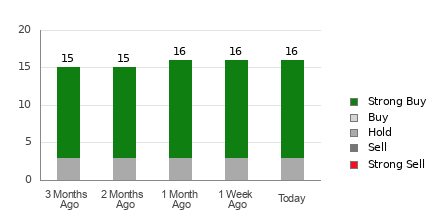
e.l.f. Beauty currently has an average brokerage recommendation of 1.38, on a scale of 1 to 5 (Strong Buy to Strong Sell), calculated based on the actual recommendations (Buy, Hold, Sell, etc.) made by 16 brokerage firms. An ABR of 1.38 approximates between Strong Buy and Buy.
Of the 16 recommendations that derive the current ABR, 13 are Strong Buy, representing 81.3% of all recommendations.
Brokerage Recommendation Trends for ELF
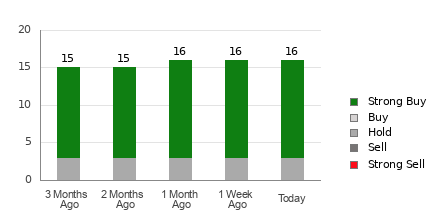
While the ABR calls for buying e.l.f. Beauty, it may not be wise to make an investment decision solely based on this information. Several studies have shown limited to no success of brokerage recommendations in guiding investors to pick stocks with the best price increase potential.
Are you wondering why? The vested interest of brokerage firms in a stock they cover often results in a strong positive bias of their analysts in rating it. Our research shows that for every “Strong Sell” recommendation, brokerage firms assign five “Strong Buy” recommendations.
This means that the interests of these institutions are not always aligned with those of retail investors, giving little insight into the direction of a stock’s future price movement. It would therefore be best to use this information to validate your own analysis or a tool that has proven to be highly effective at predicting stock price movements.
With an impressive externally audited track record, our proprietary stock rating tool, the Zacks Rank, which classifies stocks into five groups, ranging from Zacks Rank #1 (Strong Buy) to Zacks Rank #5 (Strong Sell), is a reliable indicator of a stock’s near -term price performance. So, validating the Zacks Rank with ABR could go a long way in making a profitable investment decision.
ABR Should Not Be Confused With Zacks Rank
Although both Zacks Rank and ABR are displayed in a range of 1-5, they are different measures altogether.
Broker recommendations are the sole basis for calculating the ABR, which is typically displayed in decimals (such as 1.28). The Zacks Rank, on the other hand, is a quantitative model designed to harness the power of earnings estimate revisions. It is displayed in whole numbers — 1 to 5.
Analysts employed by brokerage firms have been and continue to be overly optimistic with their recommendations. Since the ratings issued by these analysts are more favorable than their research would support because of the vested interest of their employers, they mislead investors far more often than they guide.
In contrast, the Zacks Rank is driven by earnings estimate revisions. And near-term stock price movements are strongly correlated with trends in earnings estimate revisions, according to empirical research.
In addition, the different Zacks Rank grades are applied proportionately to all stocks for which brokerage analysts provide current-year earnings estimates. In other words, this tool always maintains a balance among its five ranks.
Another key difference between the ABR and Zacks Rank is freshness. The ABR is not necessarily up-to-date when you look at it. But, since brokerage analysts keep revising their earnings estimates to account for a company’s changing business trends, and their actions get reflected in the Zacks Rank quickly enough, it is always timely in indicating future price movements.
Should You Invest in ELF?
Looking at the earnings estimate revisions for e.l.f. Beauty, the Zacks Consensus Estimate for the current year has remained unchanged over the past month at $3.53.
Analysts’ steady views regarding the company’s earnings prospects, as indicated by an unchanged consensus estimate, could be a legitimate reason for the stock to perform in line with the broader market in the near term.
The size of the recent change in the consensus estimate, along with three other factors related to earnings estimates, has resulted in a Zacks Rank #3 (Hold) for e.l.f. Beauty.
It may therefore be prudent to be a little cautious with the Buy-equivalent ABR for e.l.f. Beauty.
© 2024 Benzinga.com. Benzinga does not provide investment advice. All rights reserved.
Billionaire investor David Einhorn says Warren Buffett's recent stock sales show just how overvalued the market is
-
The stock market is the most expensive it’s been in decades, the billionaire David Einhorn says.
-
His firm, Greenlight Capital, said Warren Buffett’s stock sales show now isn’t the time for high equity exposure.
-
Greenlight said even non-tech stocks were trading 30 to 50 times earnings.
Investors are fueling what looks like the most expensive stock market in decades, the billionaire investor David Einhorn wrote in his hedge fund’s quarterly letter. Just consider the fact that Warren Buffett is cashing out of the bull run, it said.
The Greenlight Capital letter said equities were the most overvalued since the firm’s founding in 1996.
Now is probably not a good time for high equity exposure, the fund added, citing Buffett’s stock sales to make this point.
“While Mr. Buffett routinely points out that it is impossible to time the market, we can’t help but observe that he has been one of the best market timers we have ever seen,” Greenlight said.
The famed Berkshire Hathaway investor has been slashing equity positions and electing to hold cash on the sidelines. By mid-August, Buffett had garnered a record cash pile of $189 billion, and he has since continued to take profits on successful stocks.
Though Greenlight didn’t interpret Buffett’s actions as a prediction of a coming crash, it noted that the “Oracle of Omaha” has a talent for reducing exposure at the right time. For instance, the letter said, Buffett closed his fund before the market became too frothy in the 1960s and sold off his holdings ahead of the 1987 crash.
“One could argue that sitting out bear markets has been the underappreciated reason for his outstanding long-term returns,” the letter said. “It is therefore noteworthy to observe that Mr. Buffett is again selling large swaths of his stock portfolio and building enormous cash reserves.”
Greenlight said these sales signaled it might be best for high equity exposure to be held off until a better opportunity emerges in the not-so-distant future.
That’s not to say the market is in a bubble, the firm said. It did note, however, that elevated price-to-earnings ratios are concerning despite cyclical highs in corporate earnings and that dividend yields are also low.
While other market observers have also noted the market’s expensiveness, Greenlight said the problem went beyond the “nosebleed valuations” of high-profile tech stocks. The letter said that even mature, industrial names exposed to cyclical and growth opportunities were trading 30 to 50 times earnings.
Greenlight is trading based on these concerns — it disclosed that it was conservatively positioned with “very low exposure to equity beta.” The fund reported a third-quarter return of 1.1%, compared with the S&P 500‘s 5.9% gains.
But the firm said it wasn’t an outright bear. Though it said it expected to continue underperforming the rising market for now, its investments in gold and Green Brick Partners were cited as its significant winners this quarter.
Read the original article on Business Insider
Calian continues to respond to growing demand for global defence solutions
OTTAWA, Ontario, Oct. 17, 2024 (GLOBE NEWSWIRE) — Calian Group Ltd. CGY, closed fiscal year 2024 ending September 30, having signed several defence contracts in the fourth quarter valued at approximately $29 million, further solidifying its position as a trusted partner in the global defence industry. These new contracts align with Calian’s mission to equip, prepare and protect military personnel as global military spending continues to surge amid war, geopolitical instability and the heightened need for new and advanced technologies.
Global defence budgets continue to rise and are projected to reach $2.5 trillion by 2028 according to Markets and Markets. Throughout FY2024, Calian continued to win contracts to support key global defence initiatives that enhance military readiness and operational effectiveness. Closing out Q4, Calian was selected to provide Canada and NATO members with operational and training support, defence manufacturing, engineering support and technical expertise.
“As the world faces continued unrest, Calian is more dedicated than ever to delivering cutting-edge defence solutions to ensure the preparedness and safety of Canadian, NATO and allied personnel,” said Kevin Ford, CEO, Calian. “Our recent contract signings reflect the growing trust our global partners place in Calian to support critical global defence initiatives. As we move into FY2025, we remain focused on helping our allies prepare for the complex challenges that lie ahead, equipping them with the tools and expertise needed to safeguard national and global security.”
In a 2024 McKinsey & Company report they indicated that following the invasion of Ukraine, NATO member states have announced plans to spend significantly more on defence in the coming years. It goes on to add that if actual spending stays in line with the latest announcements made by European governments, their analysis estimates that cumulative defence spending could increase by €700 billion to €800 billion between 2022 and 2028, with total European spending reaching as much as €500 billion per year in 2028. With Calian’s recent acquisition of U.K.’s Mabway, combined with its leadership in providing defence readiness expertise for NATO countries, Calian is uniquely positioned going into FY2025 to support these increasing demands.
With over 40 years of experience delivering defence solutions to Canada and its global allies, Calian provides a broad portfolio of services, including military training, simulation, healthcare, cybersecurity and complex systems integration. These recent Q4 contract signings reinforce Calian’s commitment to helping military forces remain ready and resilient in today’s fast-changing security environment.
Learn more about how Calian delivers confidence for military customers, no matter their needs: https://www.calian.com/defence/.
About Calian
www.calian.com
We keep the world moving forward. Calian® helps people communicate, innovate, learn and lead safe and healthy lives. Every day, our employees live our values of customer commitment, integrity, innovation, respect and teamwork to engineer reliable solutions that solve complex challenges. That’s Confidence. Engineered. A stable and growing 40-year company, we are headquartered in Ottawa with offices and projects spanning North American, European and international markets. Visit calian.com to learn about innovative healthcare, communications, learning and cybersecurity solutions.
Product or service names mentioned herein may be the trademarks of their respective owners.
Media inquiries:
media@calian.com
613-599-8600 x 2298
Investor Relations inquiries:
ir@calian.com
DISCLAIMER
Certain information included in this press release is forward-looking and is subject to important risks and uncertainties. The results or events predicted in these statements may differ materially from actual results or events. Such statements are generally accompanied by words such as “intend”, “anticipate”, “believe”, “estimate”, “expect” or similar statements. Factors which could cause results or events to differ from current expectations include, among other things: the impact of price competition; scarce number of qualified professionals; the impact of rapid technological and market change; loss of business or credit risk with major customers; technical risks on fixed price projects; general industry and market conditions and growth rates; international growth and global economic conditions, and including currency exchange rate fluctuations; and the impact of consolidations in the business services industry. For additional information with respect to certain of these and other factors, please see the Company’s most recent annual report and other reports filed by Calian with the Ontario Securities Commission. Calian disclaims any intention or obligation to update or revise any forward-looking statements, whether as a result of new information, future events or otherwise. No assurance can be given that actual results, performance or achievement expressed in, or implied by, forward-looking statements within this disclosure will occur, or if they do, that any benefits may be derived from them.
Calian · Head Office · 770 Palladium Drive · Ottawa · Ontario · Canada · K2V 1C8
Tel: 613.599.8600 · Fax: 613-592-3664 · General info email: info@calian.com

Market News and Data brought to you by Benzinga APIs
© 2024 Benzinga.com. Benzinga does not provide investment advice. All rights reserved.
PFO and PAO Of GameStop Sold $55K In Stock
Making a noteworthy insider sell on October 15, Daniel Moore, PFO and PAO at GameStop GME, is reported in the latest SEC filing.
What Happened: Moore opted to sell 2,624 shares of GameStop, according to a Form 4 filing with the U.S. Securities and Exchange Commission on Tuesday. The transaction’s total worth stands at $55,115.
GameStop‘s shares are actively trading at $21.29, experiencing a up of 0.09% during Wednesday’s morning session.
Delving into GameStop’s Background
GameStop Corp is a U.S. multichannel video game, consumer electronics, and services retailer. The company operates across Europe, Canada, Australia, and the United States. GameStop sells new and second-hand video game hardware, physical and digital video game software, and video game accessories, mainly through GameStop, EB Games, and Micromania stores and international e-commerce sites. The majority of sales are from the United States.
GameStop: Financial Performance Dissected
Decline in Revenue: Over the 3 months period, GameStop faced challenges, resulting in a decline of approximately -31.41% in revenue growth as of 31 July, 2024. This signifies a reduction in the company’s top-line earnings. As compared to its peers, the revenue growth lags behind its industry peers. The company achieved a growth rate lower than the average among peers in Consumer Discretionary sector.
Holistic Profitability Examination:
-
Gross Margin: With a low gross margin of 31.17%, the company exhibits below-average profitability, signaling potential struggles in cost efficiency compared to its industry peers.
-
Earnings per Share (EPS): GameStop’s EPS is below the industry average. The company faced challenges with a current EPS of 0.04. This suggests a potential decline in earnings.
Debt Management: GameStop’s debt-to-equity ratio is below the industry average at 0.12, reflecting a lower dependency on debt financing and a more conservative financial approach.
Assessing Valuation Metrics:
-
Price to Earnings (P/E) Ratio: GameStop’s stock is currently priced at a premium level, as reflected in the higher-than-average P/E ratio of 151.93.
-
Price to Sales (P/S) Ratio: With a higher-than-average P/S ratio of 1.52, GameStop’s stock is perceived as being overvalued in the market, particularly in relation to sales performance.
-
EV/EBITDA Analysis (Enterprise Value to its Earnings Before Interest, Taxes, Depreciation & Amortization): GameStop’s EV/EBITDA ratio, surpassing industry averages at 215.8, positions it with an above-average valuation in the market.
Market Capitalization: Indicating a reduced size compared to industry averages, the company’s market capitalization poses unique challenges.
Now trade stocks online commission free with Charles Schwab, a trusted and complete investment firm.
The Importance of Insider Transactions
In the complex landscape of investment decisions, investors should approach insider transactions as part of a comprehensive analysis, considering various elements.
In the context of legal matters, the term “insider” refers to any officer, director, or beneficial owner holding more than ten percent of a company’s equity securities, as outlined by Section 12 of the Securities Exchange Act of 1934. This includes executives in the c-suite and significant hedge funds. Such insiders are obligated to report their transactions through a Form 4 filing, which must be completed within two business days of the transaction.
Pointing towards optimism, a company insider’s new purchase signals their positive anticipation for the stock to rise.
Despite insider sells not always signaling a bearish sentiment, they can be driven by various factors.
A Deep Dive into Insider Transaction Codes
Delving into transactions, investors typically prioritize those unfolding in the open market, as precisely outlined in Table I of the Form 4 filing. A P in Box 3 indicates a purchase, while S signifies a sale. Transaction code C signals the conversion of an option, and transaction code A denotes a grant, award, or other acquisition of securities from the company.
Check Out The Full List Of GameStop’s Insider Trades.
Insider Buying Alert: Profit from C-Suite Moves
Benzinga Edge reveals every insider trade in real-time. Don’t miss the next big stock move driven by insider confidence. Unlock this ultimate sentiment indicator now. Click here for access.
This article was generated by Benzinga’s automated content engine and reviewed by an editor.
Market News and Data brought to you by Benzinga APIs
© 2024 Benzinga.com. Benzinga does not provide investment advice. All rights reserved.
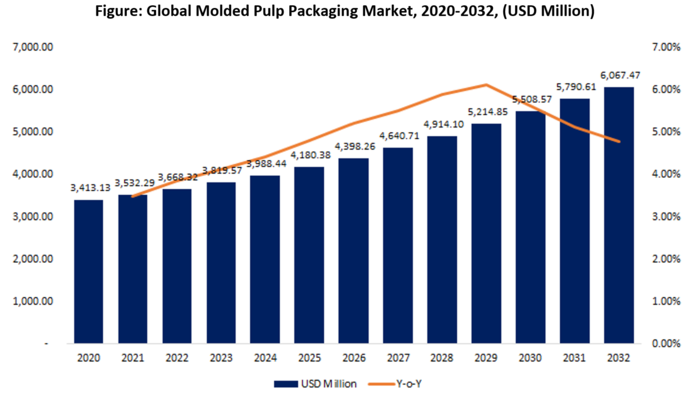
Global Molded Pulp Packaging Market to Reach USD 6,067.47 Million by 2032 | Eco-Friendly Solutions in Packaging Industry
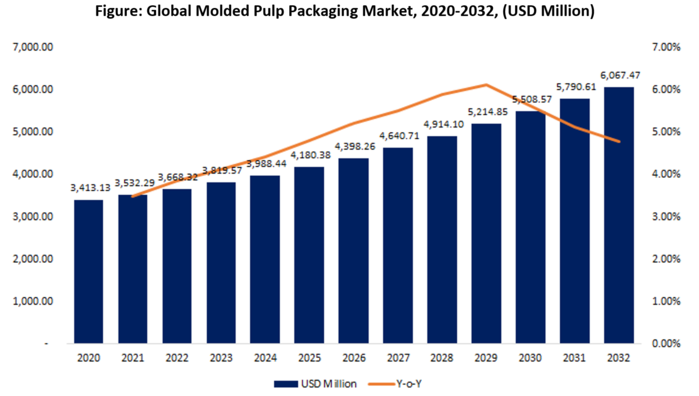
Gondia, India, Oct. 17, 2024 (GLOBE NEWSWIRE) — Latest research report published by IMIR Market Research, the market is majorly driven by rising demand for sustainable packaging solutions. Global Molded Pulp Packaging Market Size, Share & Trends Analysis Report by Molded Type (Thick Wall, Transfer Molded, Thermoformed Fiber, Processed Pulp), by Source (Wood pulp, Non wood pulp), by Product (Food, Trays, Clamshells, Cups, Plates, Bowls, Others), by End Use (Food Packaging, Food Service Disposables, Electronics, Healthcare, Industrial, Others) and Geography (North America, Europe, Asia-Pacific, Middle East and Africa, and South America). The report offers the value (in USD Billion) for the above segments.
Key Players and Competitor
A number of local and international players are making the market more competitive. There are over 8,000 large scale manufacturer for the molded pulp packaging across the globe. Some of the well-known international players are Molpack Corporation Ltd, YFY Jupiter, Pacific Pulp Molding, Best Plus Pulp Co, Enviropak, Hartmann, Smurfit Kappa, Western Pulp Products Company, Alta Global Inc, CMPC, Huhtamaki Ltd, Stora Enso, DS Smith,Sonoco Products Company. These companies are focused on product innovation and sustainability to capture larger market shares and meet evolving consumer preferences.
To get the Detailed Data and Market Buy Full Report Now: https://www.intellectualmarketinsights.com/checkout/IMI-001345?currency=2
Being produced from recycled paper and other natural fibers the global molded pulp packaging market is expected to gain huge demand in near future. Rising concern about the plastic waste products, led to gaining the momentum for the preferred alternative to plastic and other non- biodegradable materials will drive the market growth. Government regulations and increasing awareness will fuel the molded pulp packaging market growth.
Innovation is the key to success, thus a number of manufacturers are involved in enhancing the flexibility, durability, and water resistant property of the material creating a new opportunity for other sectors apart from food. Customized packaging solution for the premium products especially in industries such as cosmetics and personal care will open new opportunities. Continuous expansion of the e-commerce, need for sustainable, protective, and recyclable packaging solutions is surging across the developing countries in Asia Pacific and Latin America will attract the investments owing to the presence of huge untapped market.
The global molded pulp packaging market is segmented on the basis of raw material, molded type, source, product and application.
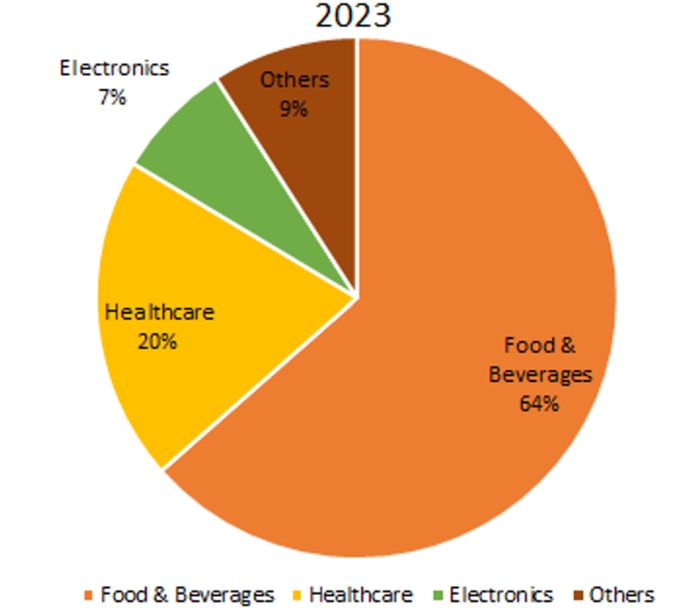
On the basis of application, the global molded pulp packaging market is segmented into food & beverages, healthcare, electronics, and others. Food & beverages accounts for the major share in the market and is expected to remain largest segment by 2032. Companies are increasingly adopting molded pulp for packaging eggs, fruits, trays, and beverage carriers due to its biodegradability and protective characteristics.
Get a Sample PDF Brochure: https://www.intellectualmarketinsights.com/download-sample/IMI-001345
As per the findings of IMIR Market Research, Asia Pacific dominates the global molded pulp packaging market coupled with the fastest growth during the forecast period of 2024-2032. Presence of Developing economies like India, China, and South East Asian countries have boosted the demand for the molded pulp packaging solutions. According to the China National Resources Recycling Association, Europe and North America product 19% and 18% of the plastic waste respectively. Whereas, in 2020, China alone product over 60 million tonnes plastic waste where, only 16 million tonnes are recycled which has led to increase the concern regarding the waste management. Continuously rising population, rising plastic waste concern and increasing demand from food sector has driven the molded pulp packaging market in Asia Pacific.
North America and Europe are focusing on investments in order to minimize the manufacturing cost of the products. High awareness, stringent regulations, spending capacity, and adoption of the products will drive the market in this region.
To understand the Detailed Country and Regional Market Trend, Visit: https://www.intellectualmarketinsights.com/methodologies/IMI-001345
Market Segmentations
- By Raw Material
- Recycled Paper
- Virgin Pulp
- Hybrid Pulp
- By Molded Type
- Thick Wall
- Transfer Molded
- Thermoformed Fiber
- Processed Pulp
- By Source
- By Product
- Food Trays
- Clamshells
- Cups and Plates
- Bowls
- Others
- By Application
- Food & Beverages
- Healthcare
- Electronics
- Others
What is included in the report?
- Our in-depth market research study on global molded pulp packaging market includes:
- Data for over 20 country covering current and historical supply-demand assessment wherein market value and volume will be represented in USD Mn and Tonnes respectively
- Market Opportunities, Drivers, Restraint, and Trends across different regions
- Raw Material Analysis, Value Chain Analysis, Pricing Analysis, and Untapped Revenue Opportunity Analysis
- Competitive Landscape including Market Share Analysis, Company Profiling, Product Heat Map Analysis, Key Winning Strategies and others
- List of Buyers for Each Application Segments (Including Name, Email Address, Contact Details, Website)
- List of Raw Material Suppliers (Including Name, Email Address, Contact Details, Website)
- Detailed Data on Manufacturing Technology and Cost Structure Analysis along with the list of the regional machinery suppliers
- Macroeconomic Indicators, Microeconomic Indicators, Future Growth Prospects, Supply Chain Analysis, and many more
North America
Europe
- Switzerland
- Belgium
- Germany
- France
- U.K.
- Italy
- Spain
- Sweden
- Netherland
- Turkey
- Rest of Europe
Asia-Pacific
- India
- Australia
- Philippines
- Singapore
- South Korea
- Japan
- China
- Malaysia
- Thailand
- Indonesia
- Rest Of APAC
Latin America
- Mexico
- Argentina
- Peru
- Colombia
- Brazil
- Rest of South America
Middle East and Africa
- Saudi Arabia
- UAE
- Egypt
- South Africa
- Rest Of MEA
Access the Full Report: https://www.intellectualmarketinsights.com/report/molded-pulp-packaging-market-size-and-trends/imi-001345
About Us IMIR Market Research Pvt Ltd.
Website: https://www.intellectualmarketinsights.com/
IMIR Market Research is a market intelligence and consulting organization that provides syndicated research reports, customized research reports, and consulting services. We are known for our actionable insights and authentic reports in various domains including, Semiconductor, aerospace, Automation, Agriculture, Food & Beverages, Automotive, Chemicals and Materials, and virtually all domains and an exhaustive list of sub-domains under the sun. We create value for clients through our highly reliable and accurate reports.
IMIR has the distinguished objective of providing optimal quality research and granular research to clients. Our market research studies by products, services, technologies, applications, end users, and market players for regional, and country level market segments, enable our clients to see more, know more, and do more, which help answer your most important questions.
Contact us:
Follow Us: LinkedIn
Email: sales@intellectualmarketinsights.com
Call us: +1 (814) 487 8486

Contact Data
Managing Director: Digvijay Chakravarty |
Email: digvijay.c@intellectualmarketinsights.com
Call us: +1 (814) 487 8486, +919764079503
© 2024 Benzinga.com. Benzinga does not provide investment advice. All rights reserved.
Earnings Preview: Regions Finl
Regions Finl RF is preparing to release its quarterly earnings on Friday, 2024-10-18. Here’s a brief overview of what investors should keep in mind before the announcement.
Analysts expect Regions Finl to report an earnings per share (EPS) of $0.53.
The announcement from Regions Finl is eagerly anticipated, with investors seeking news of surpassing estimates and favorable guidance for the next quarter.
It’s worth noting for new investors that guidance can be a key determinant of stock price movements.
Overview of Past Earnings
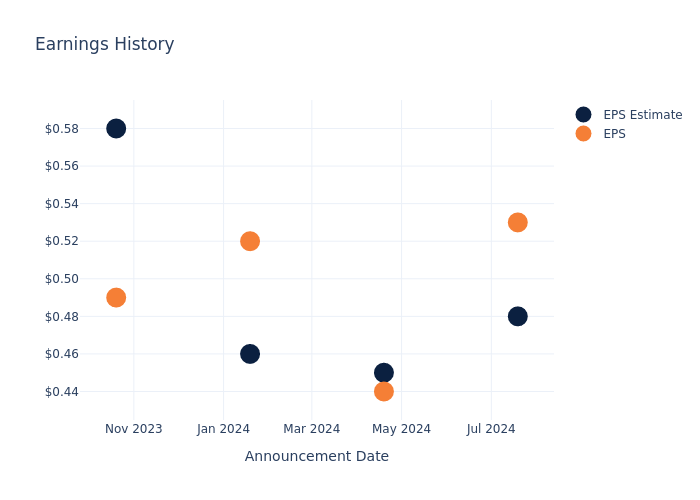
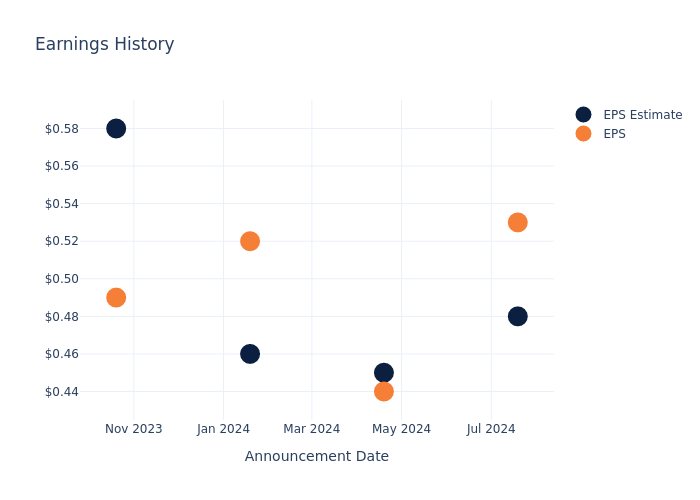
In the previous earnings release, the company beat EPS by $0.05, leading to a 0.0% drop in the share price the following trading session.
Here’s a look at Regions Finl’s past performance and the resulting price change:
| Quarter | Q2 2024 | Q1 2024 | Q4 2023 | Q3 2023 |
|---|---|---|---|---|
| EPS Estimate | 0.48 | 0.45 | 0.46 | 0.58 |
| EPS Actual | 0.53 | 0.44 | 0.52 | 0.49 |
| Price Change % | 0.0% | -1.0% | 4.0% | -12.0% |
Performance of Regions Finl Shares
Shares of Regions Finl were trading at $23.98 as of October 16. Over the last 52-week period, shares are up 67.56%. Given that these returns are generally positive, long-term shareholders are likely bullish going into this earnings release.
To track all earnings releases for Regions Finl visit their earnings calendar on our site.
This article was generated by Benzinga’s automated content engine and reviewed by an editor.
Market News and Data brought to you by Benzinga APIs
© 2024 Benzinga.com. Benzinga does not provide investment advice. All rights reserved.
Abbott's Growth and Dividends Make It a Smart Portfolio Pick
There are many reasons to own Abbott Laboratories ABT, but they all boil down to one thing: consistent market-beating returns. A study published by Hendrik Bessembinder, a professor of finance at Arizona State University, found that Abbott is the 11th top-returning stock since 1937 and #1 among healthcare names.
The critical takeaways from the report are time and consistency: the top performers produce slower annual growth than flash-in-the-pan growth stories but do it year in and year out, compounding value over the long term. Value is driven by company growth, cash flow, and capital returns, which, in Abbott’s case, include dividends and share repurchases. Abbott stock can also help reduce portfolio risk because its low beta is about 0.7x the S&P 500.
High-Quality Abbott Stock: Corporate Growth That Pays You to Own It
Abbott Laboratories had a solid Q3, reporting 4.9% growth to outpace the consensus forecast despite the impact of lower COVID-related sales and discontinued business. Organically, ongoing business grew by 8.2% due to strength in the medical device segment. Medical Devices grew by 11.7% reported and 13.3% organic due to a double-digit increase in Structural Heart and Heart Failure and the release of continuous glucose monitors, showing the strength of the diversified portfolio.
Regarding the remaining segments, established Pharmaceuticals grew by 2.7% on a reported basis and 7% organically, offset by reported declines in Nutrition and Diagnostics. Nutrition contracted by 0.3% as reported but grew by 3.4% organically, while Diagnostics declined by 1.3% on a reported basis but grew by 1.4% organically.
Margin news is also solid, sustaining the outlook for balance sheet health and capital returns. The company’s operating and net margin widened slightly compared to the previous year, driving earnings leverage. The operating and net operating earnings are up 12.8% and 14.6%, leaving the adjusted fully diluted EPS at $1.21 or up 6%, with margins forecasted to remain stable in Q4.
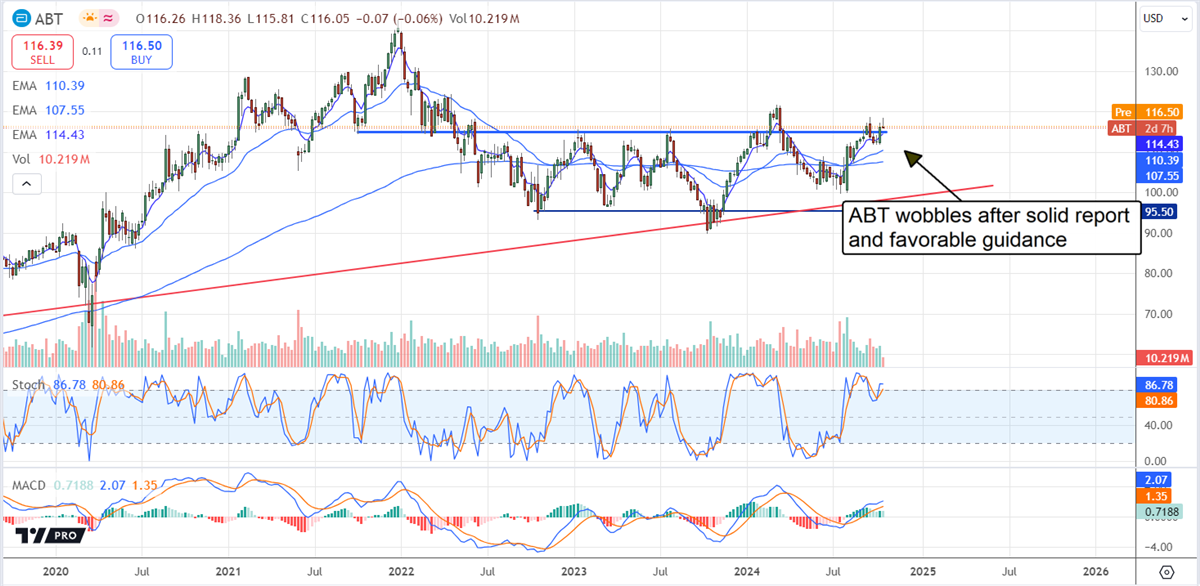
Abbott’s guidance is favorable in that revenue targets were reaffirmed, and the mid-point for earnings was raised. The company expects full-year earnings in a range centering on $4.67 versus the $4.66 consensus, which should keep the analysts happy and support the uptrend in share prices.
Abbott Laboratories Capital Return Grows Safely, Drives Value for Shareholders
Abbott Laboratories’ capital return is safe and reliable, with a 53-year history of sustained annual increases and a low payout ratio below 50%. The balance sheet is a fortress with no red flags, leaving ample cash flow for R&D, reinvestment, acquisitional cash flow, and share repurchases. Repurchase activity isn’t robust but sufficient to offset dilutive forces and reduce the count annually. Highlights from Q3 include a 0.05% YTD share count reduction and a freshly amended repurchase authorization worth $7 billion or about 3.5% of the market cap before the release.
Analysts’ support for Abbott is strong. The trend in calendar Q3 is increasing coverage, improving sentiment, and upward price target revisions. The consensus is a Moderate Buy verging on a Strong Buy with a price target of $125, about 10% above the post-release opening price. The freshest revisions lead to the high-end range, another 10% to 15% above the consensus target, and a new all-time high when reached.
Abbott Slips Into a Buying Opportunity
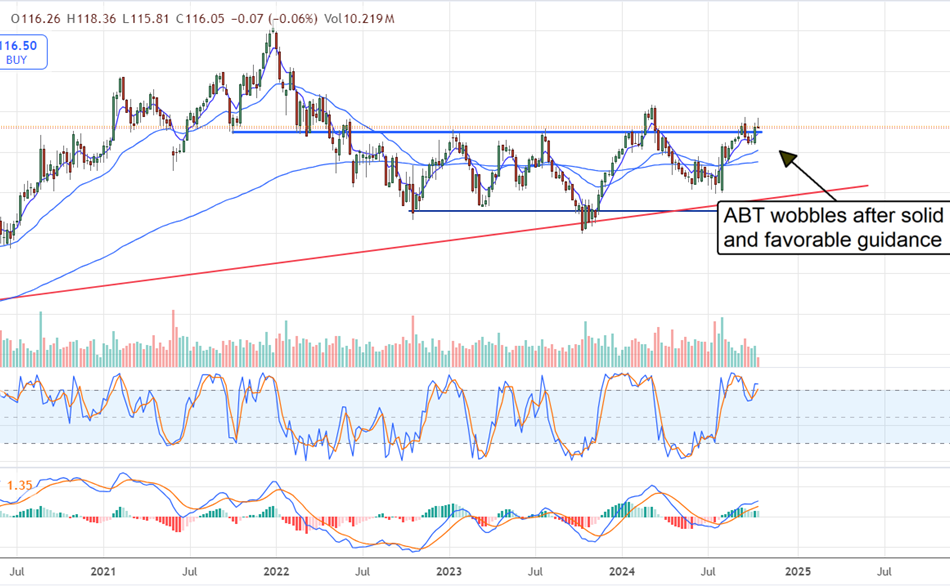
The price action following the release was tepid, with share prices pulling back slightly. However, analysts and institutions support the market well, so the pullback should result in a buying signal soon. The critical support target is near $115 and will likely be tested. If the market can sustain support above that level, a move to fresh highs is likely before the year’s end. If not, Abbott Laboratories’ share price may remain range-bound until more is available.
The article “Abbott’s Growth and Dividends Make It a Smart Portfolio Pick” first appeared on MarketBeat.
Market News and Data brought to you by Benzinga APIs
© 2024 Benzinga.com. Benzinga does not provide investment advice. All rights reserved.
Asset Performance Management Market to Grow at USD 6.17 Billion by 2031| SkyQuest Technology
Westford, US, Oct. 17, 2024 (GLOBE NEWSWIRE) — The global asset performance management market size was valued at $2.90 Billion in 2023 and expected to reach $6.17 Billion by 2031, growing at a CAGR of 9.9% from 2024 to 2031. The market is expected to grow significantly during the forecast period due to the rising demand for digital solutions across industries, such as oil & gas, manufacturing and chemicals, and others to curb operational expenses. APM system helps collect all forms of data from all forms of assets, such as machinery, heavy equipment and so on using sensors. The APM system, with the help of its data analysis software, interchanges between any facilities data.
An analytics platform is created for customers to best demonstrate all operational assets. They help by keeping all this information out to users, allowing them to streamline asset management processes and analyze which assets require priority maintenance. The APM system uses mobile solutions and geographic information system solutions among others, which are enabling few efficient use cases of the APM systems that drive the market. Another biggest driver is that APM systems in the market leverage industrial internet of things which provide equipment reliability as the fundamental capabilities of the APM systems. This is increasingly attracting the industrial sectors.
Request Sample of the Report: https://www.skyquestt.com/sample-request/asset-performance-management-market
Browse in-depth TOC on the “Asset Performance Management Market” Pages – 197, Tables – 95, Figures – 76
Asset Performance Management Market Overview:
| Report Coverage | Details |
| Market Revenue in 2023 | $2.90 Billion |
| Estimated Value by 2031 | $6.17 Billion |
| Growth Rate | Poised to grow at a CAGR of 9.9 % |
| Forecast Period | 2024–2031 |
| Forecast Units | Value (USD Billion) |
| Report Coverage | Revenue Forecast, Competitive Landscape, Growth Factors, and Trends |
| Segments Covered | Component, Industry Vertical, Deployment Mode, and Region |
| Geographies Covered | North America, Europe, Asia-Pacific, and the Rest of the world |
| Report Highlights | Growing demand for IIoT to improve productivity |
| Key Market Opportunities | Increasing priority of predictive maintenance |
| Key Market Drivers | Increasing adoption of asset management software |
Get Customized Reports with your Requirements, Free – https://www.skyquestt.com/speak-with-analyst/asset-performance-management-market
Increasing Adoption of Asset Management Software to Improve Performance of Company Assets
It should be noted that the market is driven by the rapid uptake of asset management software and the increasing importance of asset tracking. Infrastructure support is essential for asset-intensive industries to ensure optimal performance of their asset base. Old tracking methods such as manual handling or incurring excel sheets are not capable of tracking the asset of a vast company. Besides, the asset tracking field is becoming more complex with the availability of higher industrial sensors, digital twin, and complex OT. In addition, with the growth of asset systems, such as mechanical and neural networks are being utilized for their automation. The systems use machine learning, statistical modeling tools, and algorithms to provide a comprehensive analysis of asset behavior, estimate labor safety and environment risks, and provide real-time insight. Furthermore, the hosted systems segment, especially public cloud offers huge benefits, such as the availability of abundant computing resources and the ability to scale up or down.
Growing Usage of Cloud-Based Asset Performance Management Services to Reduce Expenses of Asset Management
The market observes the increasing adoption of cloud-based asset performance management services. The use of cloud computing solutions to support the infrastructure has also become more popular among asset-intensive industries because of their flexibility and the reduction of costs. One of the applications of these solutions is the deployment of the digital twin technology. A digital twin is a 3D image of an asset that demonstrates its behavior, which is imitated through combined use of the asset’s sensors and industrial neural networks. Using machine learning algorithms and statistical modeling systems, risk-based inspection technologies may leverage efficiency of operational technology to decrease human labor safety and environmental risks. Furthermore, the hosted clouds systems segment provided by public clouds offer adequate computational resources to monitor asset performance and employ predictive maintenance in real-time. Cloud-based asset performance management systems guarantee immediate access to crucial data, which allows to track assets and the liquidity of reserves and make informed decisions.
Increasing Demand for Digital Transformation to Boost Market Growth in North America
Growing adoption of Industrial Internet of Things and rise in the use of Artificial Intelligence and other smart connected devices are the two factors driving the growth of North America asset performance management market. Additionally, the region increased its IT budget as there has been a rising demand for digital transformation from a lot of end users and developers in the convergence of different technologies, such as cloud computing and artificial intelligence. Also, the IT budget increased due to an increasing need to control heavy machinery because higher production has been happening in the industry.
Is this report aligned with your requirements? Interested in making a Purchase – https://www.skyquestt.com/buy-now/asset-performance-management-market
Asset Performance Management Market Insights
Driver
- Increasing popularity of asset management to monitor assets of companies
- Growing investments in asset management software by market leaders
- Increasing necessity to increase the economic returns on assets
Restraints
- Lack of understanding while choosing appropriate asset solutions
- Lack of skill among employees
- Increasing concern over data security and confidentiality
Key Players Operating in Asset Performance Management Market
- AVEVA (UK)
- SAP (Germany)
- GE Digital (US)
- IBM (US)
- ABB (Switzerland)
- Emerson (US)
- Bentley Systems (US)
- Rockwell Automation (US)
- Fluke (US)
- DNV (Norway)
- Siemens Energy (Germany)
Key Questions Answered in Asset Performance Management Market
- Which is the main factor driving the market?
- Who are the key players in the market?
- Which is the dominating region in the market?
Related Reports:
Armenia Stock Market: Global Opportunity Analysis and Forecast, 2024-2031
P2P Payment Market: Global Opportunity Analysis and Forecast, 2024-2031
Commercial Auto Insurance Market: Global Opportunity Analysis and Forecast, 2024-2031
Digital Insurance Platform Market: Global Opportunity Analysis and Forecast, 2024-2031
Digital Gift Card Market: Global Opportunity Analysis and Forecast, 2024-2031
About Us:
SkyQuest is an IP focused Research and Investment Bank and Accelerator of Technology and assets. We provide access to technologies, markets and finance across sectors viz. Life Sciences, CleanTech, AgriTech, NanoTech and Information & Communication Technology.
We work closely with innovators, inventors, innovation seekers, entrepreneurs, companies and investors alike in leveraging external sources of R&D. Moreover, we help them in optimizing the economic potential of their intellectual assets. Our experiences with innovation management and commercialization have expanded our reach across North America, Europe, ASEAN and Asia Pacific.
Contact:
Mr. Jagraj Singh
SkyQuest Technology
1 Apache Way,
Westford,
Massachusetts 01886
USA (+1) 351-333-4748
Email: sales@skyquestt.com
Visit Our Website: https://www.skyquestt.com/

© 2024 Benzinga.com. Benzinga does not provide investment advice. All rights reserved.

