Earnings Outlook For WD-40
WD-40 WDFC will release its quarterly earnings report on Thursday, 2024-10-17. Here’s a brief overview for investors ahead of the announcement.
Analysts anticipate WD-40 to report an earnings per share (EPS) of $1.34.
The announcement from WD-40 is eagerly anticipated, with investors seeking news of surpassing estimates and favorable guidance for the next quarter.
It’s worth noting for new investors that guidance can be a key determinant of stock price movements.
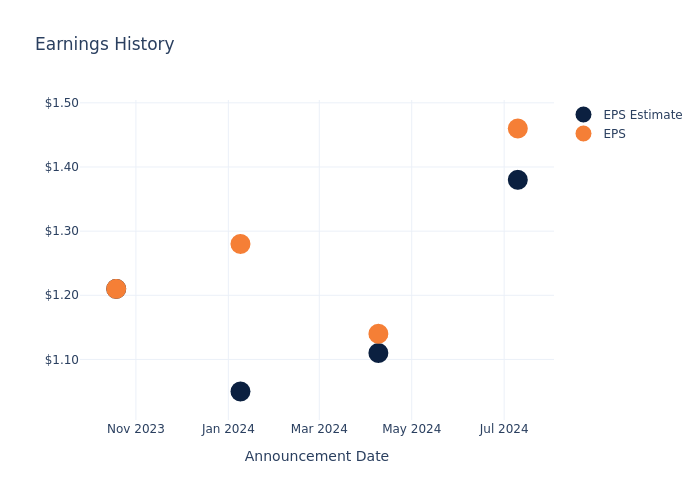
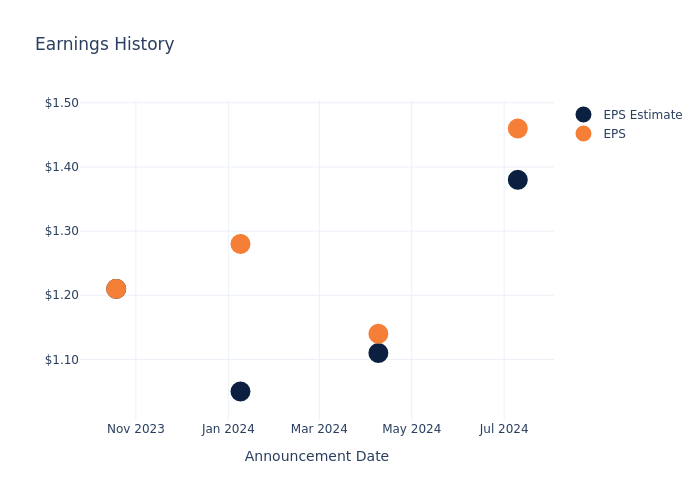
Earnings History Snapshot
In the previous earnings release, the company beat EPS by $0.08, leading to a 4.04% increase in the share price the following trading session.
Here’s a look at WD-40’s past performance and the resulting price change:
| Quarter | Q3 2024 | Q2 2024 | Q1 2024 | Q4 2023 |
|---|---|---|---|---|
| EPS Estimate | 1.38 | 1.11 | 1.05 | 1.21 |
| EPS Actual | 1.46 | 1.14 | 1.28 | 1.21 |
| Price Change % | 4.0% | -9.0% | 15.0% | -0.0% |
Market Performance of WD-40’s Stock
Shares of WD-40 were trading at $260.85 as of October 15. Over the last 52-week period, shares are up 29.56%. Given that these returns are generally positive, long-term shareholders are likely bullish going into this earnings release.
To track all earnings releases for WD-40 visit their earnings calendar on our site.
This article was generated by Benzinga’s automated content engine and reviewed by an editor.
Market News and Data brought to you by Benzinga APIs
© 2024 Benzinga.com. Benzinga does not provide investment advice. All rights reserved.
Vertex 10% Owner Trades Company's Stock
It was reported on October 15, that ITEM SECOND IRR TRUST FBO ANNE MARIE WESTPHAL ua of JEFFREY R WESTPHAL dated October , 10% Owner at Vertex VERX executed a significant insider sell, according to an SEC filing.
What Happened: According to a Form 4 filing with the U.S. Securities and Exchange Commission on Tuesday, sold 75,175 shares of Vertex. The total transaction value is $3,018,885.
As of Wednesday morning, Vertex shares are up by 0.41%, currently priced at $41.43.
All You Need to Know About Vertex
Vertex Inc is a provider of tax technology and services. Its software, content, and services help customers stay in compliance with indirect taxes that occur in taxing jurisdictions all over the world. Vertex provides cloud-based and on-premise solutions to specific industries for every line of tax, including income, sales, consumer use, value-added, and payroll. The company offers solutions such as tax determination, Tax Data Management, document management, and compliance and reporting among others. The company derives revenue from software subscriptions.
Financial Insights: Vertex
Revenue Growth: Vertex’s revenue growth over a period of 3 months has been noteworthy. As of 30 June, 2024, the company achieved a revenue growth rate of approximately 15.33%. This indicates a substantial increase in the company’s top-line earnings. As compared to competitors, the company encountered difficulties, with a growth rate lower than the average among peers in the Information Technology sector.
Evaluating Earnings Performance:
-
Gross Margin: Achieving a high gross margin of 63.74%, the company performs well in terms of cost management and profitability within its sector.
-
Earnings per Share (EPS): Vertex’s EPS reflects a decline, falling below the industry average with a current EPS of 0.03.
Debt Management: Vertex’s debt-to-equity ratio stands notably higher than the industry average, reaching 1.51. This indicates a heavier reliance on borrowed funds, raising concerns about financial leverage.
Financial Valuation:
-
Price to Earnings (P/E) Ratio: Vertex’s stock is currently priced at a premium level, as reflected in the higher-than-average P/E ratio of 317.23.
-
Price to Sales (P/S) Ratio: The current P/S ratio of 10.47 is above industry norms, reflecting an elevated valuation for Vertex’s stock and potential overvaluation based on sales performance.
-
EV/EBITDA Analysis (Enterprise Value to its Earnings Before Interest, Taxes, Depreciation & Amortization): Vertex’s EV/EBITDA ratio, surpassing industry averages at 76.18, positions it with an above-average valuation in the market.
Market Capitalization Analysis: The company’s market capitalization surpasses industry averages, showcasing a dominant size relative to peers and suggesting a strong market position.
Now trade stocks online commission free with Charles Schwab, a trusted and complete investment firm.
Navigating the Impact of Insider Transactions on Investments
Insider transactions shouldn’t be used primarily to make an investing decision, however, they can be an important factor for an investor to consider.
When discussing legal matters, the term “insider” refers to any officer, director, or beneficial owner holding more than ten percent of a company’s equity securities, as stipulated in Section 12 of the Securities Exchange Act of 1934. This includes executives in the c-suite and significant hedge funds. Such insiders are required to report their transactions through a Form 4 filing, which must be completed within two business days of the transaction.
A new purchase by a company insider is a indication that they anticipate the stock will rise.
On the other hand, insider sells may not necessarily indicate a bearish view and can be motivated by various factors.
Unlocking the Meaning of Transaction Codes
For investors, a primary focus lies on transactions occurring in the open market, as indicated in Table I of the Form 4 filing. A P in Box 3 denotes a purchase, while S signifies a sale. Transaction code C signals the conversion of an option, and transaction code A denotes a grant, award, or other acquisition of securities from the company.
Check Out The Full List Of Vertex’s Insider Trades.
Insider Buying Alert: Profit from C-Suite Moves
Benzinga Edge reveals every insider trade in real-time. Don’t miss the next big stock move driven by insider confidence. Unlock this ultimate sentiment indicator now. Click here for access.
This article was generated by Benzinga’s automated content engine and reviewed by an editor.
Market News and Data brought to you by Benzinga APIs
© 2024 Benzinga.com. Benzinga does not provide investment advice. All rights reserved.
3 Tenacious Stocks That Could Make You a Millionaire
There are many ways to make a million dollars in the stock market, but one method is more reliable than the rest.
History shows that patient investors can build a million-dollar portfolio with the help of modest annual returns over a long time. This is a good description of master investor Warren Buffett’s strategy, and an even better fit for index fund legend John Bogle. So if you’re looking for a million-dollar investment idea, you should really search for companies and stocks that can stay relevant and financially healthy for decades to come.
On that note, I’d like to introduce you to three tenacious stocks that can carry that heavy weight. Amazon (NASDAQ: AMZN), International Business Machines (NYSE: IBM), and Buffett’s Berkshire Hathaway (NYSE: BRK.A) (NYSE: BRK.B) should at least match the stock market’s average returns for the foreseeable future. Making steady investments in these robust stocks could make you a millionaire over time.
The secret sauce of durable winners
The most important quality in long-term business empires is flexibility. My three picks are very different examples of this trait:
-
IBM has been around for more than a hundred years. What started as a maker of punch-card calculators evolved into a mainframe computing powerhouse and a PC systems pioneer. Now, IBM is leaning into the big-ticket opportunities of cloud computing and artificial intelligence (AI) services.
-
Berkshire was once a large manufacturer of fabrics. Buffett liquidated its textile mills to finance takeovers in various fields. Today, it’s a giant of the insurance, manufacturing, transportation, and consumer goods industries with deep interests in other areas. iPhone maker Apple (NASDAQ: AAPL) has been Berkshire’s largest holding since 2018.
-
Amazon started as a pure online bookseller, managed in founder Jeff Bezos’ garage. The company added more products to its catalog until it became synonymous with the concept of e-commerce in North America. Amazon is expanding its operations around the world, adding a world-class shipping network and a massive cloud computing system along the way, and always hunting for the next big idea.
These companies are always ready to change with the times. You will often find them in the vanguard of the next marketwide sea change. That’s exactly what I want to see in my long-term investments.
Smart ways to invest like a future millionaire
Past performance is no guarantee of future results, but these three companies have proven their ability to stay ahead of the times.
Berkshire has built a cross-sector conglomerate for the ages, managed by some of the world’s best business minds. Big Blue is turning decades of AI research into a terrific near-term growth driver, surely to be followed by another unexpected strategy shift that will be helpful in the 2040s and beyond. Amazon has been around for 30 years but is still acting like a hungry little upstart with tons of unexplored markets and business ideas.
You can pick any combination of these stocks to power a diversified investment portfolio in the long run. Getting started with a robust investment today is a good start, but you’ll do even better if you commit to building on that investment for years to come. With a dollar-cost averaging strategy, you can buy more shares when they’re cheap and fewer when they’re not, averaging out market volatility along the way. Automating the process with weekly, monthly, or annual stock buys can help you stay on track.
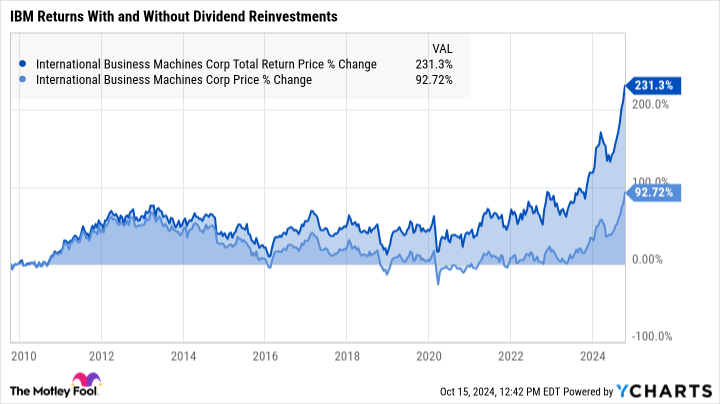
And don’t forget to enable a dividend reinvestment program (DRIP) for IBM, where the generous dividend payments make a big difference to your long-term returns:
There you have it: IBM, Berkshire Hathaway, and Amazon can help you make a millionaire over the next few decades. They may not get the job done quickly, but truly wealth-building investments always take time. You’ll follow in the footsteps of Bogle, Buffett, and many other investing geniuses. They should always be a part of a diversified portfolio, but these ultra-flexible companies are almost single-ticker index funds on their own.
Should you invest $1,000 in Amazon right now?
Before you buy stock in Amazon, consider this:
The Motley Fool Stock Advisor analyst team just identified what they believe are the 10 best stocks for investors to buy now… and Amazon wasn’t one of them. The 10 stocks that made the cut could produce monster returns in the coming years.
Consider when Nvidia made this list on April 15, 2005… if you invested $1,000 at the time of our recommendation, you’d have $806,459!*
Stock Advisor provides investors with an easy-to-follow blueprint for success, including guidance on building a portfolio, regular updates from analysts, and two new stock picks each month. The Stock Advisor service has more than quadrupled the return of S&P 500 since 2002*.
*Stock Advisor returns as of October 14, 2024
John Mackey, former CEO of Whole Foods Market, an Amazon subsidiary, is a member of The Motley Fool’s board of directors. Anders Bylund has positions in Amazon and International Business Machines. The Motley Fool has positions in and recommends Amazon, Apple, and Berkshire Hathaway. The Motley Fool recommends International Business Machines. The Motley Fool has a disclosure policy.
3 Tenacious Stocks That Could Make You a Millionaire was originally published by The Motley Fool
Options Exercise: STEPHEN WARD JR At Carpenter Tech Realizes $283K
A substantial insider activity was disclosed on October 15, as JR, Director at Carpenter Tech CRS, reported the exercise of a large sell of company stock options.
What Happened: A Form 4 filing with the U.S. Securities and Exchange Commission on Tuesday revealed that JR, Director at Carpenter Tech in the Materials sector, exercised stock options for 2,445 shares of CRS stock. The exercise price of the options was $42.81 per share.
The latest update on Wednesday morning shows Carpenter Tech shares up by 1.61%, trading at $158.69. At this price, JR’s 2,445 shares are worth $283,326.
Delving into Carpenter Tech’s Background
Carpenter Technology Corp supplies specialty metals to a variety of end markets, including aerospace and defense, industrial machinery and consumer durables, medical, and energy, among others. The company’s reportable segments include; Specialty Alloys Operations and Performance Engineered Products. It generates maximum revenue from the Specialty Alloys Operations segment. The SAO segment is comprised of the company’s alloy and stainless steel manufacturing operations. This includes operations performed at mills predominantly in Reading and Latrobe, Pennsylvania, and surrounding areas as well as South Carolina and Alabama. Geographically, the company derives its maximum revenue from the United States and the rest from Europe, Asia Pacific, Mexico, Canada, and other regions.
Carpenter Tech’s Financial Performance
Revenue Growth: Over the 3 months period, Carpenter Tech showcased positive performance, achieving a revenue growth rate of 5.33% as of 30 June, 2024. This reflects a substantial increase in the company’s top-line earnings. When compared to others in the Materials sector, the company excelled with a growth rate higher than the average among peers.
Profitability Metrics:
-
Gross Margin: Achieving a high gross margin of 23.87%, the company performs well in terms of cost management and profitability within its sector.
-
Earnings per Share (EPS): Carpenter Tech’s EPS reflects a decline, falling below the industry average with a current EPS of 1.87.
Debt Management: With a high debt-to-equity ratio of 0.43, Carpenter Tech faces challenges in effectively managing its debt levels, indicating potential financial strain.
Insights into Valuation Metrics:
-
Price to Earnings (P/E) Ratio: A higher-than-average P/E ratio of 42.21 suggests caution, as the stock may be overvalued in the eyes of investors.
-
Price to Sales (P/S) Ratio: A higher-than-average P/S ratio of 2.85 suggests overvaluation in the eyes of investors, considering sales performance.
-
EV/EBITDA Analysis (Enterprise Value to its Earnings Before Interest, Taxes, Depreciation & Amortization): The company’s EV/EBITDA ratio 20.18 is above the industry average, suggesting that the market values the company more highly for each unit of EBITDA. This could be attributed to factors such as strong growth prospects or superior operational efficiency.
Market Capitalization Analysis: The company exhibits a lower market capitalization profile, positioning itself below industry averages. This suggests a smaller scale relative to peers.
Now trade stocks online commission free with Charles Schwab, a trusted and complete investment firm.
Why Insider Activity Matters in Finance
Emphasizing the importance of a comprehensive approach, considering insider transactions is valuable, but it’s crucial to evaluate them in conjunction with other investment factors.
In legal terms, an “insider” refers to any officer, director, or beneficial owner of more than ten percent of a company’s equity securities registered under Section 12 of the Securities Exchange Act of 1934. This can include executives in the c-suite and large hedge funds. These insiders are required to let the public know of their transactions via a Form 4 filing, which must be filed within two business days of the transaction.
When a company insider makes a new purchase, that is an indication that they expect the stock to rise.
Insider sells, on the other hand, can be made for a variety of reasons, and may not necessarily mean that the seller thinks the stock will go down.
Cracking Transaction Codes
Examining transactions, investors often concentrate on those unfolding in the open market, meticulously detailed in Table I of the Form 4 filing. A P in Box 3 denotes a purchase, while S signifies a sale. Transaction code C indicates the conversion of an option, and transaction code A denotes a grant, award, or other acquisition of securities from the company.
Check Out The Full List Of Carpenter Tech’s Insider Trades.
Insider Buying Alert: Profit from C-Suite Moves
Benzinga Edge reveals every insider trade in real-time. Don’t miss the next big stock move driven by insider confidence. Unlock this ultimate sentiment indicator now. Click here for access.
This article was generated by Benzinga’s automated content engine and reviewed by an editor.
© 2024 Benzinga.com. Benzinga does not provide investment advice. All rights reserved.
This Is What Whales Are Betting On CRH
Investors with a lot of money to spend have taken a bearish stance on CRH CRH.
And retail traders should know.
We noticed this today when the trades showed up on publicly available options history that we track here at Benzinga.
Whether these are institutions or just wealthy individuals, we don’t know. But when something this big happens with CRH, it often means somebody knows something is about to happen.
So how do we know what these investors just did?
Today, Benzinga‘s options scanner spotted 9 uncommon options trades for CRH.
This isn’t normal.
The overall sentiment of these big-money traders is split between 22% bullish and 55%, bearish.
Out of all of the special options we uncovered, 5 are puts, for a total amount of $433,208, and 4 are calls, for a total amount of $172,755.
What’s The Price Target?
Analyzing the Volume and Open Interest in these contracts, it seems that the big players have been eyeing a price window from $90.0 to $90.0 for CRH during the past quarter.
Volume & Open Interest Development
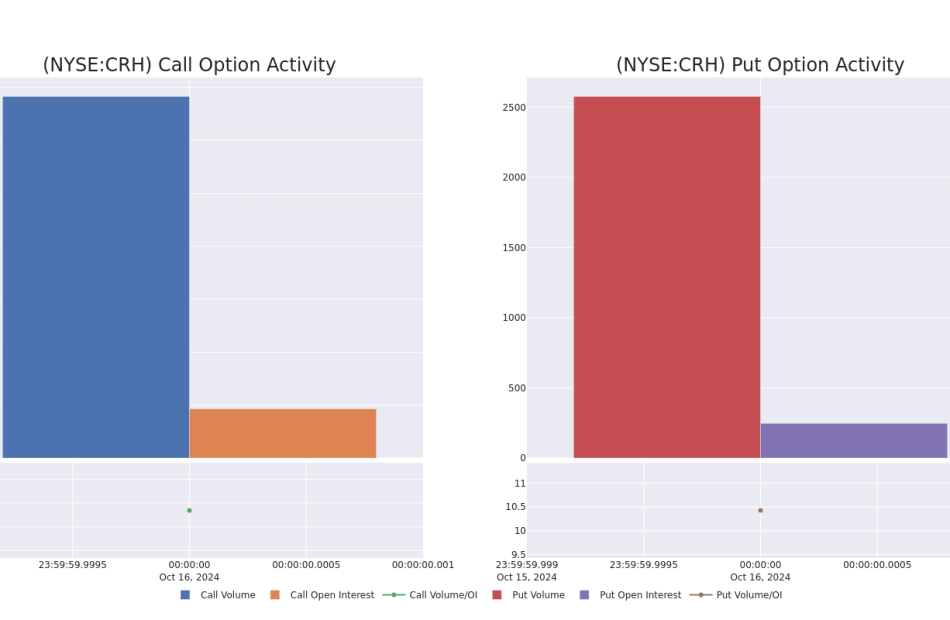
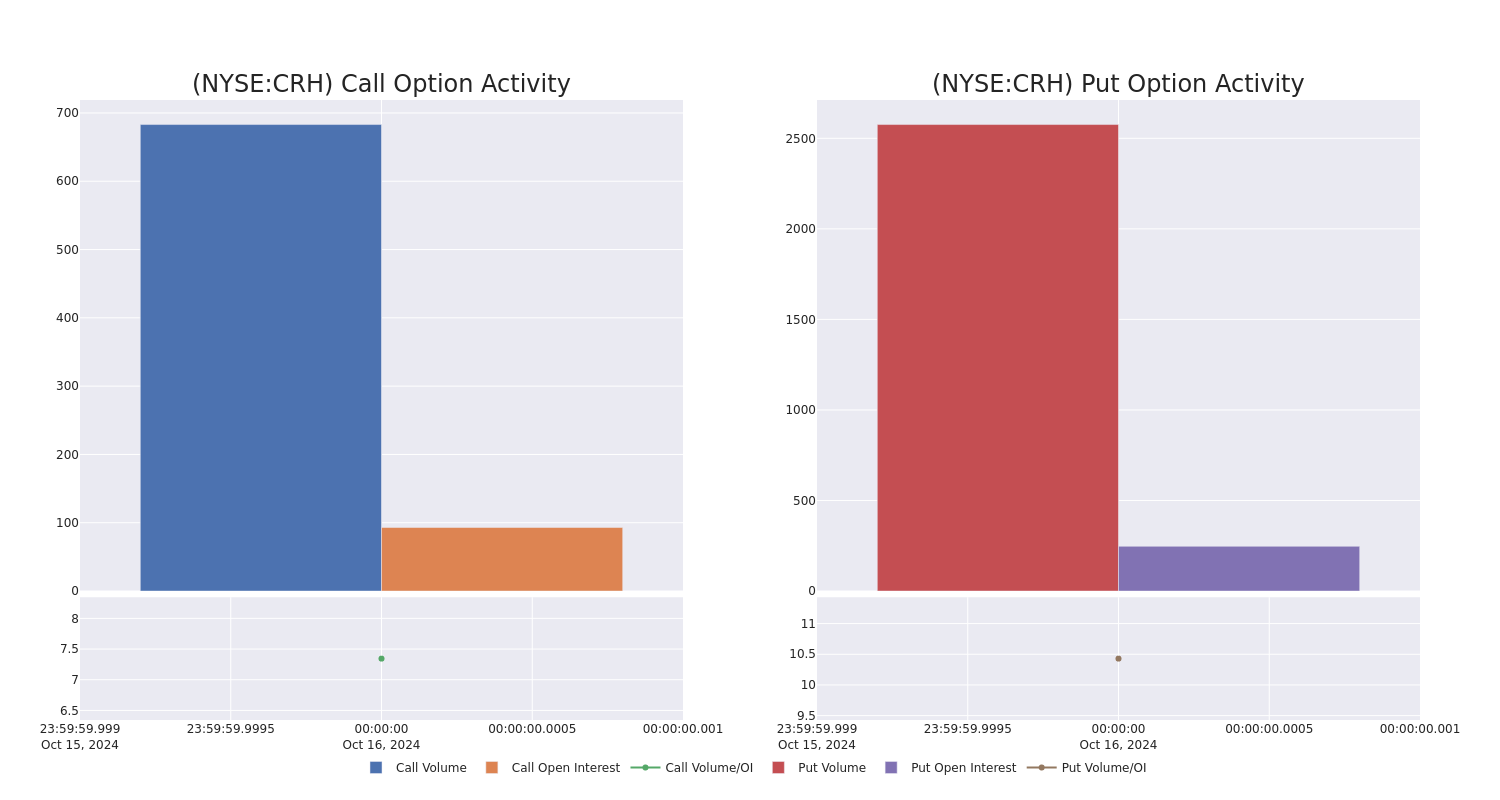
In today’s trading context, the average open interest for options of CRH stands at 170.0, with a total volume reaching 3,259.00. The accompanying chart delineates the progression of both call and put option volume and open interest for high-value trades in CRH, situated within the strike price corridor from $90.0 to $90.0, throughout the last 30 days.
CRH 30-Day Option Volume & Interest Snapshot
Largest Options Trades Observed:
| Symbol | PUT/CALL | Trade Type | Sentiment | Exp. Date | Ask | Bid | Price | Strike Price | Total Trade Price | Open Interest | Volume |
|---|---|---|---|---|---|---|---|---|---|---|---|
| CRH | PUT | SWEEP | BEARISH | 11/15/24 | $2.55 | $2.4 | $2.5 | $90.00 | $238.2K | 247 | 1.0K |
| CRH | PUT | SWEEP | BEARISH | 11/15/24 | $2.5 | $2.45 | $2.5 | $90.00 | $76.0K | 247 | 304 |
| CRH | CALL | SWEEP | NEUTRAL | 12/20/24 | $7.0 | $6.8 | $6.96 | $90.00 | $55.5K | 93 | 280 |
| CRH | CALL | SWEEP | NEUTRAL | 12/20/24 | $7.3 | $7.1 | $7.2 | $90.00 | $49.6K | 93 | 150 |
| CRH | PUT | SWEEP | BULLISH | 11/15/24 | $2.5 | $2.45 | $2.45 | $90.00 | $49.0K | 247 | 512 |
About CRH
CRH is a global manufacturer of a range of building products used in construction projects, operating via a vertically integrated business model. The past decade has seen CRH transform into a leading building materials business, with increasing exposure to upstream building activities such as aggregates and cement. CRH’s geographic footprint is mostly across developed markets. North America is CRH’s largest market and accounts for 75% of EBITDA. The company is the largest producer of aggregates and asphalt in the US.
In light of the recent options history for CRH, it’s now appropriate to focus on the company itself. We aim to explore its current performance.
Where Is CRH Standing Right Now?
- Trading volume stands at 1,378,517, with CRH’s price down by -0.18%, positioned at $92.8.
- RSI indicators show the stock to be may be approaching overbought.
- Earnings announcement expected in 22 days.
Unusual Options Activity Detected: Smart Money on the Move
Benzinga Edge’s Unusual Options board spots potential market movers before they happen. See what positions big money is taking on your favorite stocks. Click here for access.
Options trading presents higher risks and potential rewards. Astute traders manage these risks by continually educating themselves, adapting their strategies, monitoring multiple indicators, and keeping a close eye on market movements. Stay informed about the latest CRH options trades with real-time alerts from Benzinga Pro.
Market News and Data brought to you by Benzinga APIs
© 2024 Benzinga.com. Benzinga does not provide investment advice. All rights reserved.
Options Exercise Update At AXIL Brands: JEFF TOGHRAIE Engages
A substantial insider activity was disclosed on October 15, as TOGHRAIE, Chairman at AXIL Brands AXIL, reported the exercise of a large sell of company stock options.
What Happened: A notable Form 4 filing on Tuesday with the U.S. Securities and Exchange Commission revealed that TOGHRAIE, Chairman at AXIL Brands, exercised stock options for 0 shares of AXIL, resulting in a transaction value of $0.
The Wednesday morning update indicates AXIL Brands shares up by 0.52%, currently priced at $3.87. At this value, TOGHRAIE’s 0 shares are worth $0.
Unveiling the Story Behind AXIL Brands
AXIL Brands Inc is a company which is is a manufacturer and marketer of premium hearing enhancement and protection products, including ear plugs, earmuffs, and ear buds, under the AXIL brand. AXIL delivers top hearing enhancement, protection, & audio devices. From ultra comfortable fitting processes, to stereo quality sound performance, to reliable & durable engineering.
Financial Insights: AXIL Brands
Revenue Growth: AXIL Brands’s revenue growth over a period of 3 months has faced challenges. As of 31 August, 2024, the company experienced a revenue decline of approximately -4.18%. This indicates a decrease in the company’s top-line earnings. When compared to others in the Consumer Staples sector, the company excelled with a growth rate higher than the average among peers.
Insights into Profitability:
-
Gross Margin: With a high gross margin of 70.99%, the company demonstrates effective cost control and strong profitability relative to its peers.
-
Earnings per Share (EPS): AXIL Brands’s EPS is below the industry average, signaling challenges in bottom-line performance with a current EPS of -0.02.
Debt Management: AXIL Brands’s debt-to-equity ratio is below the industry average at 0.02, reflecting a lower dependency on debt financing and a more conservative financial approach.
Understanding Financial Valuation:
-
Price to Earnings (P/E) Ratio: The Price to Earnings ratio of 21.39 is lower than the industry average, indicating potential undervaluation for the stock.
-
Price to Sales (P/S) Ratio: The current P/S ratio of 1.84 is above industry norms, reflecting an elevated valuation for AXIL Brands’s stock and potential overvaluation based on sales performance.
-
EV/EBITDA Analysis (Enterprise Value to its Earnings Before Interest, Taxes, Depreciation & Amortization): AXIL Brands’s EV/EBITDA ratio of 13.31 exceeds industry averages, indicating a premium valuation in the market
Market Capitalization Analysis: Falling below industry benchmarks, the company’s market capitalization reflects a reduced size compared to peers. This positioning may be influenced by factors such as growth expectations or operational capacity.
Now trade stocks online commission free with Charles Schwab, a trusted and complete investment firm.
The Relevance of Insider Transactions
Insider transactions should be considered alongside other factors when making investment decisions, as they can offer important insights.
In legal terms, an “insider” refers to any officer, director, or beneficial owner of more than ten percent of a company’s equity securities registered under Section 12 of the Securities Exchange Act of 1934. This can include executives in the c-suite and large hedge funds. These insiders are required to let the public know of their transactions via a Form 4 filing, which must be filed within two business days of the transaction.
When a company insider makes a new purchase, that is an indication that they expect the stock to rise.
Insider sells, on the other hand, can be made for a variety of reasons, and may not necessarily mean that the seller thinks the stock will go down.
Deciphering Transaction Codes in Insider Filings
In the domain of transactions, investors frequently turn their focus to those taking place in the open market, as meticulously outlined in Table I of the Form 4 filing. A P in Box 3 indicates a purchase, while S signifies a sale. Transaction code C signals the conversion of an option, and transaction code A denotes a grant, award, or other acquisition of securities from the company.
Check Out The Full List Of AXIL Brands’s Insider Trades.
Insider Buying Alert: Profit from C-Suite Moves
Benzinga Edge reveals every insider trade in real-time. Don’t miss the next big stock move driven by insider confidence. Unlock this ultimate sentiment indicator now. Click here for access.
This article was generated by Benzinga’s automated content engine and reviewed by an editor.
Market News and Data brought to you by Benzinga APIs
© 2024 Benzinga.com. Benzinga does not provide investment advice. All rights reserved.

