Check Out What Whales Are Doing With Blackstone
Financial giants have made a conspicuous bearish move on Blackstone. Our analysis of options history for Blackstone BX revealed 18 unusual trades.
Delving into the details, we found 44% of traders were bullish, while 50% showed bearish tendencies. Out of all the trades we spotted, 6 were puts, with a value of $322,390, and 12 were calls, valued at $740,378.
Predicted Price Range
Based on the trading activity, it appears that the significant investors are aiming for a price territory stretching from $125.0 to $195.0 for Blackstone over the recent three months.
Insights into Volume & Open Interest
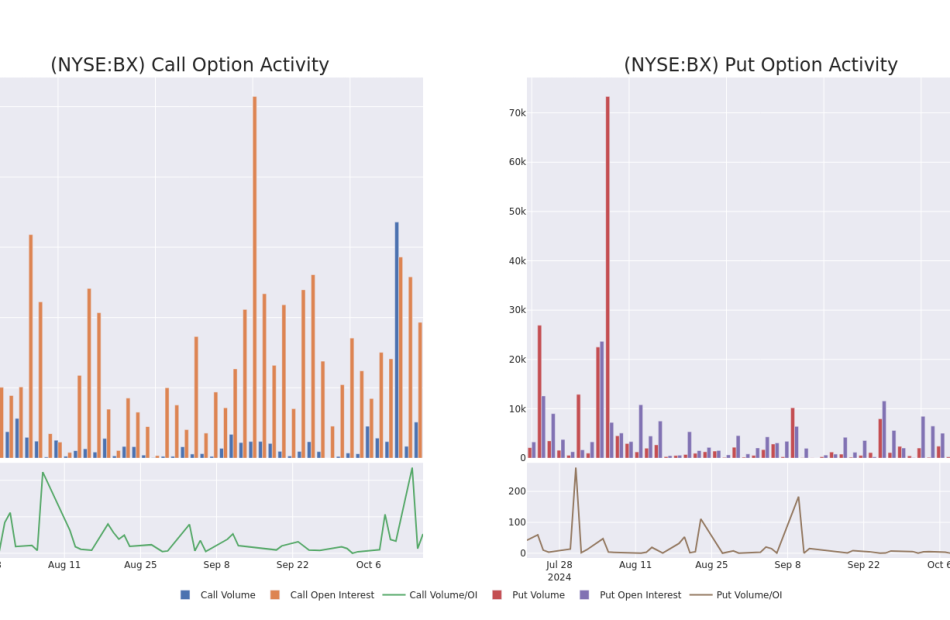
Looking at the volume and open interest is a powerful move while trading options. This data can help you track the liquidity and interest for Blackstone’s options for a given strike price. Below, we can observe the evolution of the volume and open interest of calls and puts, respectively, for all of Blackstone’s whale trades within a strike price range from $125.0 to $195.0 in the last 30 days.
Blackstone Option Activity Analysis: Last 30 Days
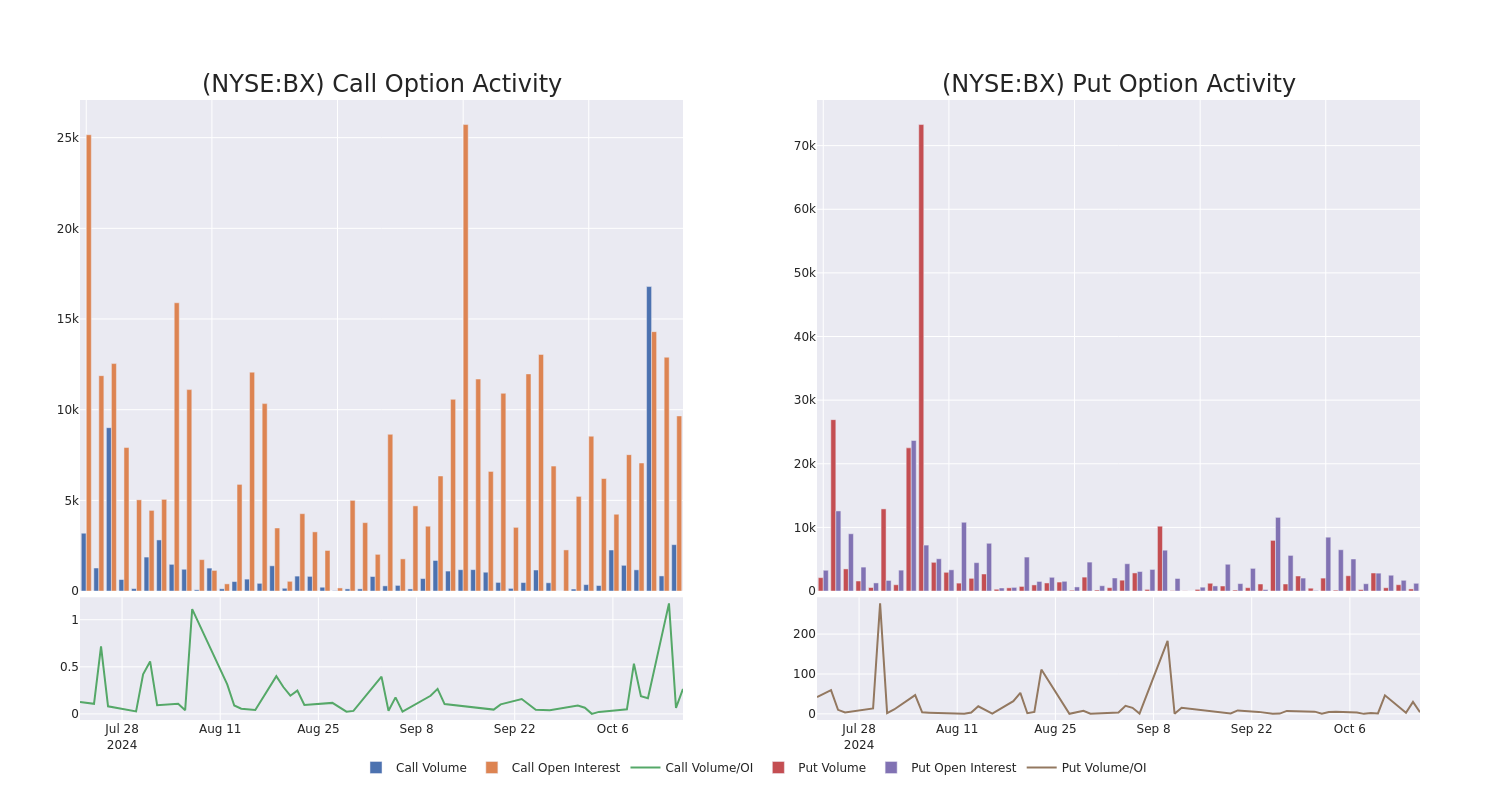
Noteworthy Options Activity:
| Symbol | PUT/CALL | Trade Type | Sentiment | Exp. Date | Ask | Bid | Price | Strike Price | Total Trade Price | Open Interest | Volume |
|---|---|---|---|---|---|---|---|---|---|---|---|
| BX | CALL | TRADE | BEARISH | 01/15/27 | $16.25 | $15.1 | $15.1 | $195.00 | $149.4K | 0 | 100 |
| BX | CALL | TRADE | BEARISH | 10/18/24 | $2.32 | $2.18 | $1.98 | $160.00 | $110.6K | 2.7K | 1.2K |
| BX | CALL | TRADE | BULLISH | 10/18/24 | $4.7 | $4.45 | $4.7 | $155.00 | $94.0K | 2.7K | 221 |
| BX | PUT | SWEEP | BEARISH | 01/17/25 | $9.7 | $9.6 | $9.7 | $160.00 | $93.1K | 233 | 107 |
| BX | PUT | SWEEP | BEARISH | 01/15/27 | $33.6 | $31.0 | $33.6 | $175.00 | $84.0K | 31 | 60 |
About Blackstone
Blackstone is the world’s largest alternative-asset manager with $1.076 trillion in total asset under management, including $808.7 billion in fee-earning assets under management, at the end of June 2024. The company has four core business segments: private equity (25% of fee-earning AUM and 28% of base management fees), real estate (37% and 42%), credit and insurance (29% and 23%), and multi-asset investing (9% and 7%). While the firm primarily serves institutional investors (87% of AUM), it also caters to clients in the high-net-worth channel (13%). Blackstone operates through 25 offices in the Americas (8), Europe and the Middle East (9), and the Asia-Pacific region (8).
After a thorough review of the options trading surrounding Blackstone, we move to examine the company in more detail. This includes an assessment of its current market status and performance.
Current Position of Blackstone
- Currently trading with a volume of 1,180,589, the BX’s price is up by 2.06%, now at $159.54.
- RSI readings suggest the stock is currently may be approaching overbought.
- Anticipated earnings release is in 1 days.
What The Experts Say On Blackstone
5 market experts have recently issued ratings for this stock, with a consensus target price of $154.2.
Turn $1000 into $1270 in just 20 days?
20-year pro options trader reveals his one-line chart technique that shows when to buy and sell. Copy his trades, which have had averaged a 27% profit every 20 days. Click here for access.
* Maintaining their stance, an analyst from Barclays continues to hold a Equal-Weight rating for Blackstone, targeting a price of $155.
* Consistent in their evaluation, an analyst from Goldman Sachs keeps a Neutral rating on Blackstone with a target price of $135.
* In a cautious move, an analyst from Piper Sandler downgraded its rating to Neutral, setting a price target of $149.
* Maintaining their stance, an analyst from Morgan Stanley continues to hold a Overweight rating for Blackstone, targeting a price of $177.
* An analyst from Evercore ISI Group persists with their Outperform rating on Blackstone, maintaining a target price of $155.
Options are a riskier asset compared to just trading the stock, but they have higher profit potential. Serious options traders manage this risk by educating themselves daily, scaling in and out of trades, following more than one indicator, and following the markets closely.
If you want to stay updated on the latest options trades for Blackstone, Benzinga Pro gives you real-time options trades alerts.
Market News and Data brought to you by Benzinga APIs
© 2024 Benzinga.com. Benzinga does not provide investment advice. All rights reserved.
Chief Financial Officer Of IDT Makes $114K Sale
MARCELO FISCHER, Chief Financial Officer at IDT IDT, disclosed an insider sell on October 15, according to a recent SEC filing.
What Happened: A Form 4 filing from the U.S. Securities and Exchange Commission on Tuesday showed that FISCHER sold 2,406 shares of IDT. The total transaction amounted to $114,787.
IDT‘s shares are actively trading at $46.59, experiencing a down of 0.38% during Wednesday’s morning session.
Discovering IDT: A Closer Look
IDT Corp is a multinational holding company. It primarily operates in the telecommunications and payment industries. It has four reportable business segments, Fintech, National Retail Solutions & net2phone and Traditional Communications, The Fintech segment is comprised of National Retail Solutions (NRS), an operator of a nationwide point of sale (POS) network providing payment processing, digital advertising, transaction data, and ancillary services, and BOSS Money, a provider of international money remittance and related value/payment transfer services. The net2phone segment provides unified cloud communications and telephony services to business customers.
Understanding the Numbers: IDT’s Finances
Revenue Growth: Over the 3 months period, IDT showcased positive performance, achieving a revenue growth rate of 3.07% as of 31 July, 2024. This reflects a substantial increase in the company’s top-line earnings. In comparison to its industry peers, the company stands out with a growth rate higher than the average among peers in the Communication Services sector.
Exploring Profitability:
-
Gross Margin: The company issues a cost efficiency warning with a low gross margin of 33.09%, indicating potential difficulties in maintaining profitability compared to its peers.
-
Earnings per Share (EPS): IDT’s EPS lags behind the industry average, indicating concerns and potential challenges with a current EPS of 1.45.
Debt Management: The company maintains a balanced debt approach with a debt-to-equity ratio below industry norms, standing at 0.01.
Valuation Overview:
-
Price to Earnings (P/E) Ratio: IDT’s current Price to Earnings (P/E) ratio of 18.41 is higher than the industry average, indicating that the stock may be overvalued according to market sentiment.
-
Price to Sales (P/S) Ratio: The Price to Sales ratio is 0.99, which is lower than the industry average. This suggests a possible undervaluation based on sales performance.
-
EV/EBITDA Analysis (Enterprise Value to its Earnings Before Interest, Taxes, Depreciation & Amortization): The company’s EV/EBITDA ratio 12.01 is above the industry average, suggesting that the market values the company more highly for each unit of EBITDA. This could be attributed to factors such as strong growth prospects or superior operational efficiency.
Market Capitalization Analysis: Below industry benchmarks, the company’s market capitalization reflects a smaller scale relative to peers. This could be attributed to factors such as growth expectations or operational capacity.
Now trade stocks online commission free with Charles Schwab, a trusted and complete investment firm.
Unmasking the Significance of Insider Transactions
Investors should view insider transactions as part of a multifaceted analysis and not rely solely on them for decision-making.
Exploring the legal landscape, an “insider” is defined as any officer, director, or beneficial owner holding more than ten percent of a company’s equity securities, as stipulated by Section 12 of the Securities Exchange Act of 1934. This encompasses executives in the c-suite and major hedge funds. These insiders are required to report their transactions through a Form 4 filing, which must be submitted within two business days of the transaction.
Highlighted by a company insider’s new purchase, there’s a positive anticipation for the stock to rise.
But, insider sells may not necessarily indicate a bearish view and can be motivated by various factors.
Important Transaction Codes
Surveying the realm of stock transactions, investors often give prominence to those unfolding in the open market, systematically detailed in Table I of the Form 4 filing. A P in Box 3 indicates a purchase, while S signifies a sale. Transaction code C denotes the conversion of an option, and transaction code A denotes a grant, award, or other acquisition of securities from the company.
Check Out The Full List Of IDT’s Insider Trades.
Insider Buying Alert: Profit from C-Suite Moves
Benzinga Edge reveals every insider trade in real-time. Don’t miss the next big stock move driven by insider confidence. Unlock this ultimate sentiment indicator now. Click here for access.
This article was generated by Benzinga’s automated content engine and reviewed by an editor.
Market News and Data brought to you by Benzinga APIs
© 2024 Benzinga.com. Benzinga does not provide investment advice. All rights reserved.
What's Next: Alpine Income Prop Trust's Earnings Preview
Alpine Income Prop Trust PINE will release its quarterly earnings report on Thursday, 2024-10-17. Here’s a brief overview for investors ahead of the announcement.
Analysts anticipate Alpine Income Prop Trust to report an earnings per share (EPS) of $0.40.
The announcement from Alpine Income Prop Trust is eagerly anticipated, with investors seeking news of surpassing estimates and favorable guidance for the next quarter.
It’s worth noting for new investors that guidance can be a key determinant of stock price movements.
Earnings History Snapshot
During the last quarter, the company reported an EPS beat by $0.04, leading to a 0.12% increase in the share price on the subsequent day.
Here’s a look at Alpine Income Prop Trust’s past performance and the resulting price change:
| Quarter | Q2 2024 | Q1 2024 | Q4 2023 | Q3 2023 |
|---|---|---|---|---|
| EPS Estimate | 0.39 | 0.38 | ||
| EPS Actual | 0.43 | 0.41 | 0.37 | 0.37 |
| Price Change % | 0.0% | 2.0% | 2.0% | -13.0% |
Alpine Income Prop Trust Share Price Analysis
Shares of Alpine Income Prop Trust were trading at $17.25 as of October 15. Over the last 52-week period, shares are up 7.19%. Given that these returns are generally positive, long-term shareholders should be satisfied going into this earnings release.
Analysts’ Perspectives on Alpine Income Prop Trust
For investors, staying informed about market sentiments and expectations in the industry is paramount. This analysis provides an exploration of the latest insights on Alpine Income Prop Trust.
The consensus rating for Alpine Income Prop Trust is Buy, derived from 7 analyst ratings. An average one-year price target of $19.04 implies a potential 10.38% upside.
Peer Ratings Comparison
In this comparison, we explore the analyst ratings and average 1-year price targets of CTO Realty Growth, One Liberty Props and Gladstone Commercial, three prominent industry players, offering insights into their relative performance expectations and market positioning.
- The prevailing sentiment among analysts is an Buy trajectory for CTO Realty Growth, with an average 1-year price target of $21.25, implying a potential 23.19% upside.
- One Liberty Props received a Buy consensus from analysts, with an average 1-year price target of $28.0, implying a potential 62.32% upside.
- The consensus outlook from analysts is an Neutral trajectory for Gladstone Commercial, with an average 1-year price target of $15.0, indicating a potential 13.04% downside.
Comprehensive Peer Analysis Summary
The peer analysis summary provides a snapshot of key metrics for CTO Realty Growth, One Liberty Props and Gladstone Commercial, illuminating their respective standings within the industry. These metrics offer valuable insights into their market positions and comparative performance.
| Company | Consensus | Revenue Growth | Gross Profit | Return on Equity |
|---|---|---|---|---|
| Alpine Income Prop Trust | Buy | 1.37% | $9.70M | 0.08% |
| CTO Realty Growth | Buy | 10.74% | $20.51M | -0.14% |
| One Liberty Props | Buy | -2.71% | $17.82M | 3.01% |
| Gladstone Commercial | Neutral | -4.14% | $29.73M | -1.10% |
Key Takeaway:
Alpine Income Prop Trust ranks at the top for Revenue Growth and Gross Profit among its peers. However, it ranks at the bottom for Return on Equity.
Discovering Alpine Income Prop Trust: A Closer Look
Alpine Income Property Trust Inc is a real estate company. It owns and operates a portfolio of single-tenant commercial properties. The company’s portfolio is comprised of single-tenant retail and office properties located in or in close proximity to MSAs, growth markets and other markets in the United States. Their portfolio consists of One thirty eight net leased properties located in Hundred and four markets in thirty five states. The majority of the firm’s revenue includes rental revenue derived from the ownership and leasing of property.
Financial Insights: Alpine Income Prop Trust
Market Capitalization Analysis: Below industry benchmarks, the company’s market capitalization reflects a smaller scale relative to peers. This could be attributed to factors such as growth expectations or operational capacity.
Revenue Growth: Over the 3 months period, Alpine Income Prop Trust showcased positive performance, achieving a revenue growth rate of 1.37% as of 30 June, 2024. This reflects a substantial increase in the company’s top-line earnings. In comparison to its industry peers, the company trails behind with a growth rate lower than the average among peers in the Real Estate sector.
Net Margin: Alpine Income Prop Trust’s net margin is below industry standards, pointing towards difficulties in achieving strong profitability. With a net margin of 1.77%, the company may encounter challenges in effective cost control.
Return on Equity (ROE): Alpine Income Prop Trust’s ROE surpasses industry standards, highlighting the company’s exceptional financial performance. With an impressive 0.08% ROE, the company effectively utilizes shareholder equity capital.
Return on Assets (ROA): Alpine Income Prop Trust’s ROA falls below industry averages, indicating challenges in efficiently utilizing assets. With an ROA of 0.04%, the company may face hurdles in generating optimal returns from its assets.
Debt Management: Alpine Income Prop Trust’s debt-to-equity ratio is below industry norms, indicating a sound financial structure with a ratio of 1.13.
This article was generated by Benzinga’s automated content engine and reviewed by an editor.
Market News and Data brought to you by Benzinga APIs
© 2024 Benzinga.com. Benzinga does not provide investment advice. All rights reserved.
Price Over Earnings Overview: Equifax
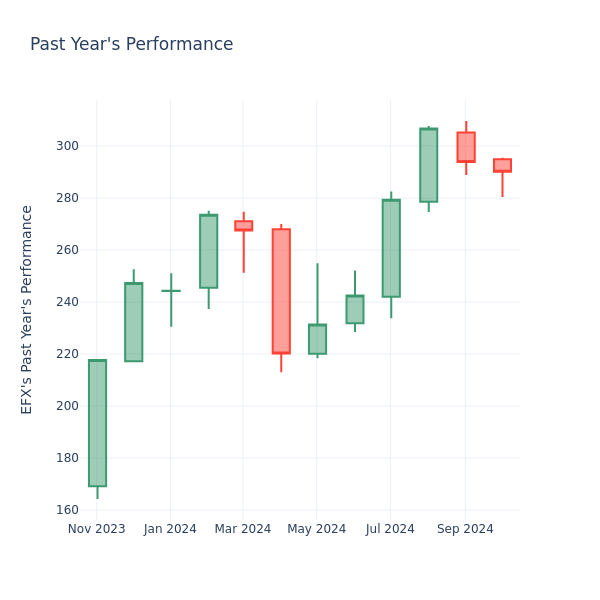
In the current market session, Equifax Inc. EFX share price is at $292.81, after a 0.92% increase. Moreover, over the past month, the stock fell by 2.50%, but in the past year, went up by 62.11%. Shareholders might be interested in knowing whether the stock is overvalued, even if the company is performing up to par in the current session.
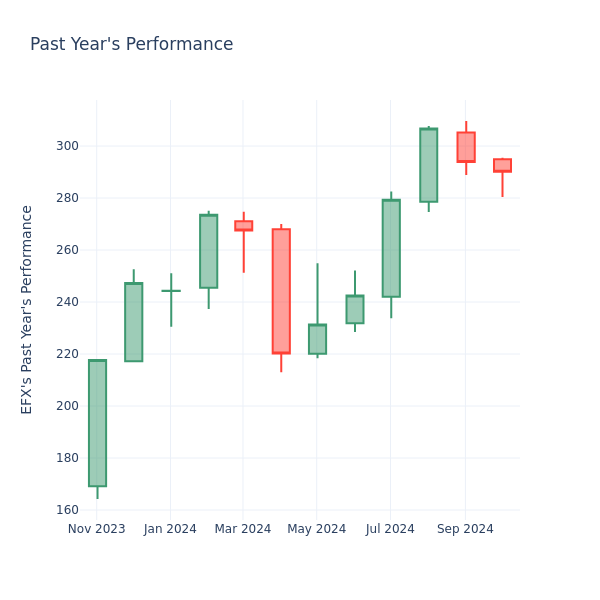
Equifax P/E Ratio Analysis in Relation to Industry Peers
The P/E ratio is used by long-term shareholders to assess the company’s market performance against aggregate market data, historical earnings, and the industry at large. A lower P/E could indicate that shareholders do not expect the stock to perform better in the future or it could mean that the company is undervalued.
Equifax has a better P/E ratio of 61.99 than the aggregate P/E ratio of 46.22 of the Professional Services industry. Ideally, one might believe that Equifax Inc. might perform better in the future than it’s industry group, but it’s probable that the stock is overvalued.
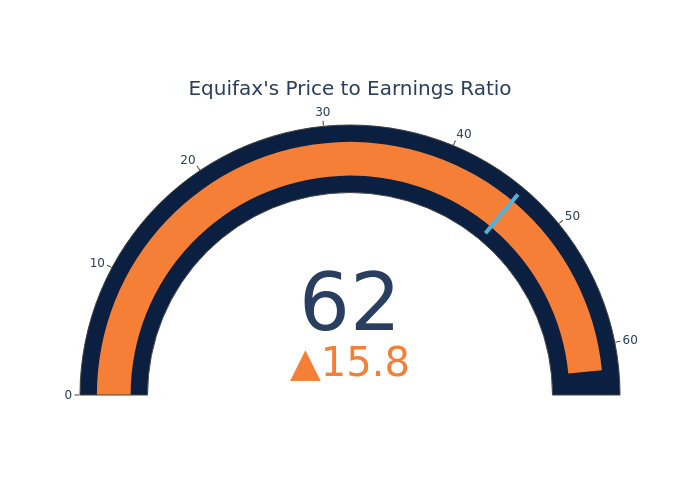
In conclusion, the price-to-earnings ratio is a useful metric for analyzing a company’s market performance, but it has its limitations. While a lower P/E can indicate that a company is undervalued, it can also suggest that shareholders do not expect future growth. Additionally, the P/E ratio should not be used in isolation, as other factors such as industry trends and business cycles can also impact a company’s stock price. Therefore, investors should use the P/E ratio in conjunction with other financial metrics and qualitative analysis to make informed investment decisions.
Market News and Data brought to you by Benzinga APIs
© 2024 Benzinga.com. Benzinga does not provide investment advice. All rights reserved.
Barrick Sees Stable Gold Output In Q3, Prepares For Stronger Q4
Barrick Gold Corporation GOLD shares are trading lower on Wednesday. The company reported preliminary third-quarter production metrics.
The company sees production of 943,000 ounces of gold and 48,000 tonnes of copper and preliminary sales of 967,000 ounces of gold and 42,000 tonnes of copper.
Barrick anticipates a significantly stronger fourth quarter, aiming to meet its full-year production guidance for both gold and copper in 2024.
Notably, in the third quarter, the average market price for gold was $2,474 per ounce, while copper averaged $4.18 per pound.
The company said that preliminary gold production remained steady on a Q/Q basis.
Pueblo Viejo sequentially improved by 23% due to ongoing plant optimization, while North Mara benefited from higher grades.
On a Q/Q basis, the third quarter gold cost of sales per ounce is expected to increase by 1% to 3%, total cash costs by 3% to 5%, and all-in-sustaining costs by 0% to 2%, partly due to higher royalties from increased gold prices.
Meanwhile, preliminary copper production increased Q/Q, mainly due to higher grades and recoveries at Lumwana, which benefited from improved ore access following ramped-up stripping activities in the second quarter.
On a Q/Q basis, the third quarter cost of sales per pound is expected to rise by 5% to 7% and C1 cash costs by 13% to 15%.
However, all-in-sustaining costs per pound are expected to decrease by 2% to 4%, primarily due to reduced capitalized waste stripping at Lumwana.
Barrick is scheduled to release its third quarter results before the market opens on November 7, 2024.
Investors can gain exposure to the stock via Sprott Gold Miners ETF SGDM and VanEck Gold Miners ETF GDX.
Price Action: GOLD shares are down 0.47% at $20.12 at the last check Wednesday.
Image via Shutterstock
Read Next:
This content was partially produced with the help of AI tools and was reviewed and published by Benzinga editors.
Market News and Data brought to you by Benzinga APIs
© 2024 Benzinga.com. Benzinga does not provide investment advice. All rights reserved.
Insider Selling: Pierre Riel Unloads $1.79M Of Costco Wholesale Stock
Making a noteworthy insider sell on October 15, Pierre Riel, Executive Vice President at Costco Wholesale COST, is reported in the latest SEC filing.
What Happened: Riel opted to sell 2,000 shares of Costco Wholesale, according to a Form 4 filing with the U.S. Securities and Exchange Commission on Tuesday. The transaction’s total worth stands at $1,793,426.
In the Wednesday’s morning session, Costco Wholesale‘s shares are currently trading at $881.9, experiencing a down of 1.42%.
All You Need to Know About Costco Wholesale
Costco operates a membership-based, no-frills retail model, predicated on offering a select product assortment in bulk quantities at bargain prices. The firm avoids maintaining costly product displays by keeping inventory on pallets and limits distribution expenses by storing its inventory at point of sale in the warehouse. Given Costco’s frugal cost structure, the firm is able to price its merchandise below competing retailers, driving high sales volume per warehouse and allowing the retailer to generate strong profits on thin margins. Costco operates over 600 warehouses in the United States and enjoys over 60% market share in the domestic warehouse club industry. Internationally, Costco operates another 270 warehouses, primarily in markets such as Canada, Mexico, Japan, and the UK.
Unraveling the Financial Story of Costco Wholesale
Positive Revenue Trend: Examining Costco Wholesale’s financials over 3 months reveals a positive narrative. The company achieved a noteworthy revenue growth rate of 0.96% as of 31 August, 2024, showcasing a substantial increase in top-line earnings. As compared to its peers, the revenue growth lags behind its industry peers. The company achieved a growth rate lower than the average among peers in Consumer Staples sector.
Navigating Financial Profits:
-
Gross Margin: The company faces challenges with a low gross margin of 12.68%, suggesting potential difficulties in cost control and profitability compared to its peers.
-
Earnings per Share (EPS): Costco Wholesale’s EPS outshines the industry average, indicating a strong bottom-line trend with a current EPS of 5.3.
Debt Management: Costco Wholesale’s debt-to-equity ratio is below industry norms, indicating a sound financial structure with a ratio of 0.35.
In-Depth Valuation Examination:
-
Price to Earnings (P/E) Ratio: With a higher-than-average P/E ratio of 54.05, Costco Wholesale’s stock is perceived as being overvalued in the market.
-
Price to Sales (P/S) Ratio: With a higher-than-average P/S ratio of 1.56, Costco Wholesale’s stock is perceived as being overvalued in the market, particularly in relation to sales performance.
-
EV/EBITDA Analysis (Enterprise Value to its Earnings Before Interest, Taxes, Depreciation & Amortization): Costco Wholesale’s EV/EBITDA ratio, surpassing industry averages at 32.41, positions it with an above-average valuation in the market.
Market Capitalization Highlights: Above the industry average, the company’s market capitalization signifies a significant scale, indicating strong confidence and market prominence.
Now trade stocks online commission free with Charles Schwab, a trusted and complete investment firm.
Why Pay Attention to Insider Transactions
Insider transactions shouldn’t be used primarily to make an investing decision, however an insider transaction can be an important factor in the investing decision.
In the realm of legality, an “insider” is defined as any officer, director, or beneficial owner holding more than ten percent of a company’s equity securities under Section 12 of the Securities Exchange Act of 1934. This includes executives in the c-suite and major hedge funds. These insiders are required to disclose their transactions through a Form 4 filing, to be submitted within two business days of the transaction.
Notably, when a company insider makes a new purchase, it is considered an indicator of their positive expectations for the stock.
Conversely, insider sells may not necessarily signal a bearish stance on the stock and can be motivated by various factors.
Important Transaction Codes
Taking a closer look at transactions, investors often prioritize those unfolding in the open market, meticulously cataloged in Table I of the Form 4 filing. A P in Box 3 denotes a purchase, while S signifies a sale. Transaction code C denotes the conversion of an option, and transaction code A signifies a grant, award, or other acquisition of securities from the company.
Check Out The Full List Of Costco Wholesale’s Insider Trades.
Insider Buying Alert: Profit from C-Suite Moves
Benzinga Edge reveals every insider trade in real-time. Don’t miss the next big stock move driven by insider confidence. Unlock this ultimate sentiment indicator now. Click here for access.
This article was generated by Benzinga’s automated content engine and reviewed by an editor.
Market News and Data brought to you by Benzinga APIs
© 2024 Benzinga.com. Benzinga does not provide investment advice. All rights reserved.
Should Lockheed Stock Be in Your Portfolio Ahead of Q3 Earnings Report?
Lockheed Martin Corporation LMT is slated to release third-quarter 2024 results on Oct. 22, before the opening bell.
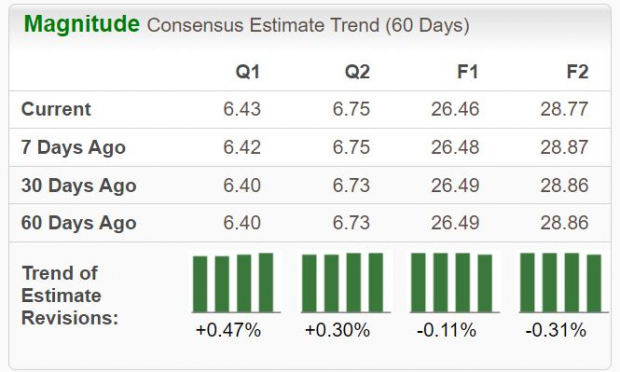
The Zacks Consensus Estimate for revenues is pegged at $17.28 billion, implying 2.4% growth from the year-ago quarter’s reported figure. The consensus mark for third-quarter earnings is pegged at $6.43 per share, suggesting a 5% decline from $6.77 reported in the prior-year quarter. The bottom-line estimate has inched up 0.5% in the past 60 days.

Image Source: Zacks Investment Research
LMT, America’s largest defense contractor, has an impressive earnings surprise history. Its earnings outpaced the Zacks Consensus Estimate in each of the trailing four quarters, the average surprise being 7.46%.

Image Source: Zacks Investment Research
Earnings Whisper for LMT
Our proven model predicts an earnings beat for Lockheed this time around. The combination of a positive Earnings ESP and a Zacks Rank #1 (Strong Buy), 2 (Buy) or 3 (Hold) increases the chances of an earnings beat, which is the case here.
Lockheed has a Zacks Rank #3 and an Earnings ESP of +2.46%.
Factors Shaping LMT’s Upcoming Q3 Results
A potential solid sales improvement from each of LMT’s four business segments is likely to have bolstered the company’s top-line performance.
Aeronautics to Post Solid Sales
The Aeronautics segment, which primarily manufactures advanced, combat-proven jets, and contributes almost 40% to the company’s top line, is likely to deliver impressive third-quarter results.
A ramp-up in the production of the F-16 program, along with higher sales volume from production and sustainment contracts for the F-35 program, is likely to have bolstered this segment’s top line.
The Zacks Consensus Estimate for the Aeronautics unit’s third-quarter revenues is pegged at $6,764.8 million, indicating a 0.7% rise from the prior-year period’s reported figure.
Impressive Projections From Other Segments
The remaining three segments are also projected to have performed favorably in the to-be-reported quarter.
Higher sales volume from the hypersonic development programs, along with Fleet Ballistic Missile (FBM), transport layer and other space exploration programs must have boosted the Space segment’s top line.
The Zacks Consensus Estimate for the segment’s revenues is pinned at $3,174 million, indicating a 2.3% improvement from the prior-year quarter’s reported number.
LMT’s Missiles and Fire Control (“MFC”) segment provides critical missile defense support to the United States and foreign allies. A higher sales volume, resulting from the production ramp-up of the Guided Multiple Launch Rocket Systems and Long Range Anti-Ship Missile programs, is likely to have benefited this unit’s quarterly sales performance.
The Zacks Consensus Estimate for MFC’s third-quarter revenues is currently pegged at $3,116.7 million, indicating 6% growth from the top line recorded a year ago.
Higher sales volume from the Sikorsky unit, particularly driven by CH-53K and Blackhawk helicopters, is likely to have bolstered the Rotary and Mission Systems (“RMS”) segment’s sales in the quarter under review.
The solid production ramp-up of this unit’s laser systems portfolio and higher sales volume of radar might have also contributed favorably to RMS’ third-quarter top line.
The Zacks Consensus Estimate for the unit’s revenues is currently pegged at $4,203.1 million, indicating a 2% improvement from the top line registered a year ago.
Outlook for LMT’s Q3 Bottom-Line
Higher interest expenses remain a headwind for the majority of U.S. companies, with Lockheed being no exception. With the Federal Reserve having cut the nation’s interest rate in the second half of September, notable interest expenses can be expected to have weighed on LMT’s third-quarter earnings.
Our model estimate for third-quarter interest expenses is $249.8 million, reflecting a solid 5.4% increase year over year.
During the first quarter of 2024, LMT recognized a reach-forward loss of $100 million associated with a classified missile program at its MFC unit. This, in turn, adversely impacted this unit’s operating profit in the second quarter as well. With a potential loss of $350 million associated with this program, LMT might have also incurred a notable loss in its MFC unit in the third quarter. This, in turn, is likely to have adversely impacted its margin performance and, thereby, bottom-line growth.
Also, the unfavorable cost pressure faced by its Sikorsky business might have had affected LMT’s overall earnings performance in the third quarter, outweighing the favorable impacts of solid top-line growth.
Price Performance & Valuation
Lockheed’s shares have exhibited an upward trend, gaining a notable percentage over the year-to-date period. Specifically, the stock has risen 33.5% year to date, outperforming the Zacks aerospace-defense industry’s decline of 7.3%.
YTD Performance

Image Source: Zacks Investment Research
As evident from the image, other notable stocks from the same industry have also rallied year to date and comfortably outpaced the industry’s performance. Shares of L3Harris Technologies LHX, General Dynamics GD and Textron TXT have rallied 16.5%, 15.6% and 9.3%, respectively.
From a valuation perspective, LMT is trading at a premium when compared to its industry. Currently, LMT is trading at 21.39X forward 12-month earnings, which is higher than the industry’s forward earnings multiple of 19.29. Also, its five-year median is 15.82X. So, the company’s valuation also looks stretched compared with its own range.
LMT’s Price-to-Earnings (forward 12 Months)

Image Source: Zacks Investment Research
Investment Thesis
Widespread hostilities engulfing the global defense map in recent times have prompted nations worldwide to ramp up their defense arsenal significantly. This has been acting as a solid growth catalyst for defense contractors like Lockheed in the form of solid contract wins. We may thus expect LMT’s third-quarter results to duly reflect this in terms of notable revenue growth.
Backed by its solid top-line prospects, the company has been offering notable rewards to its shareholders. Impressively, LMT’s dividend yield of 2.08% outpaces that of the S&P 500 (1.22%).
However, persistently high interest expenses remain a major headwind for the company’s near-term bottom-line growth. These might have also contributed to LMT’s elevated leverage, as evident from its long-term debt-to-capital ratio, which came in quite higher than that of its peer group.
LMT’s Long-Term Debt-to-Capital

Image Source: Zacks Investment Research
Should You Buy LMT Stock Before Q3 Earnings Release?
Lockheed is less likely to disappoint with its third-quarter results, considering the recent upward revision in its earnings estimates, favorable Zacks Rank and a positive Earnings ESP. However, considering its premium valuation and elevated leverage, investors interested in this stock should wait until next Tuesday.
© 2024 Benzinga.com. Benzinga does not provide investment advice. All rights reserved.
Rocket Lab USA Unusual Options Activity For October 16
Financial giants have made a conspicuous bullish move on Rocket Lab USA. Our analysis of options history for Rocket Lab USA RKLB revealed 11 unusual trades.
Delving into the details, we found 54% of traders were bullish, while 45% showed bearish tendencies. Out of all the trades we spotted, 6 were puts, with a value of $309,100, and 5 were calls, valued at $383,310.
What’s The Price Target?
Analyzing the Volume and Open Interest in these contracts, it seems that the big players have been eyeing a price window from $7.0 to $20.0 for Rocket Lab USA during the past quarter.
Volume & Open Interest Trends
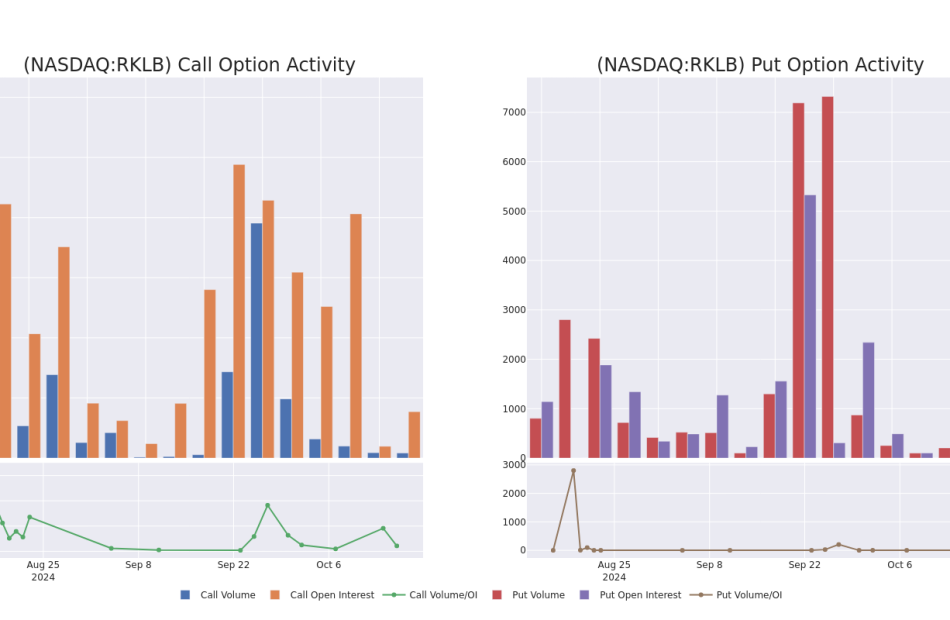
Examining the volume and open interest provides crucial insights into stock research. This information is key in gauging liquidity and interest levels for Rocket Lab USA’s options at certain strike prices. Below, we present a snapshot of the trends in volume and open interest for calls and puts across Rocket Lab USA’s significant trades, within a strike price range of $7.0 to $20.0, over the past month.
Rocket Lab USA Option Activity Analysis: Last 30 Days

Biggest Options Spotted:
| Symbol | PUT/CALL | Trade Type | Sentiment | Exp. Date | Ask | Bid | Price | Strike Price | Total Trade Price | Open Interest | Volume |
|---|---|---|---|---|---|---|---|---|---|---|---|
| RKLB | CALL | TRADE | BULLISH | 04/17/25 | $2.95 | $2.8 | $2.9 | $10.00 | $145.0K | 3.0K | 567 |
| RKLB | PUT | TRADE | BEARISH | 06/20/25 | $1.0 | $0.9 | $0.98 | $7.00 | $98.0K | 101 | 1.1K |
| RKLB | CALL | TRADE | BULLISH | 06/20/25 | $3.3 | $3.3 | $3.3 | $10.00 | $74.2K | 1.1K | 225 |
| RKLB | CALL | TRADE | BULLISH | 01/16/26 | $5.5 | $5.4 | $5.5 | $7.00 | $74.2K | 9.6K | 198 |
| RKLB | PUT | TRADE | BEARISH | 01/15/27 | $11.7 | $11.7 | $11.7 | $20.00 | $58.5K | 203 | 90 |
About Rocket Lab USA
Rocket Lab USA Inc is engaged in space, building rockets, and spacecraft. It provides end-to-end mission services that provide frequent and reliable access to space for civil, defense, and commercial markets. It designs and manufactures the Electron and Neutron launch vehicles and Photon satellite platform. Rocket Lab’s Electron launch vehicle has delivered multiple satellites to orbit for private and public sector organizations, enabling operations in national security, scientific research, space debris mitigation, Earth observation, climate monitoring, and communications. The business operates in two segments being Launch Services and Space systems. Geographically it serves Japan, Germany, rest of the world and earns key revenue from the United States.
Where Is Rocket Lab USA Standing Right Now?
- With a trading volume of 11,296,525, the price of RKLB is up by 9.61%, reaching $10.89.
- Current RSI values indicate that the stock is may be overbought.
- Next earnings report is scheduled for 27 days from now.
What Analysts Are Saying About Rocket Lab USA
A total of 4 professional analysts have given their take on this stock in the last 30 days, setting an average price target of $7.5.
Turn $1000 into $1270 in just 20 days?
20-year pro options trader reveals his one-line chart technique that shows when to buy and sell. Copy his trades, which have had averaged a 27% profit every 20 days. Click here for access.
* Consistent in their evaluation, an analyst from Keybanc keeps a Overweight rating on Rocket Lab USA with a target price of $11.
* In a cautious move, an analyst from Cantor Fitzgerald downgraded its rating to Overweight, setting a price target of $7.
* An analyst from Goldman Sachs persists with their Neutral rating on Rocket Lab USA, maintaining a target price of $5.
* In a cautious move, an analyst from Cantor Fitzgerald downgraded its rating to Overweight, setting a price target of $7.
Trading options involves greater risks but also offers the potential for higher profits. Savvy traders mitigate these risks through ongoing education, strategic trade adjustments, utilizing various indicators, and staying attuned to market dynamics. Keep up with the latest options trades for Rocket Lab USA with Benzinga Pro for real-time alerts.
Market News and Data brought to you by Benzinga APIs
© 2024 Benzinga.com. Benzinga does not provide investment advice. All rights reserved.

