AMD Gains Momentum With AI: Can It Beat Expectations?
Advanced Micro Devices AMD is gaining traction with AI. NVIDIA remains the leader because of its first-mover advantage, but there are other significant players, and AMD is the leader. While NVIDIA commands an estimated 95% of the AI data center market, AMD carries most of the remainder and can regain the share lost due to NVIDIA’s boom. That’s worth more than 1000 basis points in market share growth on top of robust organic industry growth to drive revenue, earnings, and shareholder value. Industry growth is still accelerating. AMD CEO Lisu Su upped her estimates at the investor day event, expecting a 60% CAGR over the next five years.
Aside from company commentary, there is solid evidence of the demand for AMD AI-oriented chips. Companies from Hewlett Packard Enterprises HPE to Meta Platforms META and Oracle ORCL are using large quantities of them to build out enterprise-quality HPC applications requiring the lowest latency. Oracle’s news includes a supercluster that can link over 16,000 MI300Xs, using a suite of tools provided by AMD to operate them. Hewlett Packard Enterprise will package eight MI325X and two EPYC CPUs into its latest servers, the HPE Proliant XD685, for AI service providers and large model builders.
The suite of tools is critical to AMD’s success; the ROCm suite is comparable to NVIDIA’s CUDA, allowing programmers to harness the power of its GPUs for AI computing needs. The takeaway is that NVIDIA was first to the game. Still, AMD is positioned to catch up and will post accelerating results, outpacing consensus figures and driving shareholder value over the next four to eight quarters.
AMD Sets Low Bar With Q3 Guidance Despite 15% Growth Forecast
AMD’s Q3 guidance is solid but sets a low bar to clear. The company forecasted $6.71 billion in net sales, a 15% gain and an acceleration from the previous quarter but slower than the pace of industry growth and AI peers. AMD growth will be supported by the data center segment, which grew at a triple-digit pace in Q2 and is expected to be sustained in Q3, offset by slower client segment growth and gaming segment normalization.
The data center is an increasingly important business segment, growing to nearly 50% of revenue in the year’s first half, and contribution gains are expected to continue. Gaming revenue is likely to fall in Q3 compared to last year, but the headwind is diminishing. The pace of contraction should slow in Q3 and Q4 and revert to growth in 2025, becoming a tailwind for the business. Among the risks for AMD investors is government regulation. The U.S. government is considering export bans to risky countries to limit the spread of AI capability among bad actors, potentially limiting the global addressable market.
The guidance will drive the market regardless of growth and outperformance in Q3. The consensus for the year implies another 15% gain in revenue and a widening margin, likely underestimating demand for AMD products. Among the calendar Q3 news highlights is the launch of Ryzen AI Pro 300 series chips designed to enhance Microsoft Copilot AI Assist. The chips are 40% faster than the leading competition. They are expected to increase enterprise workload productivity by up to 14%, which is a compelling factor for IT budget managers and business planning. Other highlights include the Turin EPYC data center CPUs that rival NVIDIA’s Blackwell, which is expected to launch in Q1 2025.
Analysts Eye AMD’s Q3 Report as a Catalyst for Recovery
Analysts have been raising their estimates for AMD’s stock price while lowering estimates for earnings. The consensus is up more than 40% since late 2023 and rising ahead of the Q3 earnings release, forecasting a nearly 20% upside from the $160 level. The latest updates reaffirm targets raised following the Q2 release and put the stock in the $180 to $200 range to align with the consensus. A solid earnings report should catalyze the market to move higher.
The price action in AMD stock is tepid following the October investor day and product announcements. The market is falling, down nearly 10% from the recent peak, and may continue to fall until the earnings report is released. The critical support target is near $152.50 and will likely be reached soon, providing an attractive entry point for traders and investors. If market support is not sustained at that level and a lower low is set, a move to $140 is likely, and $120 is possible.

The article “AMD Gains Momentum With AI: Can It Beat Expectations?” first appeared on MarketBeat.
Market News and Data brought to you by Benzinga APIs
© 2024 Benzinga.com. Benzinga does not provide investment advice. All rights reserved.
Uranium Energy Unusual Options Activity For October 16
Investors with a lot of money to spend have taken a bearish stance on Uranium Energy UEC.
And retail traders should know.
We noticed this today when the trades showed up on publicly available options history that we track here at Benzinga.
Whether these are institutions or just wealthy individuals, we don’t know. But when something this big happens with UEC, it often means somebody knows something is about to happen.
So how do we know what these investors just did?
Today, Benzinga‘s options scanner spotted 10 uncommon options trades for Uranium Energy.
This isn’t normal.
The overall sentiment of these big-money traders is split between 30% bullish and 60%, bearish.
Out of all of the special options we uncovered, 3 are puts, for a total amount of $82,500, and 7 are calls, for a total amount of $374,700.
Predicted Price Range
After evaluating the trading volumes and Open Interest, it’s evident that the major market movers are focusing on a price band between $2.5 and $10.0 for Uranium Energy, spanning the last three months.
Volume & Open Interest Trends
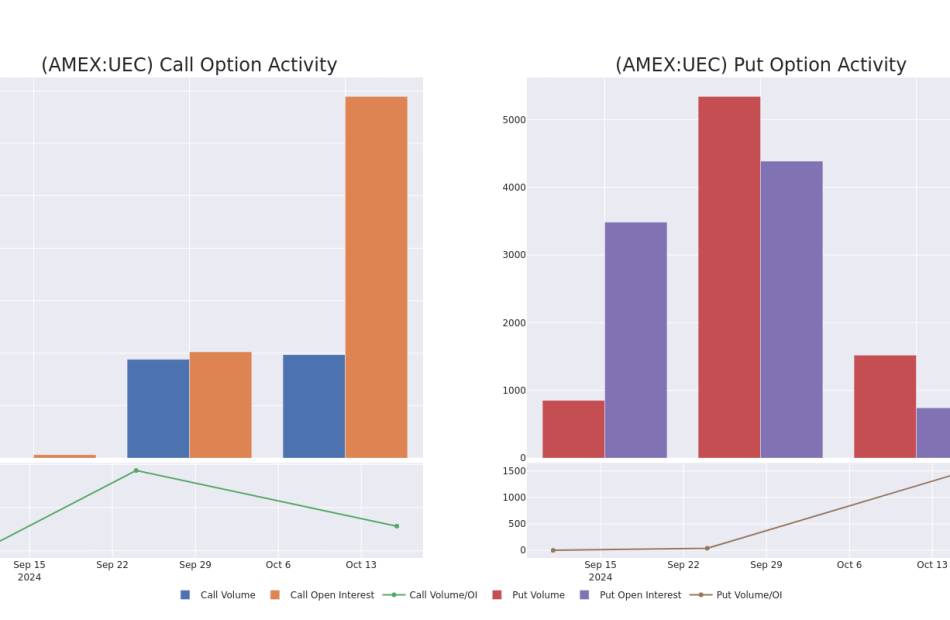
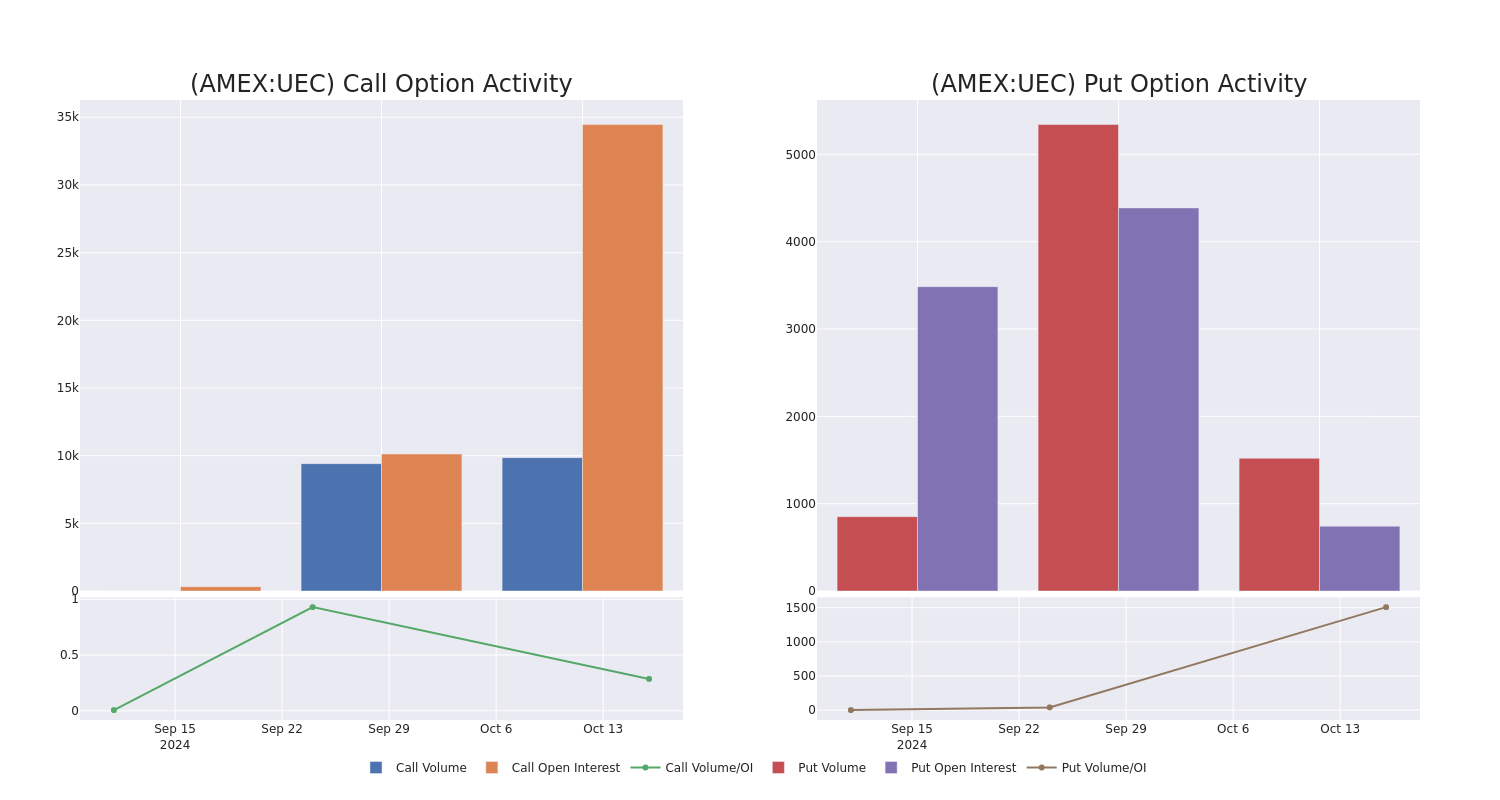
Examining the volume and open interest provides crucial insights into stock research. This information is key in gauging liquidity and interest levels for Uranium Energy’s options at certain strike prices. Below, we present a snapshot of the trends in volume and open interest for calls and puts across Uranium Energy’s significant trades, within a strike price range of $2.5 to $10.0, over the past month.
Uranium Energy Option Volume And Open Interest Over Last 30 Days
Largest Options Trades Observed:
| Symbol | PUT/CALL | Trade Type | Sentiment | Exp. Date | Ask | Bid | Price | Strike Price | Total Trade Price | Open Interest | Volume |
|---|---|---|---|---|---|---|---|---|---|---|---|
| UEC | CALL | TRADE | BULLISH | 01/17/25 | $5.2 | $4.5 | $5.1 | $2.50 | $101.9K | 482 | 200 |
| UEC | CALL | SWEEP | BEARISH | 11/15/24 | $1.25 | $1.2 | $1.2 | $7.00 | $60.0K | 7.6K | 822 |
| UEC | CALL | TRADE | BEARISH | 11/15/24 | $1.25 | $1.15 | $1.15 | $7.00 | $57.5K | 7.6K | 1.3K |
| UEC | CALL | SWEEP | BEARISH | 01/17/25 | $0.55 | $0.5 | $0.5 | $9.00 | $50.0K | 877 | 1.0K |
| UEC | CALL | SWEEP | BEARISH | 01/17/25 | $0.45 | $0.4 | $0.4 | $10.00 | $40.1K | 25.4K | 2.4K |
About Uranium Energy
Uranium Energy Corp is engaged in uranium mining and related activities. The company is working towards fueling the demand for carbon-free nuclear energy, a key solution to climate change, and energy source for the low-carbon future. The company is advancing its next generation of low-cost, environmentally friendly, in-situ recovery (ISR) mining uranium projects. The company has two extraction-ready ISR hub and spoke platforms in South Texas and Wyoming. UEC also has seven U.S. ISR uranium projects with all of their permits in place, with additional diversified holdings of uranium assets across the U.S., Canada and Paraguay.
In light of the recent options history for Uranium Energy, it’s now appropriate to focus on the company itself. We aim to explore its current performance.
Uranium Energy’s Current Market Status
- With a trading volume of 12,278,005, the price of UEC is up by 8.51%, reaching $7.96.
- Current RSI values indicate that the stock is may be overbought.
- Next earnings report is scheduled for 13 days from now.
Professional Analyst Ratings for Uranium Energy
In the last month, 2 experts released ratings on this stock with an average target price of $9.875.
Turn $1000 into $1270 in just 20 days?
20-year pro options trader reveals his one-line chart technique that shows when to buy and sell. Copy his trades, which have had averaged a 27% profit every 20 days. Click here for access.
* Maintaining their stance, an analyst from Roth MKM continues to hold a Buy rating for Uranium Energy, targeting a price of $9.
* In a cautious move, an analyst from HC Wainwright & Co. downgraded its rating to Buy, setting a price target of $10.
Trading options involves greater risks but also offers the potential for higher profits. Savvy traders mitigate these risks through ongoing education, strategic trade adjustments, utilizing various indicators, and staying attuned to market dynamics. Keep up with the latest options trades for Uranium Energy with Benzinga Pro for real-time alerts.
Market News and Data brought to you by Benzinga APIs
© 2024 Benzinga.com. Benzinga does not provide investment advice. All rights reserved.
If I Could Only Buy 2 Stocks in the Last Half of 2024, I'd Pick These
There are many intriguing stocks out there, and that often makes it very difficult to choose just one or two. After all, most people can’t afford to buy every stock that looks attractive — just like you can’t afford to pick up every item you like on a trip to your favorite store. But that’s OK. It’s perfectly fine to select one or two fantastic stocks when you can. This small move should put you on the road to building a rock-solid portfolio. And eventually, this strategy will help you reach the goal of owning dozens of truly great companies that could help you grow wealth over the long term.
So, now, considering this, I’ll help you along this path by telling you about two of my favorite stocks to buy today. In fact, if I could only buy two stocks in the last half of this year, I’d pick these. That’s because they both trade for reasonable prices considering their future prospects, and they should benefit from an improving economic situation. Let’s check them out.
1. Amazon
Amazon (NASDAQ: AMZN) has already established itself as a leader in two high-growth markets: e-commerce and cloud computing. As an e-commerce giant, the company sells essentials as well as mass merchandise and has built its Prime subscription program to more than 200 million members. This is key because members, paying for advantages like free same-day and one-day delivery, are likely to use the service as often as they can to get their money’s worth.
And Amazon is making sure they’ll want to stay by keeping prices low and making delivery faster than ever. High member-retention rates suggest these efforts are working. In the first three months of last year, 97% of Prime members renewed for a year, according to Statista. Moving forward, in an environment of lower interest rates, customers’ buying power should improve, and that’s great news for this e-commerce powerhouse.
On top of this, Amazon Web Services (AWS) continues to be the company’s profit driver, and its investment in artificial intelligence (AI) has helped AWS recently reach a more-than $105 billion annual-revenue run rate. And it’s important to remember Amazon as a whole brings in billions of dollars in revenue and profit annually.
All of this makes the stock look reasonably priced at 39 times forward-earnings estimates.
2. Carnival
Carnival (NYSE: CCL) (NYSE: CUK) struggled in the early days of the pandemic, as a temporary halt to cruising operations led to losses — and a widening of debt. But in recent years, the company has made tremendous progress in turning things around and has proven that cruising is still a vacation favorite.
In the most recent quarter, the world’s biggest cruise operator announced record after record. Third-quarter revenue reached a high of $7.9 billion, while operating income hit a record $2.2 billion. To illustrate just how much travelers love cruising, the cumulative advanced-booked position for 2025 is ahead of the 2024 record — and this is at higher pricing levels.
Carnival has achieved these results by making many key moves, such as replacing older ships with new, fuel-efficient ones, reducing the number of new ship orders, and designing fuel-efficient routes. The company also has put a focus on paying down debt, and since the start of 2023 has prepaid more than $7 billion. All of this is helping Carnival sail toward its goal of investment-grade status by the end of 2026.
Demand for Carnival’s cruises already has taken off, but a lower interest rate environment — on the horizon thanks to a recent rate cut by the Federal Reserve — should support demand. And lower rates should also lower the cost of Carnival’s variable-rate borrowings.
Today, Carnival trades for about 15 times forward-earnings estimates, a fair price to pay for this market giant that’s showing it has what it takes not only to recover but to deliver significant growth.
Don’t miss this second chance at a potentially lucrative opportunity
Ever feel like you missed the boat in buying the most successful stocks? Then you’ll want to hear this.
On rare occasions, our expert team of analysts issues a “Double Down” stock recommendation for companies that they think are about to pop. If you’re worried you’ve already missed your chance to invest, now is the best time to buy before it’s too late. And the numbers speak for themselves:
-
Amazon: if you invested $1,000 when we doubled down in 2010, you’d have $21,266!*
-
Apple: if you invested $1,000 when we doubled down in 2008, you’d have $43,047!*
-
Netflix: if you invested $1,000 when we doubled down in 2004, you’d have $389,794!*
Right now, we’re issuing “Double Down” alerts for three incredible companies, and there may not be another chance like this anytime soon.
*Stock Advisor returns as of October 14, 2024
John Mackey, former CEO of Whole Foods Market, an Amazon subsidiary, is a member of The Motley Fool’s board of directors. Adria Cimino has positions in Amazon. The Motley Fool has positions in and recommends Amazon. The Motley Fool recommends Carnival Corp. The Motley Fool has a disclosure policy.
If I Could Only Buy 2 Stocks in the Last Half of 2024, I’d Pick These was originally published by The Motley Fool
A Preview Of Snap-on's Earnings
Snap-on SNA is gearing up to announce its quarterly earnings on Thursday, 2024-10-17. Here’s a quick overview of what investors should know before the release.
Analysts are estimating that Snap-on will report an earnings per share (EPS) of $4.59.
The market awaits Snap-on’s announcement, with hopes high for news of surpassing estimates and providing upbeat guidance for the next quarter.
It’s important for new investors to understand that guidance can be a significant driver of stock prices.
Past Earnings Performance
During the last quarter, the company reported an EPS missed by $0.03, leading to a 0.13% increase in the share price on the subsequent day.
Here’s a look at Snap-on’s past performance and the resulting price change:
| Quarter | Q2 2024 | Q1 2024 | Q4 2023 | Q3 2023 |
|---|---|---|---|---|
| EPS Estimate | 4.94 | 4.64 | 4.66 | |
| EPS Actual | 4.91 | 4.75 | 4.75 | 4.51 |
| Price Change % | 0.0% | 3.0% | -1.0% | 0.0% |
Stock Performance
Shares of Snap-on were trading at $295.68 as of October 15. Over the last 52-week period, shares are up 18.1%. Given that these returns are generally positive, long-term shareholders should be satisfied going into this earnings release.
Insights Shared by Analysts on Snap-on
For investors, staying informed about market sentiments and expectations in the industry is paramount. This analysis provides an exploration of the latest insights on Snap-on.
With 3 analyst ratings, Snap-on has a consensus rating of Outperform. The average one-year price target is $328.67, indicating a potential 11.16% upside.
Analyzing Ratings Among Peers
In this comparison, we explore the analyst ratings and average 1-year price targets of IDEX, Pentair and Stanley Black & Decker, three prominent industry players, offering insights into their relative performance expectations and market positioning.
- IDEX received a Buy consensus from analysts, with an average 1-year price target of $233.57, implying a potential 21.01% downside.
- Pentair is maintaining an Outperform status according to analysts, with an average 1-year price target of $101.27, indicating a potential 65.75% downside.
- The consensus among analysts is an Neutral trajectory for Stanley Black & Decker, with an average 1-year price target of $102.1, indicating a potential 65.47% downside.
Peer Analysis Summary
The peer analysis summary outlines pivotal metrics for IDEX, Pentair and Stanley Black & Decker, demonstrating their respective standings within the industry and offering valuable insights into their market positions and comparative performance.
| Company | Consensus | Revenue Growth | Gross Profit | Return on Equity |
|---|---|---|---|---|
| Snap-on | Outperform | -0.37% | $667.50M | 5.20% |
| IDEX | Buy | -4.61% | $366.80M | 3.89% |
| Pentair | Outperform | 1.55% | $437.90M | 5.51% |
| Stanley Black & Decker | Neutral | -3.23% | $1.14B | -0.13% |
Key Takeaway:
Snap-on is at the top for Revenue Growth with a slight decrease. It is in the middle for Gross Profit. Snap-on is at the top for Return on Equity.
Unveiling the Story Behind Snap-on
Snap-on manufactures premium tools and software for repair professionals. Hand tools are sold through a franchisee-operated mobile van network that serve auto technicians who purchase tools at their own expense. A unique element of its business model is that franchisees bear significant risk, as they must invest in the mobile van, inventory, and software. At the same time, franchisees extend personal credit directly to technicians on an individual tool basis. Snap-on currently operates three segments: repair systems and information, commercial and industrial, and tools. Its finance arm provides financing to franchisees to run their operations, which includes offering loans and leases for mobile vans.
Financial Milestones: Snap-on’s Journey
Market Capitalization: With restricted market capitalization, the company is positioned below industry averages. This reflects a smaller scale relative to peers.
Revenue Challenges: Snap-on’s revenue growth over 3 months faced difficulties. As of 30 June, 2024, the company experienced a decline of approximately -0.37%. This indicates a decrease in top-line earnings. In comparison to its industry peers, the company trails behind with a growth rate lower than the average among peers in the Industrials sector.
Net Margin: Snap-on’s net margin excels beyond industry benchmarks, reaching 21.19%. This signifies efficient cost management and strong financial health.
Return on Equity (ROE): Snap-on’s financial strength is reflected in its exceptional ROE, which exceeds industry averages. With a remarkable ROE of 5.2%, the company showcases efficient use of equity capital and strong financial health.
Return on Assets (ROA): Snap-on’s ROA stands out, surpassing industry averages. With an impressive ROA of 3.52%, the company demonstrates effective utilization of assets and strong financial performance.
Debt Management: With a below-average debt-to-equity ratio of 0.24, Snap-on adopts a prudent financial strategy, indicating a balanced approach to debt management.
To track all earnings releases for Snap-on visit their earnings calendar on our site.
This article was generated by Benzinga’s automated content engine and reviewed by an editor.
Market News and Data brought to you by Benzinga APIs
© 2024 Benzinga.com. Benzinga does not provide investment advice. All rights reserved.
Unpacking the Latest Options Trading Trends in Applied Digital
Investors with a lot of money to spend have taken a bullish stance on Applied Digital APLD.
And retail traders should know.
We noticed this today when the positions showed up on publicly available options history that we track here at Benzinga.
Whether these are institutions or just wealthy individuals, we don’t know. But when something this big happens with APLD, it often means somebody knows something is about to happen.
Today, Benzinga’s options scanner spotted 10 options trades for Applied Digital.
This isn’t normal.
The overall sentiment of these big-money traders is split between 70% bullish and 30%, bearish.
Out of all of the options we uncovered, there was 1 put, for a total amount of $35,255, and 9, calls, for a total amount of $595,670.
Expected Price Movements
Analyzing the Volume and Open Interest in these contracts, it seems that the big players have been eyeing a price window from $6.0 to $16.0 for Applied Digital during the past quarter.
Insights into Volume & Open Interest
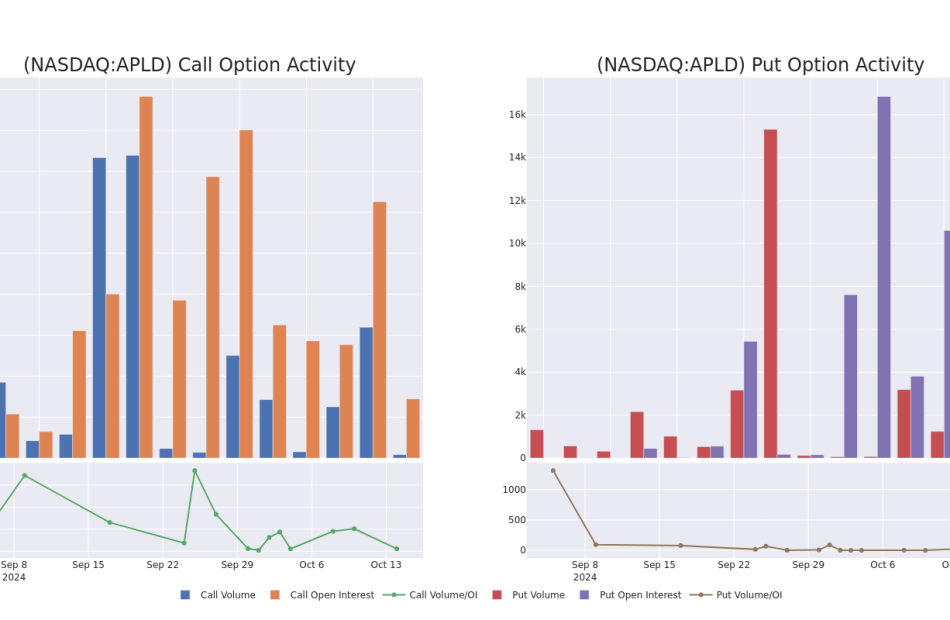
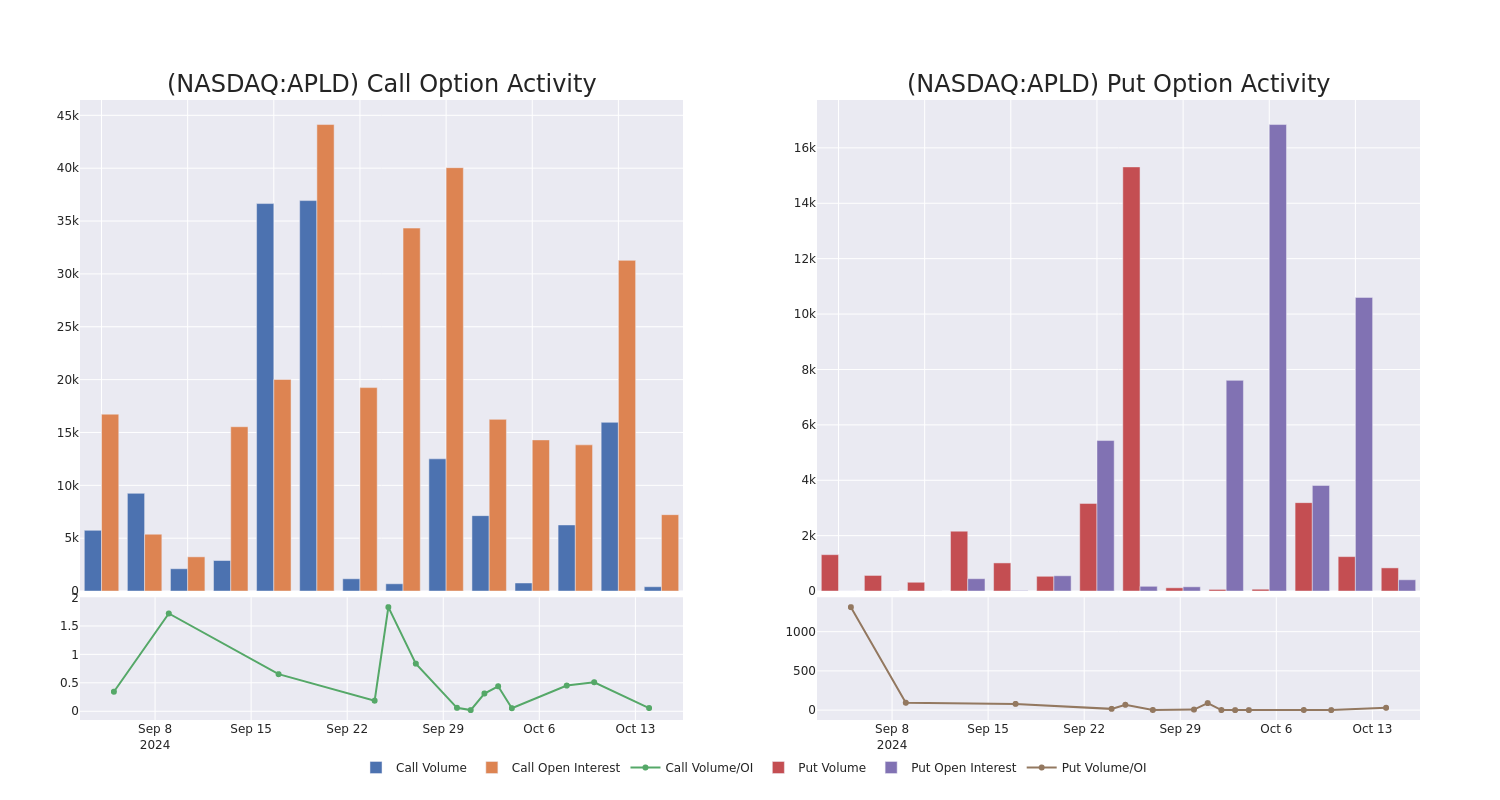
Examining the volume and open interest provides crucial insights into stock research. This information is key in gauging liquidity and interest levels for Applied Digital’s options at certain strike prices. Below, we present a snapshot of the trends in volume and open interest for calls and puts across Applied Digital’s significant trades, within a strike price range of $6.0 to $16.0, over the past month.
Applied Digital Option Volume And Open Interest Over Last 30 Days
Largest Options Trades Observed:
| Symbol | PUT/CALL | Trade Type | Sentiment | Exp. Date | Ask | Bid | Price | Strike Price | Total Trade Price | Open Interest | Volume |
|---|---|---|---|---|---|---|---|---|---|---|---|
| APLD | CALL | SWEEP | BEARISH | 01/17/25 | $2.9 | $2.8 | $2.8 | $6.00 | $98.0K | 1.3K | 362 |
| APLD | CALL | SWEEP | BULLISH | 01/17/25 | $1.5 | $1.4 | $1.5 | $10.00 | $75.0K | 13.7K | 3.0K |
| APLD | CALL | TRADE | BULLISH | 01/17/25 | $1.45 | $1.4 | $1.45 | $10.00 | $72.5K | 13.7K | 1.5K |
| APLD | CALL | TRADE | BULLISH | 01/17/25 | $1.45 | $1.35 | $1.45 | $10.00 | $70.3K | 13.7K | 2.5K |
| APLD | CALL | SWEEP | BULLISH | 01/17/25 | $1.4 | $1.3 | $1.4 | $10.00 | $70.0K | 13.7K | 1.0K |
About Applied Digital
Applied Digital Corp is a designer, developer, and operator of next-generation digital infrastructure across North America. It provides digital infrastructure solutions and cloud services to industries like High-Performance Computing (HPC) and Artificial Intelligence (AI). The company operates in the following business segments; Data Center Hosting Business, Cloud Services Business, and HPC Hosting Business. The majority of its revenue is generated from the Data Center Hosting Business which operates data centers to provide energized space to crypto mining customers.
Having examined the options trading patterns of Applied Digital, our attention now turns directly to the company. This shift allows us to delve into its present market position and performance
Present Market Standing of Applied Digital
- Currently trading with a volume of 10,409,860, the APLD’s price is up by 2.6%, now at $7.49.
- RSI readings suggest the stock is currently may be approaching overbought.
- Anticipated earnings release is in 90 days.
Expert Opinions on Applied Digital
Over the past month, 5 industry analysts have shared their insights on this stock, proposing an average target price of $10.8.
Turn $1000 into $1270 in just 20 days?
20-year pro options trader reveals his one-line chart technique that shows when to buy and sell. Copy his trades, which have had averaged a 27% profit every 20 days. Click here for access.
* In a cautious move, an analyst from Roth MKM downgraded its rating to Buy, setting a price target of $10.
* Reflecting concerns, an analyst from Needham lowers its rating to Buy with a new price target of $11.
* Consistent in their evaluation, an analyst from Craig-Hallum keeps a Buy rating on Applied Digital with a target price of $12.
* An analyst from HC Wainwright & Co. has decided to maintain their Buy rating on Applied Digital, which currently sits at a price target of $10.
* Maintaining their stance, an analyst from Lake Street continues to hold a Buy rating for Applied Digital, targeting a price of $11.
Options trading presents higher risks and potential rewards. Astute traders manage these risks by continually educating themselves, adapting their strategies, monitoring multiple indicators, and keeping a close eye on market movements. Stay informed about the latest Applied Digital options trades with real-time alerts from Benzinga Pro.
Market News and Data brought to you by Benzinga APIs
© 2024 Benzinga.com. Benzinga does not provide investment advice. All rights reserved.
A Glimpse of Home Bancorp's Earnings Potential
Home Bancorp HBCP is gearing up to announce its quarterly earnings on Thursday, 2024-10-17. Here’s a quick overview of what investors should know before the release.
Analysts are estimating that Home Bancorp will report an earnings per share (EPS) of $0.99.
Anticipation surrounds Home Bancorp’s announcement, with investors hoping to hear about both surpassing estimates and receiving positive guidance for the next quarter.
New investors should understand that while earnings performance is important, market reactions are often driven by guidance.
Overview of Past Earnings
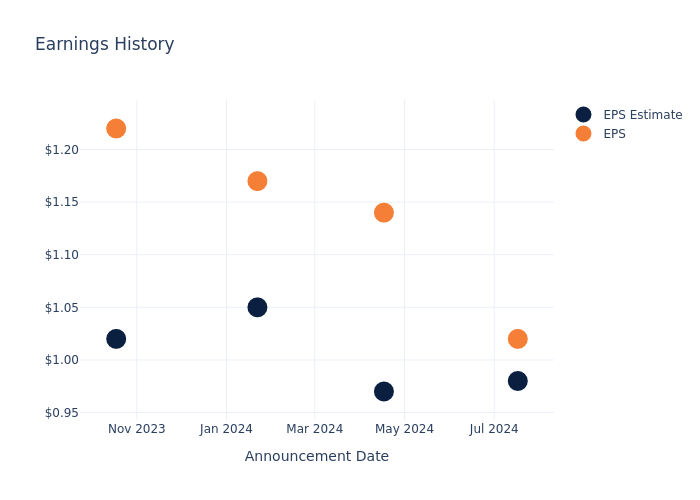
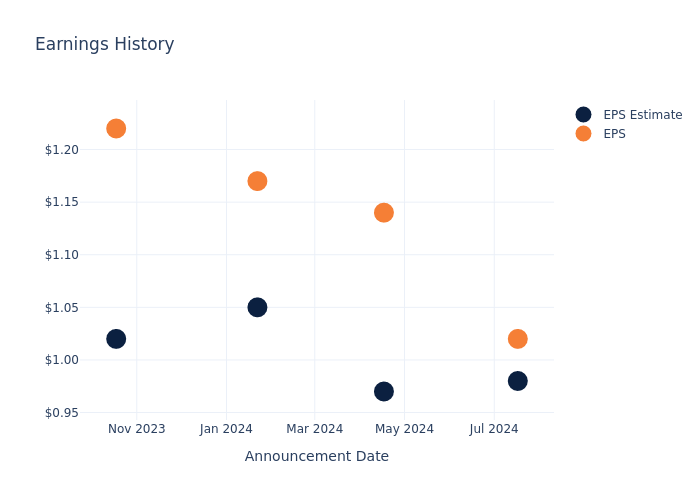
Last quarter the company beat EPS by $0.04, which was followed by a 7.39% drop in the share price the next day.
Here’s a look at Home Bancorp’s past performance and the resulting price change:
| Quarter | Q2 2024 | Q1 2024 | Q4 2023 | Q3 2023 |
|---|---|---|---|---|
| EPS Estimate | 0.98 | 0.97 | 1.05 | 1.02 |
| EPS Actual | 1.02 | 1.14 | 1.17 | 1.22 |
| Price Change % | -7.000000000000001% | -0.0% | 2.0% | 2.0% |
Stock Performance
Shares of Home Bancorp were trading at $43.94 as of October 15. Over the last 52-week period, shares are up 34.24%. Given that these returns are generally positive, long-term shareholders should be satisfied going into this earnings release.
To track all earnings releases for Home Bancorp visit their earnings calendar on our site.
This article was generated by Benzinga’s automated content engine and reviewed by an editor.
Market News and Data brought to you by Benzinga APIs
© 2024 Benzinga.com. Benzinga does not provide investment advice. All rights reserved.
AST SpaceMobile's Options: A Look at What the Big Money is Thinking
Deep-pocketed investors have adopted a bullish approach towards AST SpaceMobile ASTS, and it’s something market players shouldn’t ignore. Our tracking of public options records at Benzinga unveiled this significant move today. The identity of these investors remains unknown, but such a substantial move in ASTS usually suggests something big is about to happen.
We gleaned this information from our observations today when Benzinga’s options scanner highlighted 27 extraordinary options activities for AST SpaceMobile. This level of activity is out of the ordinary.
The general mood among these heavyweight investors is divided, with 44% leaning bullish and 40% bearish. Among these notable options, 2 are puts, totaling $75,240, and 25 are calls, amounting to $1,450,541.
What’s The Price Target?
Based on the trading activity, it appears that the significant investors are aiming for a price territory stretching from $12.5 to $55.0 for AST SpaceMobile over the recent three months.
Insights into Volume & Open Interest
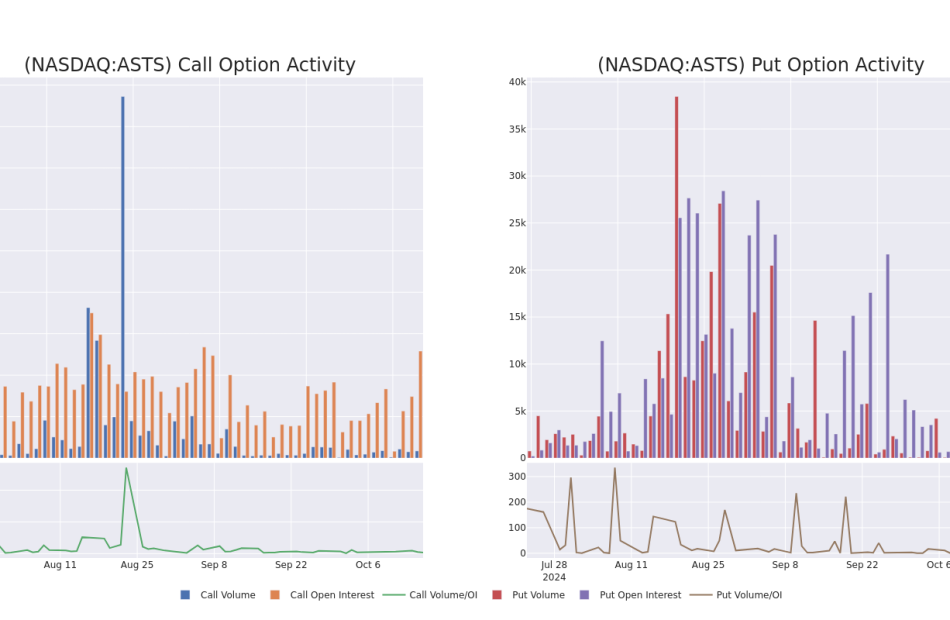
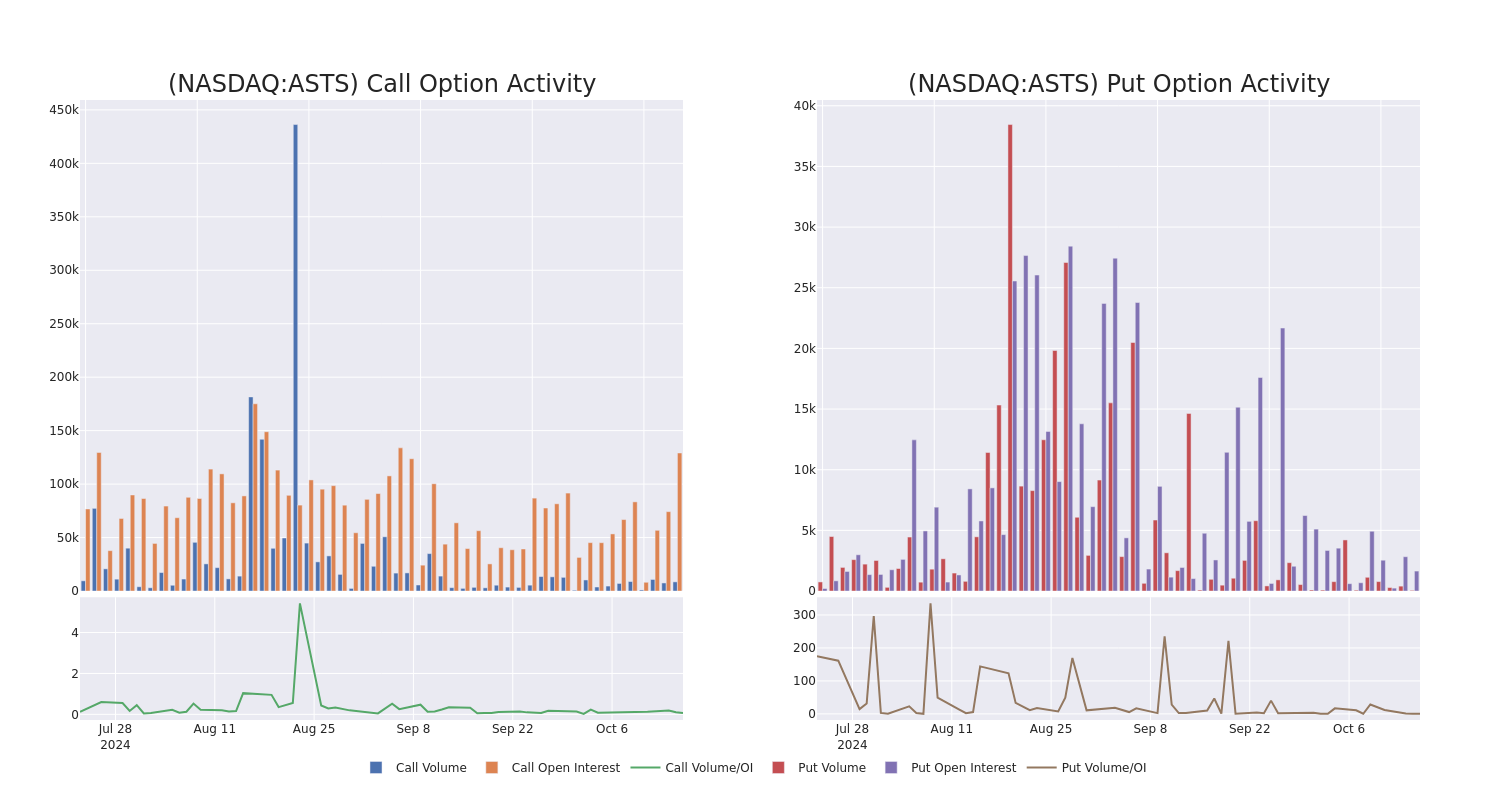
Assessing the volume and open interest is a strategic step in options trading. These metrics shed light on the liquidity and investor interest in AST SpaceMobile’s options at specified strike prices. The forthcoming data visualizes the fluctuation in volume and open interest for both calls and puts, linked to AST SpaceMobile’s substantial trades, within a strike price spectrum from $12.5 to $55.0 over the preceding 30 days.
AST SpaceMobile Option Volume And Open Interest Over Last 30 Days
Largest Options Trades Observed:
| Symbol | PUT/CALL | Trade Type | Sentiment | Exp. Date | Ask | Bid | Price | Strike Price | Total Trade Price | Open Interest | Volume |
|---|---|---|---|---|---|---|---|---|---|---|---|
| ASTS | CALL | SWEEP | BEARISH | 01/16/26 | $17.8 | $17.7 | $17.7 | $12.50 | $184.0K | 19.8K | 131 |
| ASTS | CALL | TRADE | NEUTRAL | 01/16/26 | $17.4 | $17.0 | $17.2 | $15.00 | $168.5K | 8.5K | 187 |
| ASTS | CALL | SWEEP | BEARISH | 01/16/26 | $17.3 | $16.6 | $16.6 | $15.00 | $109.5K | 8.5K | 67 |
| ASTS | CALL | TRADE | BULLISH | 02/21/25 | $3.0 | $2.95 | $3.0 | $45.00 | $85.5K | 490 | 301 |
| ASTS | CALL | SWEEP | BULLISH | 11/15/24 | $6.0 | $5.8 | $6.0 | $22.50 | $82.2K | 4.0K | 597 |
About AST SpaceMobile
AST SpaceMobile Inc is a satellite designer and manufacturer. The company is building a cellular broadband network in space to operate directly with standard, unmodified mobile devices, and off-the-shelf mobile phones based on extensive IP and patent portfolio. It has focused on eliminating the connectivity gaps faced by mobile subscribers and finally bringing broadband to the billions who remain unconnected. The Company’s spaceMobile Service is being designed to provide cost-effective, high-speed Cellular Broadband services to end-users who are out of terrestrial cellular coverage using existing mobile devices.
After a thorough review of the options trading surrounding AST SpaceMobile, we move to examine the company in more detail. This includes an assessment of its current market status and performance.
Current Position of AST SpaceMobile
- Trading volume stands at 7,285,460, with ASTS’s price up by 11.38%, positioned at $27.01.
- RSI indicators show the stock to be may be approaching overbought.
- Earnings announcement expected in 27 days.
Turn $1000 into $1270 in just 20 days?
20-year pro options trader reveals his one-line chart technique that shows when to buy and sell. Copy his trades, which have had averaged a 27% profit every 20 days. Click here for access.
Options trading presents higher risks and potential rewards. Astute traders manage these risks by continually educating themselves, adapting their strategies, monitoring multiple indicators, and keeping a close eye on market movements. Stay informed about the latest AST SpaceMobile options trades with real-time alerts from Benzinga Pro.
Market News and Data brought to you by Benzinga APIs
© 2024 Benzinga.com. Benzinga does not provide investment advice. All rights reserved.
Positive Signal: Joseph B Hayek Shows Faith, Buying $100K In Worthington Enterprises Stock
On October 15, a substantial insider purchase was made by Joseph B Hayek, EVP and CFO at Worthington Enterprises WOR, as per the latest SEC filing.
What Happened: A Form 4 filing from the U.S. Securities and Exchange Commission on Tuesday showed that Hayek purchased 2,500 shares of Worthington Enterprises. The total transaction amounted to $100,525.
In the Tuesday’s morning session, Worthington Enterprises‘s shares are currently trading at $40.7, experiencing a up of 0.87%.
Unveiling the Story Behind Worthington Enterprises
Worthington Enterprises Inc is a designer and manufacturer of products sold to consumers, through retail channels, in the tools, outdoor living and celebrations market categories as well as a wide array of specialized building products that serve customers in the residential and non-residential construction markets, including ceiling suspension systems and light gauge metal framing products, as well as wholly-owned and consolidated operations that produce pressurized containment solutions for heating, cooking and cooling applications, among others. It operates under two reportable operating segments: Consumer Products and Building Products. It derives majority of the revenue from Building Products segment.
Worthington Enterprises’s Financial Performance
Negative Revenue Trend: Examining Worthington Enterprises’s financials over 3 months reveals challenges. As of 31 August, 2024, the company experienced a decline of approximately -17.51% in revenue growth, reflecting a decrease in top-line earnings. When compared to others in the Consumer Discretionary sector, the company faces challenges, achieving a growth rate lower than the average among peers.
Holistic Profitability Examination:
-
Gross Margin: The company faces challenges with a low gross margin of 24.29%, suggesting potential difficulties in cost control and profitability compared to its peers.
-
Earnings per Share (EPS): With an EPS below industry norms, Worthington Enterprises exhibits below-average bottom-line performance with a current EPS of 0.49.
Debt Management: The company maintains a balanced debt approach with a debt-to-equity ratio below industry norms, standing at 0.36.
Valuation Analysis:
-
Price to Earnings (P/E) Ratio: A higher-than-average P/E ratio of 63.05 suggests caution, as the stock may be overvalued in the eyes of investors.
-
Price to Sales (P/S) Ratio: With a relatively high Price to Sales ratio of 1.71 as compared to the industry average, the stock might be considered overvalued based on sales performance.
-
EV/EBITDA Analysis (Enterprise Value to its Earnings Before Interest, Taxes, Depreciation & Amortization): With an EV/EBITDA ratio of 16.22, the company’s market valuation exceeds industry averages.
Market Capitalization: With restricted market capitalization, the company is positioned below industry averages. This reflects a smaller scale relative to peers.
Now trade stocks online commission free with Charles Schwab, a trusted and complete investment firm.
Why Pay Attention to Insider Transactions
Insider transactions, although significant, should be considered within the larger context of market analysis and trends.
Within the legal framework, an “insider” is defined as any officer, director, or beneficial owner holding more than ten percent of a company’s equity securities as per Section 12 of the Securities Exchange Act of 1934. This includes executives in the c-suite and major hedge funds. These insiders are mandated to disclose their transactions through a Form 4 filing, to be submitted within two business days of the transaction.
The initiation of a new purchase by a company insider serves as a strong indication that they expect the stock to rise.
However, insider sells may not always signal a bearish view and can be influenced by various factors.
Unlocking the Meaning of Transaction Codes
Navigating through the landscape of transactions, investors often prioritize those unfolding in the open market, precisely detailed in Table I of the Form 4 filing. A P in Box 3 denotes a purchase, while S signifies a sale. Transaction code C signals the conversion of an option, and transaction code A denotes a grant, award, or other acquisition of securities from the company.
Check Out The Full List Of Worthington Enterprises’s Insider Trades.
Insider Buying Alert: Profit from C-Suite Moves
Benzinga Edge reveals every insider trade in real-time. Don’t miss the next big stock move driven by insider confidence. Unlock this ultimate sentiment indicator now. Click here for access.
This article was generated by Benzinga’s automated content engine and reviewed by an editor.
Market News and Data brought to you by Benzinga APIs
© 2024 Benzinga.com. Benzinga does not provide investment advice. All rights reserved.


