Crude Oil Tumbles 5%; Goldman Sachs Earnings Top Views
U.S. stocks traded lower midway through trading, with the Dow Jones index falling around 150 points on Tuesday.
The Dow traded down 0.40% to 42,894.69 while the NASDAQ fell 0.93% to 18,331.05. The S&P 500 also fell, dropping, 0.44% to 5,833.93.
Check This Out: How To Earn $500 A Month From Morgan Stanley Stock Ahead Of Q3 Earnings
Leading and Lagging Sectors
Real estate shares jumped by 1.5% on Tuesday.
In trading on Tuesday, energy shares fell by 2%.
Top Headline
Goldman Sachs Group Inc. GS reported revenue of $12.70 billion for the third quarter, beating the consensus of $11.87 billion.
Sales increased 7% Y/Y, reflecting higher net revenues in Global Banking & Markets and Asset & Wealth Management, partially offset by lower net revenues in Platform Solutions. The U.S. financial services giant reported EPS of $8.40, beating the consensus of $7.03.
Equities Trading UP
- Wolfspeed, Inc. WOLF shares shot up 27% to $14.41 after the company announced it signed a signed a non-binding preliminary memorandum of terms for up to $750 million in proposed direct funding under the CHIPS and Science Act.
- Shares of MeiraGTx Holdings plc MGTX got a boost, surging 13% to $5.24 after safety and tolerability was confirmed in its gene therapy study for Parkinson’s.
- Telefonaktiebolaget LM Ericsson ERIC shares were also up, gaining 11% to $8.35 following a third-quarter earnings beat.
Equities Trading DOWN
- Seelos Therapeutics, Inc. SEEL shares dropped 52% to $1.1663. Seelos Therapeutics announced notice of delisting from Nasdaq and transfer of listing to Over-the-Counter Market.
- Shares of CareDx, Inc CDNA were down 17% to $25.93 as the company reported preliminary results for the third quarter.
- Pineapple Energy Inc. PEGY was down, falling 18% to $0.1028 after the company announced a 1-for-50 reverse stock split.
Commodities
In commodity news, oil traded down 4.9% to $70.19 while gold traded up 0.4% at $2,676.10.
Silver traded up 1.2% to $31.700 on Tuesday, while copper fell 1.4% to $4.3425.
Euro zone
European shares were mostly lower today. The eurozone’s STOXX 600 slipped 0.40%, Germany’s DAX slipped 0.01% and France’s CAC 40 fell 1.10%. Spain’s IBEX 35 Index rose 0.64%, while London’s FTSE 100 fell 0.37%.
Asia Pacific Markets
Asian markets closed mostly lower on Tuesday, with Japan’s Nikkei 225 gaining 0.77%, Hong Kong’s Hang Seng Index falling 3.67%, China’s Shanghai Composite Index dipping 2.53% and India’s BSE Sensex falling 0.19%.
Economics
The NY Empire State Manufacturing Index declined to -11.9 in October from 11.5 in the previous month and topping market estimates of 3.8.
Market News and Data brought to you by Benzinga APIs
© 2024 Benzinga.com. Benzinga does not provide investment advice. All rights reserved.
A Glimpse of Great Southern Bancorp's Earnings Potential
Great Southern Bancorp GSBC is gearing up to announce its quarterly earnings on Wednesday, 2024-10-16. Here’s a quick overview of what investors should know before the release.
Analysts are estimating that Great Southern Bancorp will report an earnings per share (EPS) of $1.26.
Investors in Great Southern Bancorp are eagerly awaiting the company’s announcement, hoping for news of surpassing estimates and positive guidance for the next quarter.
It’s worth noting for new investors that stock prices can be heavily influenced by future projections rather than just past performance.
Historical Earnings Performance
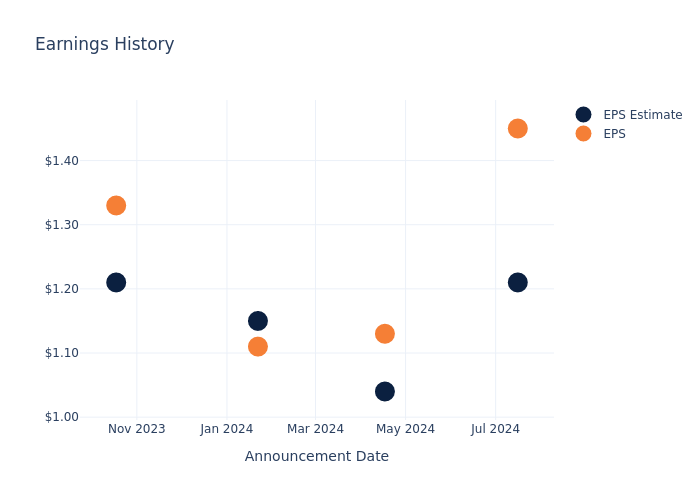
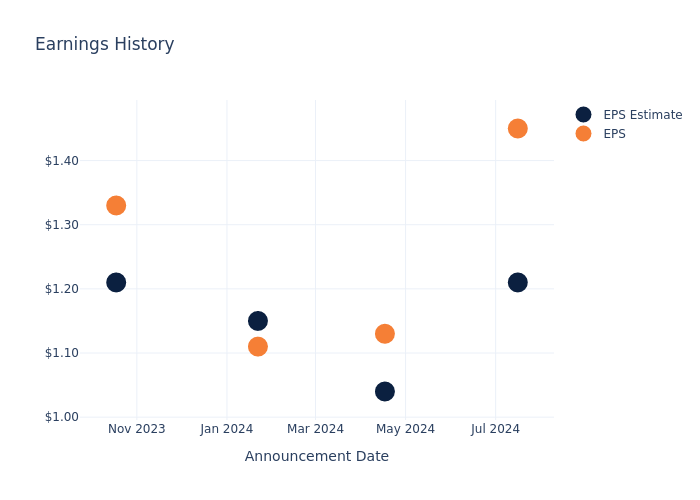
The company’s EPS beat by $0.24 in the last quarter, leading to a 1.14% increase in the share price on the following day.
Here’s a look at Great Southern Bancorp’s past performance and the resulting price change:
| Quarter | Q2 2024 | Q1 2024 | Q4 2023 | Q3 2023 |
|---|---|---|---|---|
| EPS Estimate | 1.21 | 1.04 | 1.15 | 1.21 |
| EPS Actual | 1.45 | 1.13 | 1.11 | 1.33 |
| Price Change % | 1.0% | 2.0% | -5.0% | 1.0% |
Market Performance of Great Southern Bancorp’s Stock
Shares of Great Southern Bancorp were trading at $57.4 as of October 14. Over the last 52-week period, shares are up 23.41%. Given that these returns are generally positive, long-term shareholders are likely bullish going into this earnings release.
To track all earnings releases for Great Southern Bancorp visit their earnings calendar on our site.
This article was generated by Benzinga’s automated content engine and reviewed by an editor.
Market News and Data brought to you by Benzinga APIs
© 2024 Benzinga.com. Benzinga does not provide investment advice. All rights reserved.
Decoding Oklo's Options Activity: What's the Big Picture?
Investors with a lot of money to spend have taken a bullish stance on Oklo OKLO.
And retail traders should know.
We noticed this today when the positions showed up on publicly available options history that we track here at Benzinga.
Whether these are institutions or just wealthy individuals, we don’t know. But when something this big happens with OKLO, it often means somebody knows something is about to happen.
Today, Benzinga’s options scanner spotted 17 options trades for Oklo.
This isn’t normal.
The overall sentiment of these big-money traders is split between 64% bullish and 29%, bearish.
Out of all of the options we uncovered, there was 1 put, for a total amount of $33,000, and 16, calls, for a total amount of $662,618.
What’s The Price Target?
Analyzing the Volume and Open Interest in these contracts, it seems that the big players have been eyeing a price window from $5.0 to $15.0 for Oklo during the past quarter.
Analyzing Volume & Open Interest
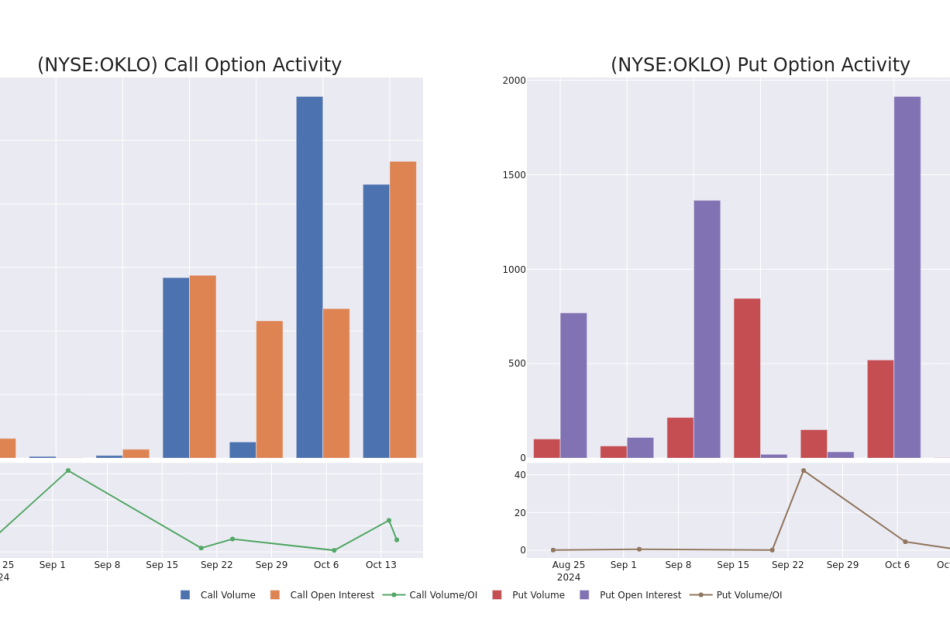
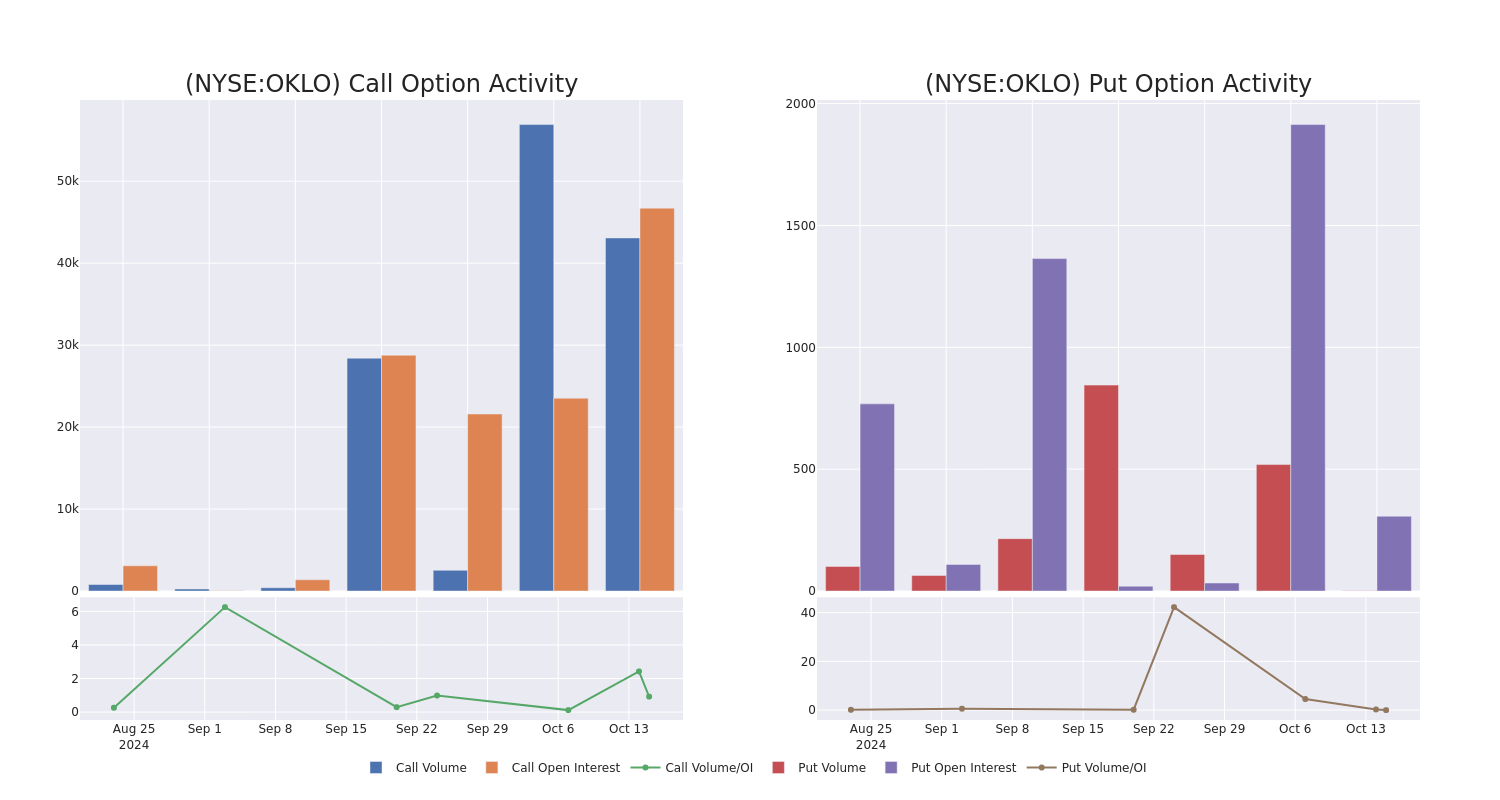
Examining the volume and open interest provides crucial insights into stock research. This information is key in gauging liquidity and interest levels for Oklo’s options at certain strike prices. Below, we present a snapshot of the trends in volume and open interest for calls and puts across Oklo’s significant trades, within a strike price range of $5.0 to $15.0, over the past month.
Oklo Option Volume And Open Interest Over Last 30 Days
Noteworthy Options Activity:
| Symbol | PUT/CALL | Trade Type | Sentiment | Exp. Date | Ask | Bid | Price | Strike Price | Total Trade Price | Open Interest | Volume |
|---|---|---|---|---|---|---|---|---|---|---|---|
| OKLO | CALL | SWEEP | BULLISH | 01/16/26 | $6.7 | $6.0 | $6.68 | $5.00 | $100.4K | 485 | 180 |
| OKLO | CALL | SWEEP | BULLISH | 11/15/24 | $1.5 | $1.35 | $1.5 | $10.00 | $75.0K | 8.4K | 2.0K |
| OKLO | CALL | SWEEP | BEARISH | 11/15/24 | $2.6 | $2.45 | $2.45 | $10.00 | $61.2K | 8.4K | 5.5K |
| OKLO | CALL | SWEEP | BULLISH | 11/15/24 | $1.15 | $1.05 | $1.13 | $12.50 | $58.0K | 2.5K | 2.3K |
| OKLO | CALL | SWEEP | BULLISH | 01/17/25 | $2.2 | $2.0 | $2.15 | $12.50 | $53.5K | 4.5K | 973 |
About Oklo
Oklo Inc is developing advanced fission power plants to provide clean, reliable, and affordable energy at scale. It is pursuing two complementary tracks to address this demand: providing reliable, commercial-scale energy to customers; and selling used nuclear fuel recycling services to the U.S. market. The Company plans to commercialize its liquid metal fast reactor technology with the Aurora powerhouse product line. The first commercial Aurora powerhouse is designed to produce up to 15 megawatts of electricity (MWe) on both recycled nuclear fuel and fresh fuel.
Having examined the options trading patterns of Oklo, our attention now turns directly to the company. This shift allows us to delve into its present market position and performance
Where Is Oklo Standing Right Now?
- With a volume of 13,500,351, the price of OKLO is up 12.25% at $11.27.
- RSI indicators hint that the underlying stock may be overbought.
- Next earnings are expected to be released in 29 days.
Professional Analyst Ratings for Oklo
2 market experts have recently issued ratings for this stock, with a consensus target price of $10.0.
Turn $1000 into $1270 in just 20 days?
20-year pro options trader reveals his one-line chart technique that shows when to buy and sell. Copy his trades, which have had averaged a 27% profit every 20 days. Click here for access.
* In a cautious move, an analyst from B. Riley Securities downgraded its rating to Buy, setting a price target of $10.
* Maintaining their stance, an analyst from Citigroup continues to hold a Neutral rating for Oklo, targeting a price of $10.
Options trading presents higher risks and potential rewards. Astute traders manage these risks by continually educating themselves, adapting their strategies, monitoring multiple indicators, and keeping a close eye on market movements. Stay informed about the latest Oklo options trades with real-time alerts from Benzinga Pro.
Market News and Data brought to you by Benzinga APIs
© 2024 Benzinga.com. Benzinga does not provide investment advice. All rights reserved.
What's Next: Banner's Earnings Preview
Banner BANR is gearing up to announce its quarterly earnings on Wednesday, 2024-10-16. Here’s a quick overview of what investors should know before the release.
Analysts are estimating that Banner will report an earnings per share (EPS) of $1.16.
The announcement from Banner is eagerly anticipated, with investors seeking news of surpassing estimates and favorable guidance for the next quarter.
It’s worth noting for new investors that guidance can be a key determinant of stock price movements.
Earnings History Snapshot
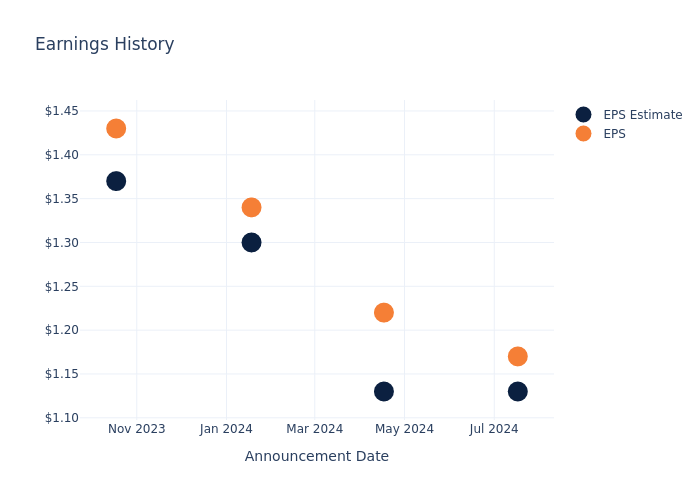
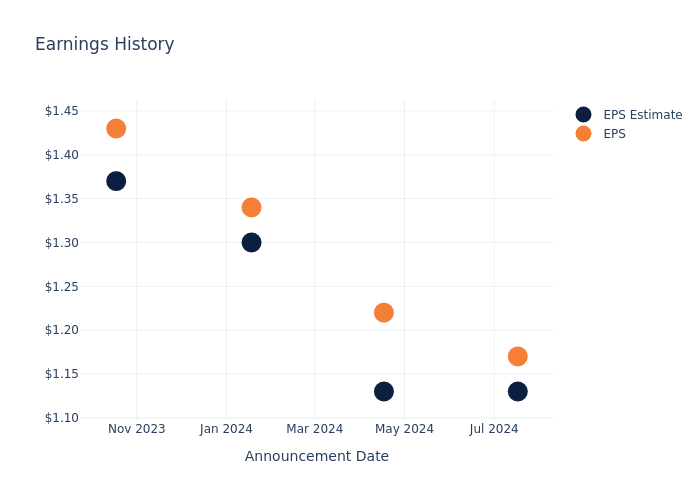
The company’s EPS beat by $0.04 in the last quarter, leading to a 1.35% drop in the share price on the following day.
Here’s a look at Banner’s past performance and the resulting price change:
| Quarter | Q2 2024 | Q1 2024 | Q4 2023 | Q3 2023 |
|---|---|---|---|---|
| EPS Estimate | 1.13 | 1.13 | 1.30 | 1.37 |
| EPS Actual | 1.17 | 1.22 | 1.34 | 1.43 |
| Price Change % | -1.0% | 1.0% | -1.0% | 2.0% |
Stock Performance
Shares of Banner were trading at $64.28 as of October 14. Over the last 52-week period, shares are up 54.57%. Given that these returns are generally positive, long-term shareholders are likely bullish going into this earnings release.
To track all earnings releases for Banner visit their earnings calendar on our site.
This article was generated by Benzinga’s automated content engine and reviewed by an editor.
Market News and Data brought to you by Benzinga APIs
© 2024 Benzinga.com. Benzinga does not provide investment advice. All rights reserved.
D.R. Horton Unusual Options Activity
Investors with significant funds have taken a bearish position in D.R. Horton DHI, a development that retail traders should be aware of.
This was brought to our attention today through our monitoring of publicly accessible options data at Benzinga. The exact nature of these investors remains a mystery, but such a major move in DHI usually indicates foreknowledge of upcoming events.
Today, Benzinga’s options scanner identified 10 options transactions for D.R. Horton. This is an unusual occurrence. The sentiment among these large-scale traders is mixed, with 20% being bullish and 50% bearish. Of all the options we discovered, 9 are puts, valued at $283,812, and there was a single call, worth $48,990.
What’s The Price Target?
After evaluating the trading volumes and Open Interest, it’s evident that the major market movers are focusing on a price band between $185.0 and $195.0 for D.R. Horton, spanning the last three months.
Volume & Open Interest Trends
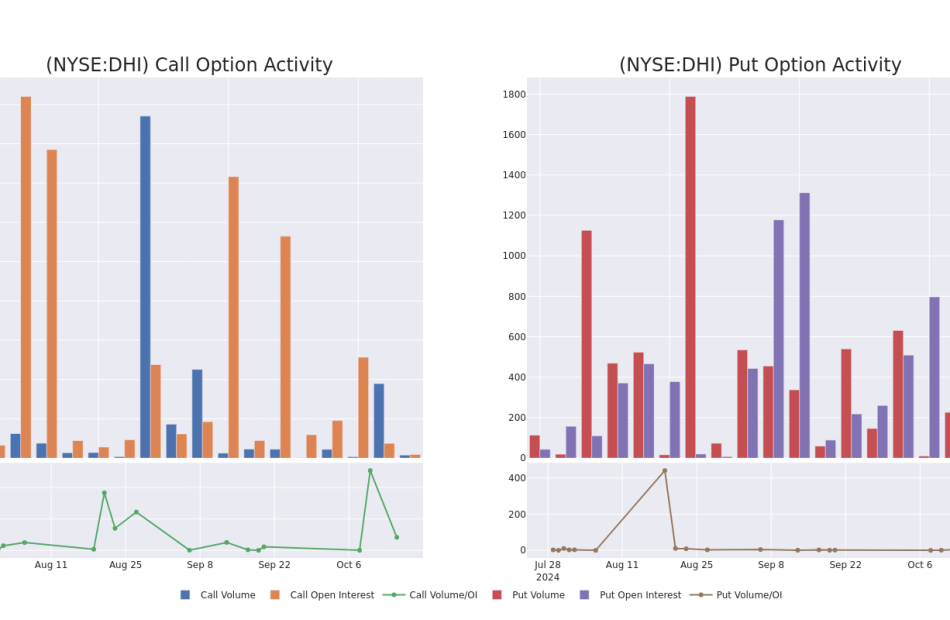
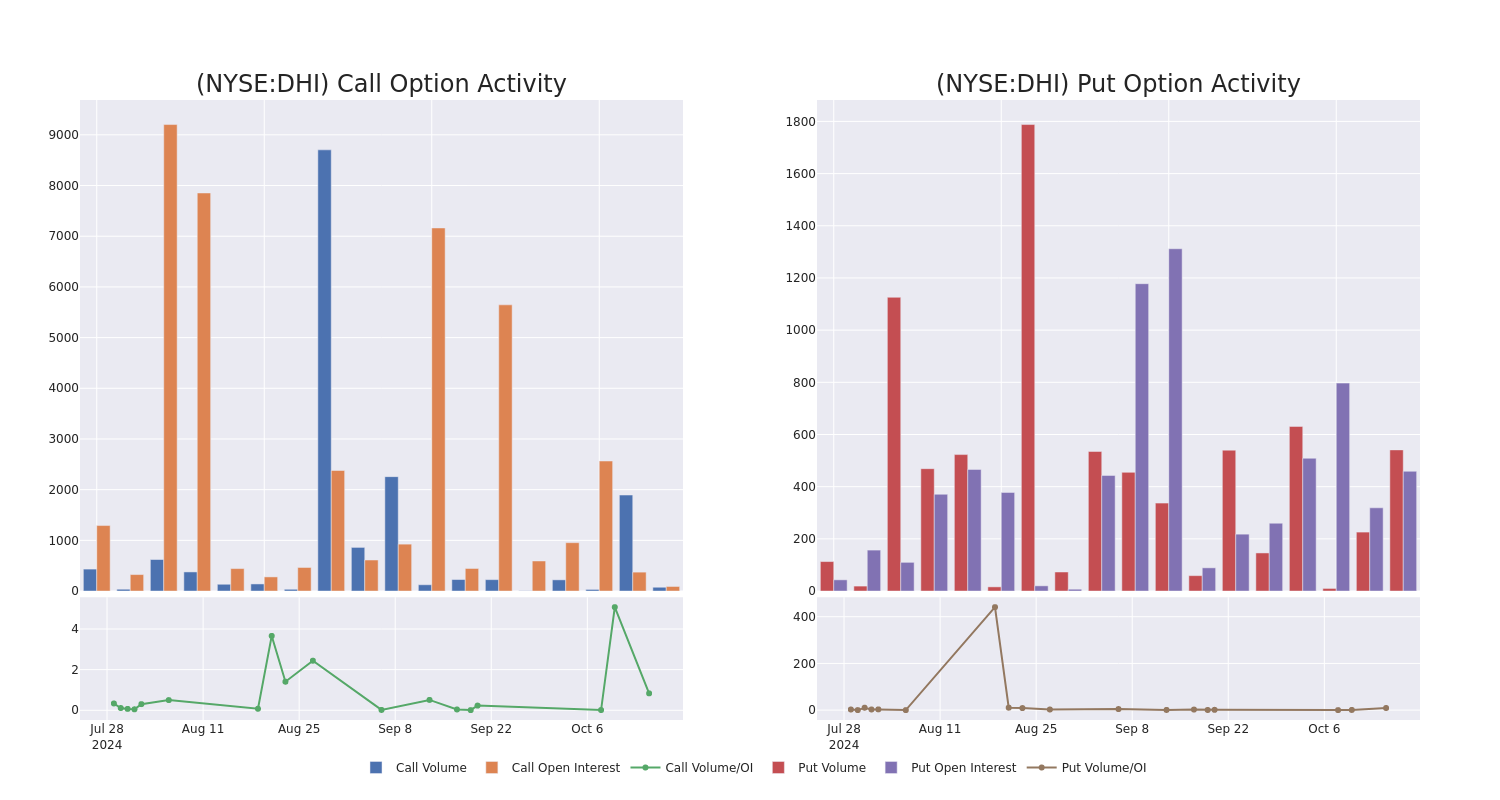
Looking at the volume and open interest is a powerful move while trading options. This data can help you track the liquidity and interest for D.R. Horton’s options for a given strike price. Below, we can observe the evolution of the volume and open interest of calls and puts, respectively, for all of D.R. Horton’s whale trades within a strike price range from $185.0 to $195.0 in the last 30 days.
D.R. Horton Call and Put Volume: 30-Day Overview
Significant Options Trades Detected:
| Symbol | PUT/CALL | Trade Type | Sentiment | Exp. Date | Ask | Bid | Price | Strike Price | Total Trade Price | Open Interest | Volume |
|---|---|---|---|---|---|---|---|---|---|---|---|
| DHI | CALL | TRADE | BEARISH | 10/25/24 | $7.4 | $6.9 | $6.9 | $185.00 | $48.9K | 90 | 75 |
| DHI | PUT | TRADE | NEUTRAL | 11/15/24 | $10.5 | $10.2 | $10.37 | $195.00 | $41.4K | 224 | 5 |
| DHI | PUT | SWEEP | BEARISH | 01/17/25 | $13.7 | $13.4 | $13.8 | $195.00 | $37.2K | 206 | 45 |
| DHI | PUT | SWEEP | BEARISH | 11/15/24 | $10.5 | $10.2 | $10.38 | $195.00 | $36.7K | 224 | 80 |
| DHI | PUT | SWEEP | BEARISH | 01/17/25 | $13.9 | $13.4 | $13.68 | $195.00 | $30.4K | 206 | 67 |
About D.R. Horton
D.R. Horton is a leading homebuilder in the United States with operations in 118 markets across 33 states. D.R. Horton mainly builds single-family detached homes (over 90% of home sales revenue) and offers products to entry-level, move-up, luxury buyers, and active adults. The company offers homebuyers mortgage financing and title agency services through its financial services segment. D.R. Horton’s headquarters are in Arlington, Texas, and it manages six regional segments across the United States.
Having examined the options trading patterns of D.R. Horton, our attention now turns directly to the company. This shift allows us to delve into its present market position and performance
Where Is D.R. Horton Standing Right Now?
- With a trading volume of 763,432, the price of DHI is up by 2.42%, reaching $191.63.
- Current RSI values indicate that the stock is is currently neutral between overbought and oversold.
- Next earnings report is scheduled for 14 days from now.
Expert Opinions on D.R. Horton
1 market experts have recently issued ratings for this stock, with a consensus target price of $215.0.
Unusual Options Activity Detected: Smart Money on the Move
Benzinga Edge’s Unusual Options board spots potential market movers before they happen. See what positions big money is taking on your favorite stocks. Click here for access.
* An analyst from B of A Securities has decided to maintain their Buy rating on D.R. Horton, which currently sits at a price target of $215.
Options are a riskier asset compared to just trading the stock, but they have higher profit potential. Serious options traders manage this risk by educating themselves daily, scaling in and out of trades, following more than one indicator, and following the markets closely.
If you want to stay updated on the latest options trades for D.R. Horton, Benzinga Pro gives you real-time options trades alerts.
Market News and Data brought to you by Benzinga APIs
© 2024 Benzinga.com. Benzinga does not provide investment advice. All rights reserved.
United Airlines Earnings Are Imminent; These Most Accurate Analysts Revise Forecasts Ahead Of Earnings Call
United Airlines Holdings, Inc. UAL will release earnings results for its third quarter before the opening bell on Tuesday, Oct. 15.
Analysts expect the Chicago, Illinois-based bank to report quarterly earnings at $3.17 per share, down from $3.65 per share in the year-ago period. United Airlines projects to report revenue of $14.78 billion for the recent quarter, compared to $14.44 billion a year earlier, according to data from Benzinga Pro.
The company, last week, unveiled its largest international expansion, adding service to eight new cities. Beginning in May 2025, the airline plans to launch five new nonstop flights from its Newark/New York hub to destinations not served by other U.S. airlines.
United Airlines shares gained 2.8% to close at $63.53 on Monday.
Benzinga readers can access the latest analyst ratings on the Analyst Stock Ratings page. Readers can sort by stock ticker, company name, analyst firm, rating change or other variables.
Let’s have a look at how Benzinga’s most-accurate analysts have rated the company in the recent period.
- Susquehanna analyst Christopher Stathoulopoulos maintained a Positive rating and raised the price target from $60 to $70 on Oct. 9. This analyst has an accuracy rate of 75%.
- Jefferies analyst Sheila Kahyaoglu maintained a Buy rating and raised the price target from $69 to $75 on Oct. 2. This analyst has an accuracy rate of 68%.
- Citigroup analyst Stephen Trent maintained a Buy rating and raised the price target from $80 to $96 on May 29. This analyst has an accuracy rate of 70%.
- Raymond James analyst Savanthi Syth maintained an Outperform rating and raised the price target from $66 to $70 on April 18. This analyst has an accuracy rate of 65%.
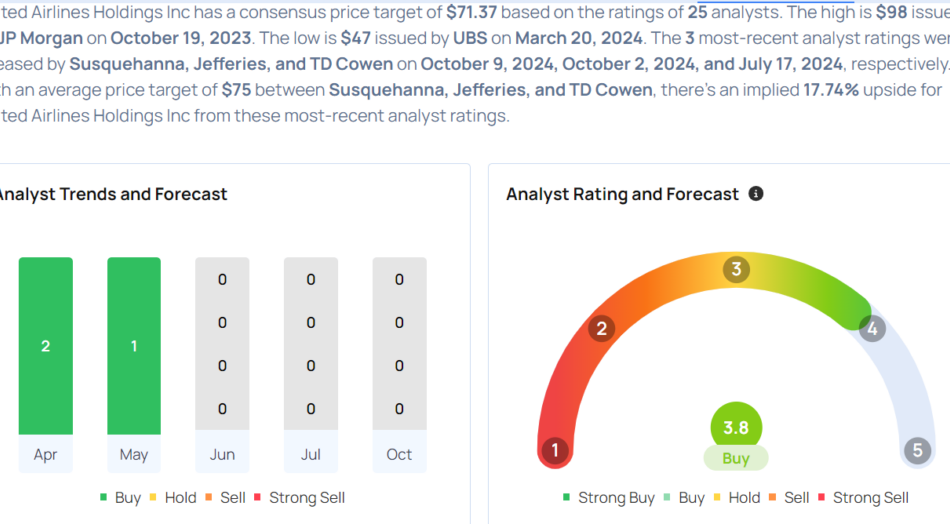
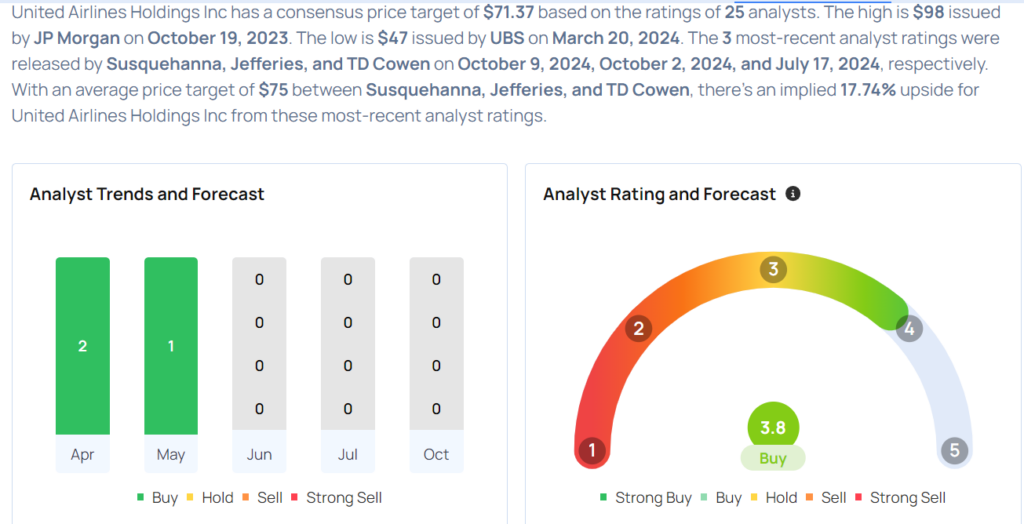
Considering buying UAL stock? Here’s what analysts think:
Read This Next:
Market News and Data brought to you by Benzinga APIs
© 2024 Benzinga.com. Benzinga does not provide investment advice. All rights reserved.
Bluerock Homes Trust (BHM) Announces Fourth Quarter Dividends on Series A Preferred Stock
NEW YORK, Oct. 14, 2024 /PRNewswire/ — Bluerock Homes Trust, Inc. BHM (the “Company”) today announced that its Board of Directors has authorized and the Company has declared monthly cash dividends on the Company’s Series A Redeemable Preferred Stock (the “Series A Preferred Stock”) for the fourth quarter of 2024, equal to a quarterly rate of $0.375 per share (the “Series A Preferred Dividends”).
The Series A Preferred Dividends will be payable in cash as follows: accrued but unpaid dividends of $0.125 per share to be paid on Tuesday, November 5, 2024 to Series A Preferred stockholders of record as of Friday, October 25, 2024; $0.125 per share to be paid on Thursday, December 5, 2024 to Series A Preferred stockholders of record as of Monday, November 25, 2024; and $0.125 per share to be paid on Friday, January 3, 2025 to Series A Preferred stockholders of record as of Tuesday, December 24, 2024. Newly-issued shares of Series A Preferred Stock held for only a portion of each applicable monthly dividend period will receive a prorated Series A Preferred Dividend based on the actual number of days in the applicable dividend period during which each such share of Series A Preferred Stock was outstanding, as permitted under the Articles Supplementary to the Company’s charter dated March 14, 2023.
The Board of Directors has previously authorized, and in connection with the Series A Preferred Dividends the Company has also declared, enhanced special dividends on the Series A Preferred Stock for the fourth quarter of 2024 (the “Series A Preferred Enhanced Special Dividends”), which will be seamlessly aggregated with the regular monthly Series A Preferred Dividends so as to effect a dividend rate of the average one month term Secured Overnight Financing Rate (the “SOFR Rate”) plus 2.0%, subject to a 6.5% minimum and 8.5% maximum annual rate, calculated and paid monthly. The Series A Preferred Enhanced Special Dividends will be calculated based on the SOFR Rate for each day commencing on the 26th day of the prior month and ending on the 25th day of the applicable month, payable on the 5th of each month.
About Bluerock Homes Trust, Inc.
Bluerock Homes Trust, Inc. BHM, headquartered in New York, New York, is an externally managed REIT that owns and operates high-quality single-family properties located in attractive markets with a focus on the knowledge-economy and high quality of life regions of the Sunbelt and high growth areas of the Western United States. BHM’s principal objective is to generate attractive risk-adjusted investment returns by assembling a portfolio of pre-existing single-family rental homes and developing build-to-rent communities. BHM properties are located across a diverse group of growth markets and will seek to target a growing pool of middle-market renters seeking the single-family lifestyle without the upfront and ongoing investments associated with home ownership. For more information, please visit bluerockhomes.com.
Forward Looking Statements
This press release contains forward-looking statements within the meaning of the Private Securities Litigation Reform Act of 1995 and other federal securities laws. These forward-looking statements are based upon the Company’s present expectations, but these statements are not guaranteed to occur. Furthermore, the Company disclaims any obligation to publicly update or revise any forward-looking statement to reflect changes in underlying assumptions or factors, of new information, data or methods, future events or other changes. Investors should not place undue reliance upon forward-looking statements. For further discussion of the factors that could affect outcomes, please refer to the risk factors set forth in Item 1A of the Company’s Annual Report on Form 10-K filed by the Company with the U.S. Securities and Exchange Commission (“SEC”) on March 12, 2024, and subsequent filings by the Company with the SEC. We claim the safe harbor protection for forward looking statements contained in the Private Securities Litigation Reform Act of 1995.
![]() View original content to download multimedia:https://www.prnewswire.com/news-releases/bluerock-homes-trust-bhm-announces-fourth-quarter-dividends-on-series-a-preferred-stock-302275357.html
View original content to download multimedia:https://www.prnewswire.com/news-releases/bluerock-homes-trust-bhm-announces-fourth-quarter-dividends-on-series-a-preferred-stock-302275357.html
SOURCE Bluerock Homes Trust, Inc.
Market News and Data brought to you by Benzinga APIs
© 2024 Benzinga.com. Benzinga does not provide investment advice. All rights reserved.
Ethylene Market is Expected to Develop at a Modest 6% CAGR through 2031 | SkyQuest Technology
Westford, USA, Oct. 15, 2024 (GLOBE NEWSWIRE) — SkyQuest projects that the Ethylene market will attain a value of USD 194.7 billion by 2031, with a CAGR of 6% over the forecast period (2024-2031). Rapidly surging demand for packaged products and growing advancements in packaging technology are projected to augment the demand for ethylene in the near future. The increase in use of ethylene derivatives in multiple industry verticals is also estimated to create new opportunities for ethylene companies in the future.
Download a detailed overview: https://www.skyquestt.com/sample-request/ethylene-market
Browse in-depth TOC on “Ethylene Market” Pages – 197, Tables – 95, Figures – 76
Ethylene Market Report Overview:
| Report Coverage | Details |
| Market Revenue in 2023 | $ 129.5 Billion |
| Estimated Value by 2031 | $ 194.7 Billion |
| Growth Rate | Poised to grow at a CAGR of 6% |
| Forecast Period | 2024–2031 |
| Forecast Units | Value (USD Billion) |
| Report Coverage | Revenue Forecast, Competitive Landscape, Growth Factors, and Trends |
| Segments Covered | Feedstock, Application, End-Use, and Region |
| Geographies Covered | North America, Europe, Asia Pacific, and the Rest of the world |
| Report Highlights | Updated financial information/product portfolio of players |
| Key Market Opportunities | High demand for lightweight materials |
| Key Market Drivers | Growing demand for packaging around the world |
Polyethylene Projected to Account for the Highest Ethylene Demand through 2031
Rapidly surging use of low-density and high-density polyethylene products in multiple industry verticals ranging from packaging to automotive are slated to help the dominance of this segment. High demand for lightweight products in different industry verticals is also expected to help ethylene companies generate substantial revenue in the future. Emphasis on sustainability is also a key factor promoting the demand for low-density polyethylene products.
Demand for Ethylene in Automobile Industry is Slated to Surge at a Noteworthy Pace Going Forward
Request Free Customization of this report: https://www.skyquestt.com/speak-with-analyst/ethylene-market
The rising emphasis of vehicle manufacturers on reducing weight to comply with strict emission mandates and improve vehicle efficiency are slated to help promote the use of ethylene in the future. Growing use of lightweight components for manufacturing vehicles and the use of ethylene in engine coolant and antifreeze manufacturing will also create new business scope for ethylene providers in the long run.
Asia Pacific Region Takes the Crown When It Comes to Global Ethylene Demand Outlook
The Asia Pacific region is home to some of the most prominent industrial organizations in the world including a vast range of verticals ranging from food & beverages to automotive. High demand for packaging, rising automotive manufacturing activities, e-commerce boom, and increasing disposable income are some key factors that can directly or indirectly favor the sales of ethylene going forward. India and China are estimated to be the top markets in this region.
Is this report aligned with your requirements? Interested in making a Purchase – https://www.skyquestt.com/buy-now/ethylene-market
Ethylene Market Insights:
Drivers
- High demand for ethylene derivatives
- Rising use of ethylene in packaging products
- Growing demand for packaged products around the world
Restraints
- Fluctuations in raw material pricing and availability
- Stringent regulatory mandates for ethylene use
Prominent Players in Ethylene Market
- Royal Dutch Shell
- ExxonMobil Corporation
- Sinopec
- LyondellBasell Industries N.V.
- Saudi Basic Industries Corporation (SABIC)
- Dow Chemical Company
- Total S.A.
- Chevron Phillips Chemical Company
- Formosa Plastics Corporation
- INEOS Group AG
Key Questions Answered in Ethylene Market Report
- What drives the global Ethylene market growth?
- Who are the leading Ethylene providers in the world?
- Which region leads the demand for Ethylene in the world?
This report provides the following insights:
- Analysis of key drivers (high use of ethylene derivatives, growing demand for packaging products), restraints (fluctuations in raw material availability and pricing, strict regulations regarding ethylene use), and opportunities (rising demand for lightweight products in multiple industries), influencing the growth of Ethylene market.
- Market Penetration: All-inclusive analysis of product portfolio of different market players and status of new product launches.
- Product Development/Innovation: Elaborate assessment of R&D activities, new product development, and upcoming trends of the Ethylene market.
- Market Development: Detailed analysis of potential regions where the market has potential to grow.
- Market Diversification: Comprehensive assessment of new product launches, recent developments, and emerging regional markets.
- Competitive Landscape: Detailed analysis of growth strategies, revenue analysis, and product innovation by new and established market players.
Related Reports:
Plastic Market: Global Opportunity Analysis and Forecast, 2024-2031
Coating Resins Market: Global Opportunity Analysis and Forecast, 2024-2031
Green Cement Market: Global Opportunity Analysis and Forecast, 2024-2031
Petrochemicals Market: Global Opportunity Analysis and Forecast, 2024-2031
Toluene Market: Global Opportunity Analysis and Forecast, 2024-2031
About Us:
SkyQuest is an IP focused Research and Investment Bank and Accelerator of Technology and assets. We provide access to technologies, markets and finance across sectors viz. Life Sciences, CleanTech, AgriTech, NanoTech and Information & Communication Technology.
We work closely with innovators, inventors, innovation seekers, entrepreneurs, companies and investors alike in leveraging external sources of R&D. Moreover, we help them in optimizing the economic potential of their intellectual assets. Our experiences with innovation management and commercialization has expanded our reach across North America, Europe, ASEAN and Asia Pacific.
Contact:
Mr. Jagraj Singh
Skyquest Technology
1 Apache Way,
Westford,
Massachusetts 01886
USA (+1) 351-333-4748
Email: sales@skyquestt.com
Visit Our Website: https://www.skyquestt.com/

Market News and Data brought to you by Benzinga APIs
© 2024 Benzinga.com. Benzinga does not provide investment advice. All rights reserved.


