Stock Market Holidays 2024: Is Wall Street Closed For Columbus Day? Yes And No.
↑
X
Is Wall Street Closed On New Year’s Day? These Are The 2024 Stock Market Holidays
The Nasdaq, S&P 500 and Dow industrial indexes have rallied near fresh record highs to start October, following a September rebound. A string of good economic news — including the strong September jobs report and the Federal Reserve’s move toward a rate-cut cycle — have put the market in a healthy position as Q3 results kick off. However, the bond markets will take a quick break for the Columbus Day/Indigenous Peoples’ Day holiday.
The bond markets close on Monday, Oct. 14, then reopen Tuesday to trade normally for the remainder of the week. The New York Stock Exchange and Nasdaq will remain open.
Here is a look at other upcoming stock market holidays.
What Are Stock Market Holidays?
A so-called market holiday is any nonweekend day when the New York Stock Exchange, Nasdaq, or bond markets close for the day. Usually, that holiday is something like Thanksgiving or Christmas.
On some holidays, or days close to them, the stock markets remain open, while the bond markets stay closed or close early. Sometimes, the markets close for national days of mourning, as the New York Stock Exchange and Nasdaq did to honor the late president George H.W. Bush in 2018.
If a given holiday happens to take place on Saturday, the Friday before it typically becomes a stock market holiday. Similarly, markets typically close on the following Monday if the holiday lands on a Sunday.
Regular hours for the New York Stock Exchange and the Nasdaq go from 9:30 a.m. to 4 p.m. ET from Monday to Friday. The markets are closed over the weekends.
Full Stock Market Holidays 2024
The following are the stock market holidays in 2024 when the NYSE, Nasdaq and bond markets are all fully closed:
- Monday, Jan. 15 — Martin Luther King Jr. Day
- Monday, Feb. 19 — Presidents’ Day
- Friday, March 29 — Good Friday
- Monday, May 27 — Memorial Day
- Wednesday, June 19 — Juneteenth
- Thursday, July 4 — Independence Day
- Monday, Sept. 2 — Labor Day
- Thursday, Nov. 28 — Thanksgiving Day
- Wednesday, Dec. 25 — Christmas Day
Below, we also include partial market closures for 2024.
Is The Stock Market Open On New Year’s Day 2024?
The stock market will close on Monday, Jan. 1 to observe the New Year’s Day holiday.
Is The Stock Market Open On Presidents’ Day/Washington’s Birthday?
Stock and bond markets will be closed on Monday Feb. 19, and reopen for normal trade on Tuesday, Feb. 20.
Is The Stock Market Open The Thursday Before Good Friday?
The stock market holds regular hours on March 28, the date on which Maundy Thursday falls in 2024. Bond markets close early, at 2 p.m.
Is The Stock Market Open The Friday Before Memorial Day?
The stock market is open on the Friday before Memorial Day. But the bond markets close early, at 2 p.m.
Is The Stock Market Open On July 3?
U.S. stock markets will be open on July 3, but will close early, at 1 p.m. ET. Bond markets will shut down at 2 p.m.
Is The Stock Market Open On Columbus Day/Indigenous Peoples’ Day?
Yes. The NYSE and the Nasdaq are open on Columbus Day/Indigenous Peoples’ Day, which in 2024 lands on Monday, Oct. 14.
As for the bond markets? Closed that day.
Is The Stock Market Open On Veterans Day?
The bond markets will close for Veterans Day on Nov. 11, 2024.
… And Black Friday?
The stock markets close early, at 1 p.m. ET, on Black Friday, the day after Thanksgiving. Black Friday in 2024 lands on Nov. 29. The bond markets close early, at 2 p.m.
… Christmas Eve?
The stock market will close early at 1 p.m. ET on Tuesday, Dec. 24 for Christmas Eve. The bond markets will close early at 2 p.m. ET.
Is The Stock Market Open New Year’s Eve?
The bond markets will close early at 2 p.m. ET on Tuesday, Dec. 31 for New Year’s Eve. The stock market will hold regular hours for the last day of 2024, before taking New Year’s Day off.
YOU MAY ALSO LIKE:
Best Growth Stocks To Buy And Watch: See Updates To IBD Stock Lists
Looking For The Next Big Stock Market Winners? Start With These 3 Steps
Learn How To Time The Market With IBD’s ETF Market Strategy
Join IBD Live And Learn Top Chart Reading And Trading Techniques From Pros
Futures Mixed After Bulls Run As Markets Mull China Stimulus
US Economists Daron Acemoglu, Simon Johnson And James Robinson Win Nobel Prize For Groundbreaking Research On Global Wealth Inequality
Three U.S.-based economists have been awarded the prestigious Nobel Prize in Economic Sciences for their significant contributions to understanding global wealth inequality.
As per the official press release, U.S.-based economists Daron Acemoglu, Simon Johnson, and James Robinson were awarded the Nobel Prize in Economic Sciences on Monday. The trio was recognized for their groundbreaking research on wealth inequality between nations.
The Nobel Committee highlighted their work on how societies with inadequate legal frameworks and exploitative institutions fail to achieve economic growth. Acemoglu and Johnson are professors at the Massachusetts Institute of Technology, while Robinson is the director of the University of Chicago’s Pearson Institute.
Their influential 2012 book, “Why Nations Fail: The Origins of Power, Prosperity, and Poverty,” delves into the roots of inequality and the factors that enable some countries to thrive. Jakob Svensson from Stockholm University praised their empirical and theoretical contributions to understanding global inequality.
The winners will share the prize money of 11 million Swedish kronor ($1.058 million), awarded by the Swedish central bank. This award, formally known as the “Sveriges Riksbank Prize in Economic Sciences in Memory of Alfred Nobel,” was first introduced in 1968.
Read Next:
Image via Wikimedia Commons
This story was generated using Benzinga Neuro and edited by Pooja Rajkumari
Market News and Data brought to you by Benzinga APIs
© 2024 Benzinga.com. Benzinga does not provide investment advice. All rights reserved.
Market Whales and Their Recent Bets on BAC Options
Financial giants have made a conspicuous bullish move on Bank of America. Our analysis of options history for Bank of America BAC revealed 18 unusual trades.
Delving into the details, we found 50% of traders were bullish, while 44% showed bearish tendencies. Out of all the trades we spotted, 5 were puts, with a value of $381,663, and 13 were calls, valued at $515,136.
Expected Price Movements
Based on the trading activity, it appears that the significant investors are aiming for a price territory stretching from $28.0 to $43.5 for Bank of America over the recent three months.
Analyzing Volume & Open Interest
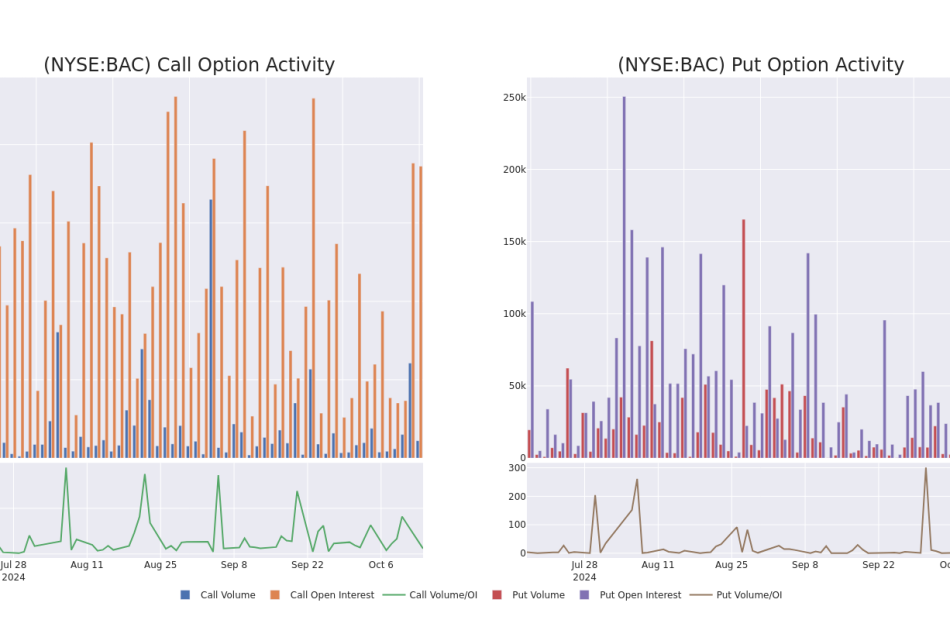
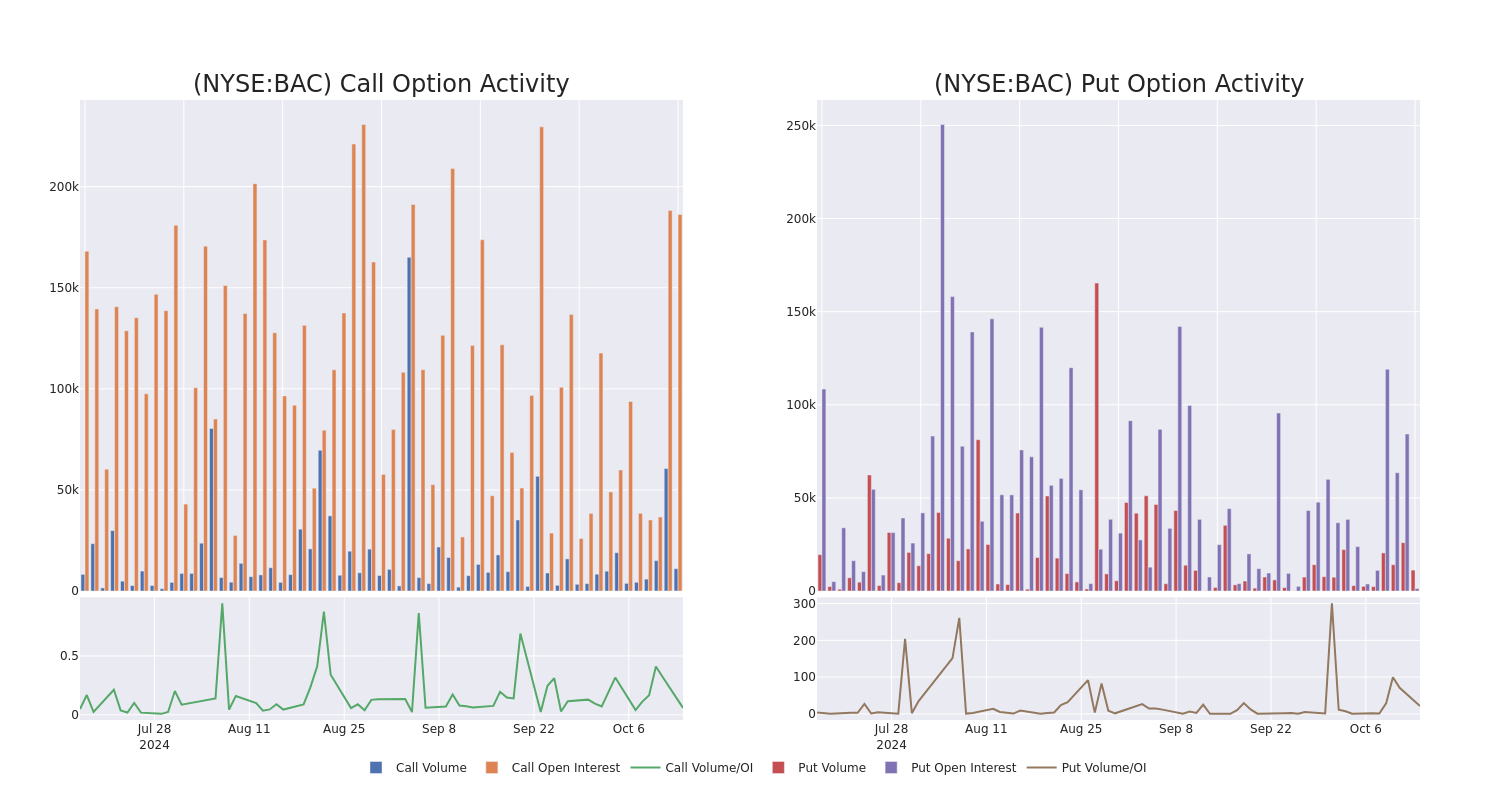
Looking at the volume and open interest is a powerful move while trading options. This data can help you track the liquidity and interest for Bank of America’s options for a given strike price. Below, we can observe the evolution of the volume and open interest of calls and puts, respectively, for all of Bank of America’s whale trades within a strike price range from $28.0 to $43.5 in the last 30 days.
Bank of America Option Volume And Open Interest Over Last 30 Days
Noteworthy Options Activity:
| Symbol | PUT/CALL | Trade Type | Sentiment | Exp. Date | Ask | Bid | Price | Strike Price | Total Trade Price | Open Interest | Volume |
|---|---|---|---|---|---|---|---|---|---|---|---|
| BAC | PUT | SWEEP | BEARISH | 10/18/24 | $1.76 | $1.55 | $1.73 | $43.50 | $173.0K | 87 | 1.0K |
| BAC | PUT | SWEEP | BEARISH | 10/18/24 | $0.55 | $0.54 | $0.55 | $41.50 | $110.0K | 1.1K | 2.5K |
| BAC | CALL | TRADE | BULLISH | 01/17/25 | $14.3 | $14.15 | $14.25 | $28.00 | $85.5K | 18.3K | 60 |
| BAC | CALL | TRADE | BEARISH | 01/16/26 | $9.55 | $9.45 | $9.45 | $35.00 | $56.7K | 8.9K | 60 |
| BAC | CALL | TRADE | BULLISH | 10/18/24 | $0.43 | $0.42 | $0.43 | $43.00 | $43.0K | 34.8K | 1.3K |
About Bank of America
Bank of America is one of the largest financial institutions in the United States, with more than $3.0 trillion in assets. It is organized into four major segments: consumer banking, global wealth and investment management, global banking, and global markets. Bank of America’s consumer-facing lines of business include its network of branches and deposit-gathering operations, retail lending products, credit and debit cards, and small-business services. The company’s Merrill Lynch operations provide brokerage and wealth-management services, as does its private bank. Wholesale lines of business include investment banking, corporate and commercial real estate lending, and capital markets operations. Bank of America has operations in several countries but is primarily US-focused.
Following our analysis of the options activities associated with Bank of America, we pivot to a closer look at the company’s own performance.
Current Position of Bank of America
- Currently trading with a volume of 8,794,046, the BAC’s price is up by 0.23%, now at $42.05.
- RSI readings suggest the stock is currently may be approaching overbought.
- Anticipated earnings release is in 1 days.
What Analysts Are Saying About Bank of America
A total of 3 professional analysts have given their take on this stock in the last 30 days, setting an average price target of $47.333333333333336.
Turn $1000 into $1270 in just 20 days?
20-year pro options trader reveals his one-line chart technique that shows when to buy and sell. Copy his trades, which have had averaged a 27% profit every 20 days. Click here for access.
* An analyst from RBC Capital downgraded its action to Outperform with a price target of $46.
* An analyst from Morgan Stanley has decided to maintain their Overweight rating on Bank of America, which currently sits at a price target of $47.
* An analyst from Oppenheimer persists with their Outperform rating on Bank of America, maintaining a target price of $49.
Trading options involves greater risks but also offers the potential for higher profits. Savvy traders mitigate these risks through ongoing education, strategic trade adjustments, utilizing various indicators, and staying attuned to market dynamics. Keep up with the latest options trades for Bank of America with Benzinga Pro for real-time alerts.
Market News and Data brought to you by Benzinga APIs
© 2024 Benzinga.com. Benzinga does not provide investment advice. All rights reserved.
Equity Bancshares's Earnings: A Preview
Equity Bancshares EQBK is gearing up to announce its quarterly earnings on Tuesday, 2024-10-15. Here’s a quick overview of what investors should know before the release.
Analysts are estimating that Equity Bancshares will report an earnings per share (EPS) of $1.00.
Anticipation surrounds Equity Bancshares’s announcement, with investors hoping to hear about both surpassing estimates and receiving positive guidance for the next quarter.
New investors should understand that while earnings performance is important, market reactions are often driven by guidance.
Historical Earnings Performance
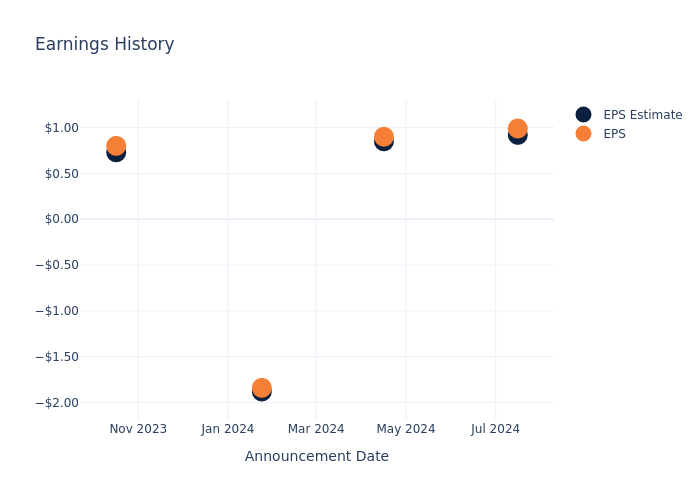
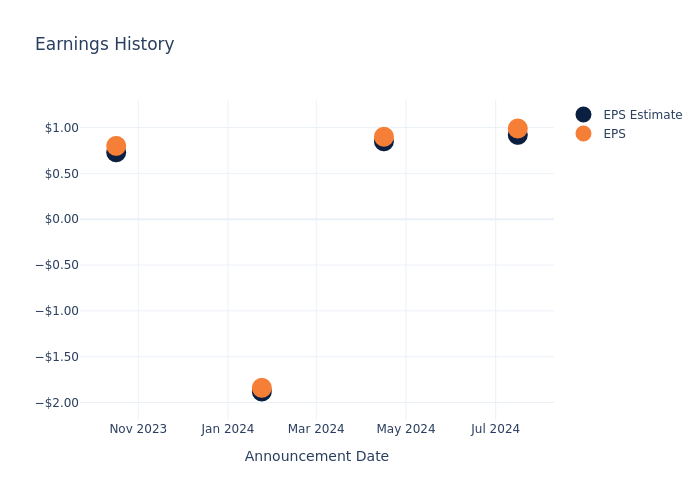
During the last quarter, the company reported an EPS beat by $0.07, leading to a 0.64% increase in the share price on the subsequent day.
Here’s a look at Equity Bancshares’s past performance and the resulting price change:
| Quarter | Q2 2024 | Q1 2024 | Q4 2023 | Q3 2023 |
|---|---|---|---|---|
| EPS Estimate | 0.92 | 0.85 | -1.88 | 0.73 |
| EPS Actual | 0.99 | 0.90 | -1.84 | 0.80 |
| Price Change % | 1.0% | -0.0% | -2.0% | -3.0% |
Equity Bancshares Share Price Analysis
Shares of Equity Bancshares were trading at $41.43 as of October 11. Over the last 52-week period, shares are up 69.67%. Given that these returns are generally positive, long-term shareholders are likely bullish going into this earnings release.
To track all earnings releases for Equity Bancshares visit their earnings calendar on our site.
This article was generated by Benzinga’s automated content engine and reviewed by an editor.
Market News and Data brought to you by Benzinga APIs
© 2024 Benzinga.com. Benzinga does not provide investment advice. All rights reserved.
Bonds Defy Expectations, Earnings Season Will Be A Tell For AI
To gain an edge, this is what you need to know today.
Bonds Defy Expectations
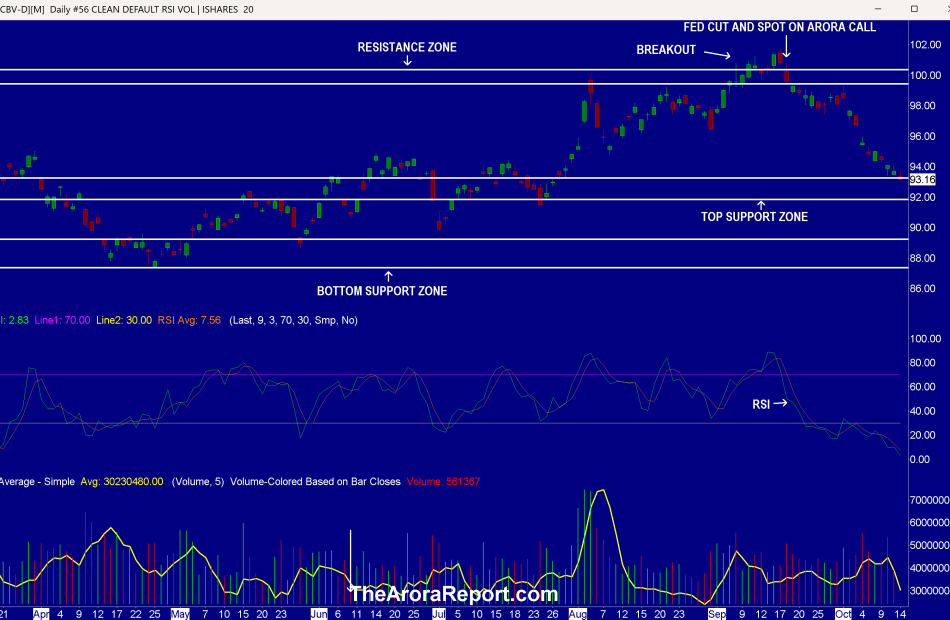
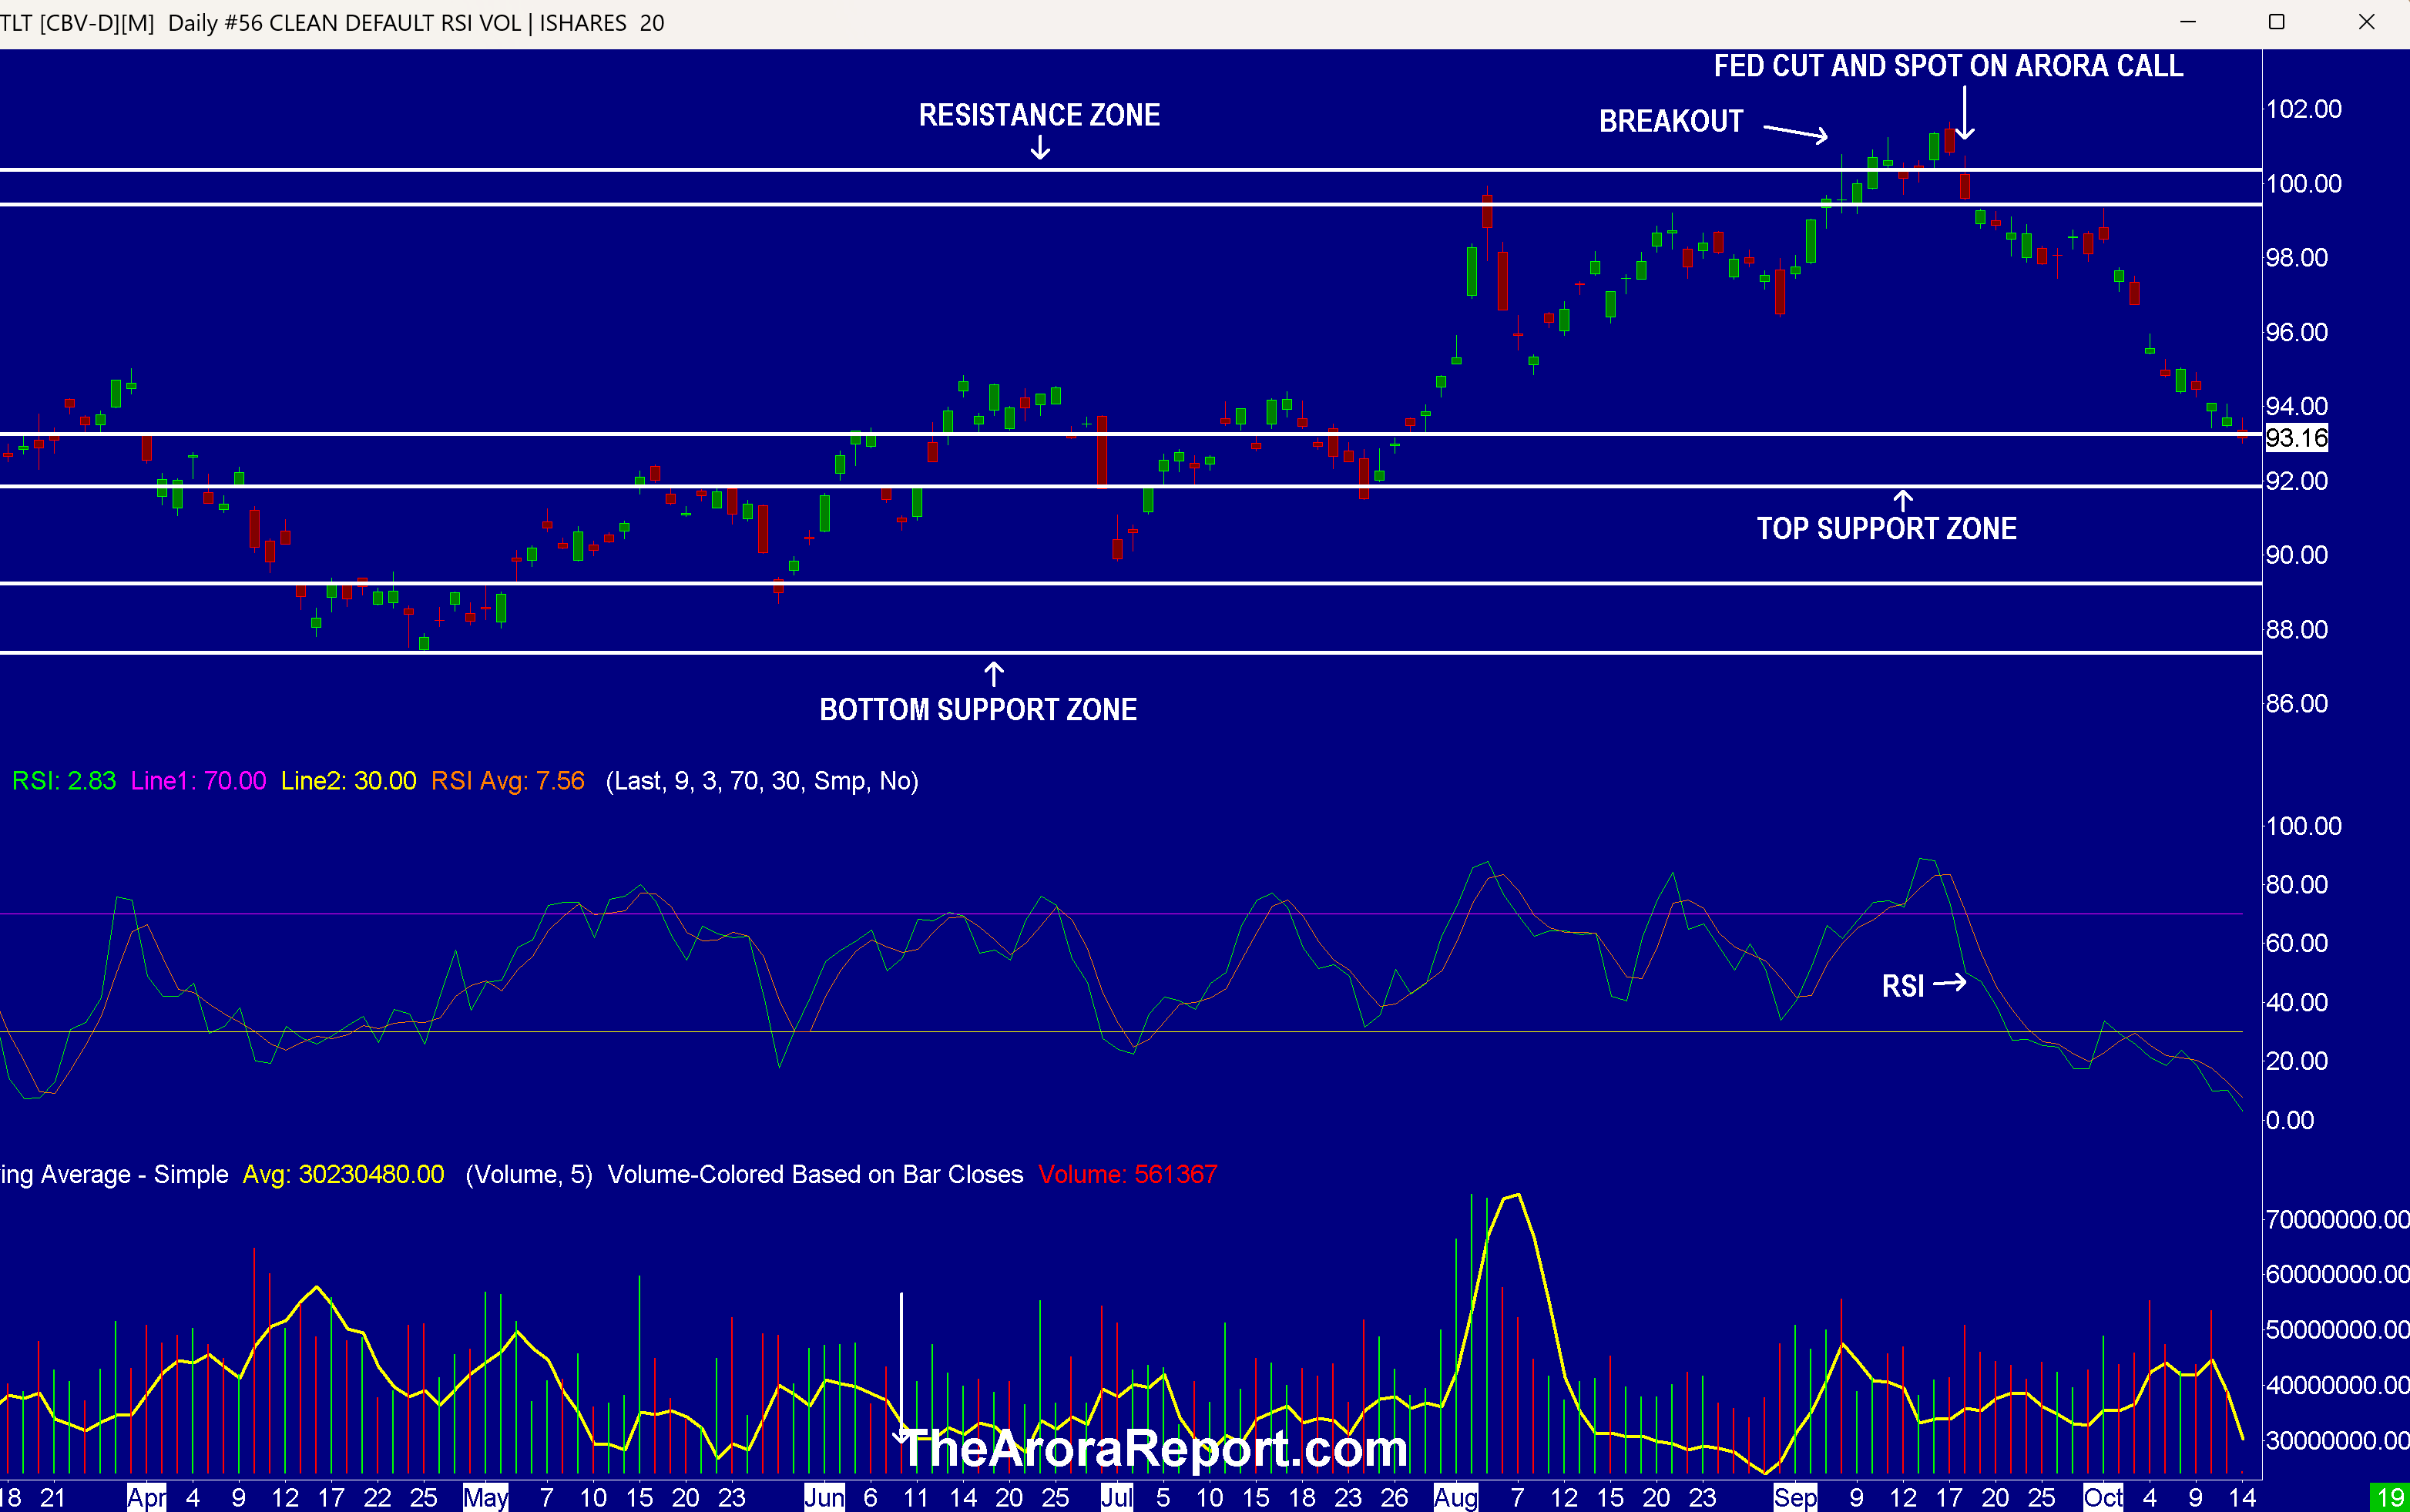
Please click here for an enlarged chart of 20+ year Treasury bond ETF TLT.
Note the following:
- Long bonds are defying expectations in the market.
- The chart shows when the Fed cut interest rates by 50 bps. At that time, TLT had shown a technical breakout. The expectations were for TLT to go higher.
- The chart shows the contrary Arora call that TLT would likely go down.
- We recently wrote:
In The Arora Report analysis, if it was not for the Middle East conflict escalation, TLT would have already fallen into the top support zone.
- The chart shows that The Arora Report call has been spot on. TLT has now hit the top band of the support zone.
- What happens next to long bonds will come down to the election. The prevailing consensus is that there will be a divided government. A divided government will be good for both stock and bond markets. If one party sweeps, there will be a high probability of TLT hitting the lower support zone.
- Bonds offer competition to stocks. Rising yields also lower PEs. For the time being, the stock market is drunk on the momentum generated by the 50 bps cut instead of a 25 bps cut. When the momentum wanes, the stock market will start paying attention to rising yields.
- Prudent investors should note that so far the data has not been supportive of the Fed’s decision to cut interest rates by 50 bps.
- Earnings season is in full swing. Earnings season will be a tell for AI. Undoubtedly, almost every company will hype AI. In the prior quarters, the stock of almost every company that mentioned AI ran up. Here is the key question: Will the stocks run again just on the mention of AI or will the market look for hard data regarding AI?
- After the weekend pump, the momo crowd buying in stocks in the early trade is aggressive.
- Traders are fixated on S&P 6000 as the magnet.
China
In a Saturday briefing, China did not offer new economic stimulus China also did not provide specific numbers as most investors had expected.
- Foreign investors are disappointed and selling Chinese stocks.
- Local investors are satisfied and buying Chinese stocks.
Magnificent Seven Money Flows
In the early trade, money flows are positive in Apple Inc AAPL, Amazon.com, Inc. AMZN, Alphabet Inc Class C GOOG, Meta Platforms Inc META, Microsoft Corp MSFT, NVIDIA Corp NVDA, and Tesla Inc TSLA.
In the early trade, money flows are positive in SPDR S&P 500 ETF Trust SPY and Invesco QQQ Trust Series 1 QQQ.
Momo Crowd And Smart Money In Stocks
Investors can gain an edge by knowing money flows in SPY and QQQ. Investors can get a bigger edge by knowing when smart money is buying stocks, gold, and oil. The most popular ETF for gold is SPDR Gold Trust GLD. The most popular ETF for silver is iShares Silver Trust SLV. The most popular ETF for oil is United States Oil ETF USO.
Bitcoin
Bitcoin BTC/USD is seeing buying for two reasons:
- Trump has moved up in the polls. Trump is considered more bitcoin friendly.
- Foreign speculators who are selling Chinese stocks are putting the money in bitcoin.
Protection Band And What To Do Now
It is important for investors to look ahead and not in the rearview mirror.
Consider continuing to hold good, very long term, existing positions. Based on individual risk preference, consider a protection band consisting of cash or Treasury bills or short-term tactical trades as well as short to medium term hedges and short term hedges. This is a good way to protect yourself and participate in the upside at the same time.
You can determine your protection bands by adding cash to hedges. The high band of the protection is appropriate for those who are older or conservative. The low band of the protection is appropriate for those who are younger or aggressive. If you do not hedge, the total cash level should be more than stated above but significantly less than cash plus hedges.
A protection band of 0% would be very bullish and would indicate full investment with 0% in cash. A protection band of 100% would be very bearish and would indicate a need for aggressive protection with cash and hedges or aggressive short selling.
It is worth reminding that you cannot take advantage of new upcoming opportunities if you are not holding enough cash. When adjusting hedge levels, consider adjusting partial stop quantities for stock positions (non ETF); consider using wider stops on remaining quantities and also allowing more room for high beta stocks. High beta stocks are the ones that move more than the market.
Traditional 60/40 Portfolio
Probability based risk reward adjusted for inflation does not favor long duration strategic bond allocation at this time.
Those who want to stick to traditional 60% allocation to stocks and 40% to bonds may consider focusing on only high quality bonds and bonds of five year duration or less. Those willing to bring sophistication to their investing may consider using bond ETFs as tactical positions and not strategic positions at this time.
The Arora Report is known for its accurate calls. The Arora Report correctly called the big artificial intelligence rally before anyone else, the new bull market of 2023, the bear market of 2022, new stock market highs right after the virus low in 2020, the virus drop in 2020, the DJIA rally to 30,000 when it was trading at 16,000, the start of a mega bull market in 2009, and the financial crash of 2008. Please click here to sign up for a free forever Generate Wealth Newsletter.
Market News and Data brought to you by Benzinga APIs
© 2024 Benzinga.com. Benzinga does not provide investment advice. All rights reserved.
Tesla Rival BYD Slams EU Tariffs On Chinese EVs: 'Needs More Positive Education…Trust Is Low'
Tesla’s Chinese rivals slammed the proposed European Union tariffs on Chinese-made electric vehicles (EVs) during Paris Car Show. The situation has raised concerns about increased costs for consumers and potential impacts on the automotive market.
What Happened: The European Union’s proposed tariffs on Chinese-made electric vehicles could increase costs and discourage buyers, warned BYD BYDDY BYDDF on Monday. This warning comes as European and Chinese automakers compete at the Paris car show, the largest in Europe, during a time of weak demand and rising costs, Reuters reported.
BYD Executive Vice President Stella Li expressed concerns over the tariffs.
“Europe’s EV market needs more positive education … trust is low. The problem is the high price, and that the European Union now charges tariffs,” Li slammed.
She emphasized that the tariffs could prevent less affluent individuals from purchasing EVs. Nine Chinese brands, including BYD and Leapmotor, are showcasing their latest models at the event, as reported by Paris auto show CEO Serge Gachot.
Earlier this month, EU member states narrowly approved import duties on Chinese-made EVs of up to 45%, aiming to counter alleged unfair subsidies from Beijing. However, China denies these claims and has threatened retaliatory measures. Despite the tariff concerns, Chinese automakers are continuing their European expansion plans, with GAC GNZUF and Leapmotor announcing ambitious sales targets in Europe.
Why It Matters: The European Union’s decision to impose tariffs on Chinese EVs has sparked significant debate. The European Commission announced earlier this month that the tariffs, reaching up to 35.3%, were supported by EU member states. This move aims to address perceived unfair subsidies by China. However, the tariffs have drawn criticism from various quarters, including Spain’s Prime Minister Pedro Sánchez, who urged the EU to reconsider its stance to avoid escalating trade tensions. The ongoing dispute highlights the delicate balance between protecting domestic industries and maintaining international trade relations. As Chinese automakers continue their push into the European market, the outcome of this tariff battle could have lasting implications for the global EV industry.
Read Next:
Image via Shutterstock
This story was generated using Benzinga Neuro and edited by Pooja Rajkumari
Market News and Data brought to you by Benzinga APIs
© 2024 Benzinga.com. Benzinga does not provide investment advice. All rights reserved.
MEDIA ADVISORY – FEDERAL GOVERNMENT TO MAKE HOUSING-RELATED ANNOUNCEMENT IN LA BAIE
SAGUENAY, QC, Oct. 12, 2024 /CNW/ – Media are invited to join the Honourable Jean-Yves Duclos, Minister of Public Services and Procurement, Quebec Lieutenant, and Member of Parliament for Québec, on behalf of the Honourable Sean Fraser, Minister of Housing, Infrastructure and Communities, for the announcement.
|
Date: |
October 15, 2024
|
|
Time:
|
2:00 PM ET
|
|
Location: |
Centre Le Phare 293 rue Onésime Coté La Baie (Québec) G7B 3J7 |
SOURCE Canada Mortgage and Housing Corporation (CMHC)

![]() View original content to download multimedia: http://www.newswire.ca/en/releases/archive/October2024/12/c0150.html
View original content to download multimedia: http://www.newswire.ca/en/releases/archive/October2024/12/c0150.html
Market News and Data brought to you by Benzinga APIs
© 2024 Benzinga.com. Benzinga does not provide investment advice. All rights reserved.
A Look at Interactive Brokers Gr's Upcoming Earnings Report
Interactive Brokers Gr IBKR is gearing up to announce its quarterly earnings on Tuesday, 2024-10-15. Here’s a quick overview of what investors should know before the release.
Analysts are estimating that Interactive Brokers Gr will report an earnings per share (EPS) of $1.76.
Interactive Brokers Gr bulls will hope to hear the company announce they’ve not only beaten that estimate, but also to provide positive guidance, or forecasted growth, for the next quarter.
New investors should note that it is sometimes not an earnings beat or miss that most affects the price of a stock, but the guidance (or forecast).
Historical Earnings Performance
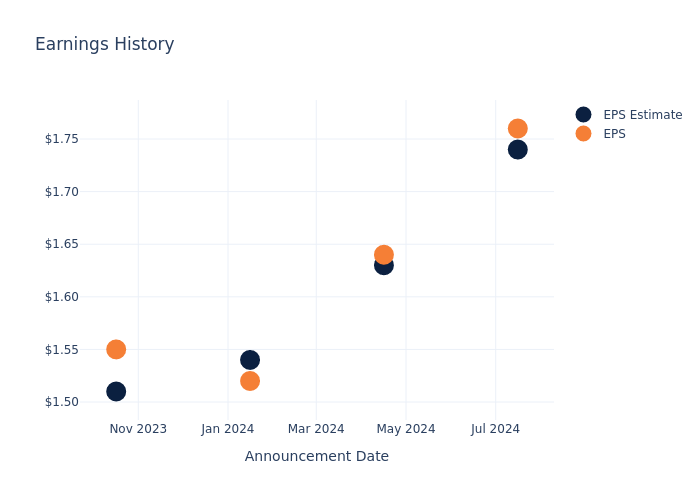
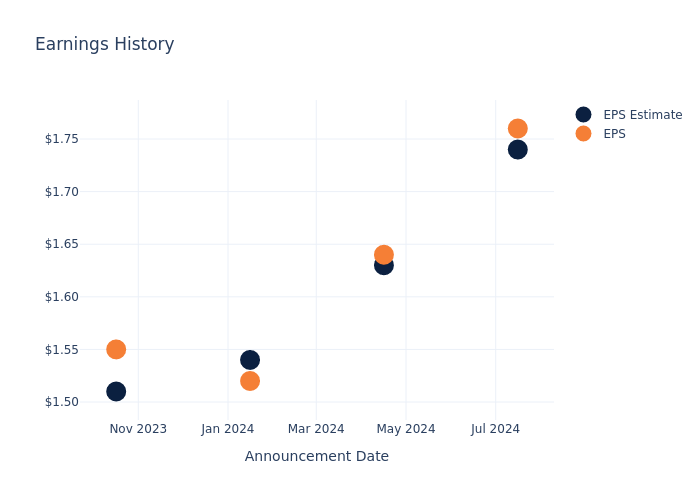
During the last quarter, the company reported an EPS beat by $0.02, leading to a 0.23% drop in the share price on the subsequent day.
Here’s a look at Interactive Brokers Gr’s past performance and the resulting price change:
| Quarter | Q2 2024 | Q1 2024 | Q4 2023 | Q3 2023 |
|---|---|---|---|---|
| EPS Estimate | 1.74 | 1.63 | 1.54 | 1.51 |
| EPS Actual | 1.76 | 1.64 | 1.52 | 1.55 |
| Price Change % | -0.0% | 2.0% | 2.0% | -4.0% |
Tracking Interactive Brokers Gr’s Stock Performance
Shares of Interactive Brokers Gr were trading at $151.14 as of October 11. Over the last 52-week period, shares are up 75.03%. Given that these returns are generally positive, long-term shareholders are likely bullish going into this earnings release.
To track all earnings releases for Interactive Brokers Gr visit their earnings calendar on our site.
This article was generated by Benzinga’s automated content engine and reviewed by an editor.
Market News and Data brought to you by Benzinga APIs
© 2024 Benzinga.com. Benzinga does not provide investment advice. All rights reserved.

