A Closer Look at Arista Networks's Options Market Dynamics
Investors with a lot of money to spend have taken a bullish stance on Arista Networks ANET.
And retail traders should know.
We noticed this today when the trades showed up on publicly available options history that we track here at Benzinga.
Whether these are institutions or just wealthy individuals, we don’t know. But when something this big happens with ANET, it often means somebody knows something is about to happen.
So how do we know what these investors just did?
Today, Benzinga‘s options scanner spotted 30 uncommon options trades for Arista Networks.
This isn’t normal.
The overall sentiment of these big-money traders is split between 33% bullish and 30%, bearish.
Out of all of the special options we uncovered, 9 are puts, for a total amount of $342,871, and 21 are calls, for a total amount of $1,005,778.
What’s The Price Target?
Based on the trading activity, it appears that the significant investors are aiming for a price territory stretching from $260.0 to $460.0 for Arista Networks over the recent three months.
Insights into Volume & Open Interest
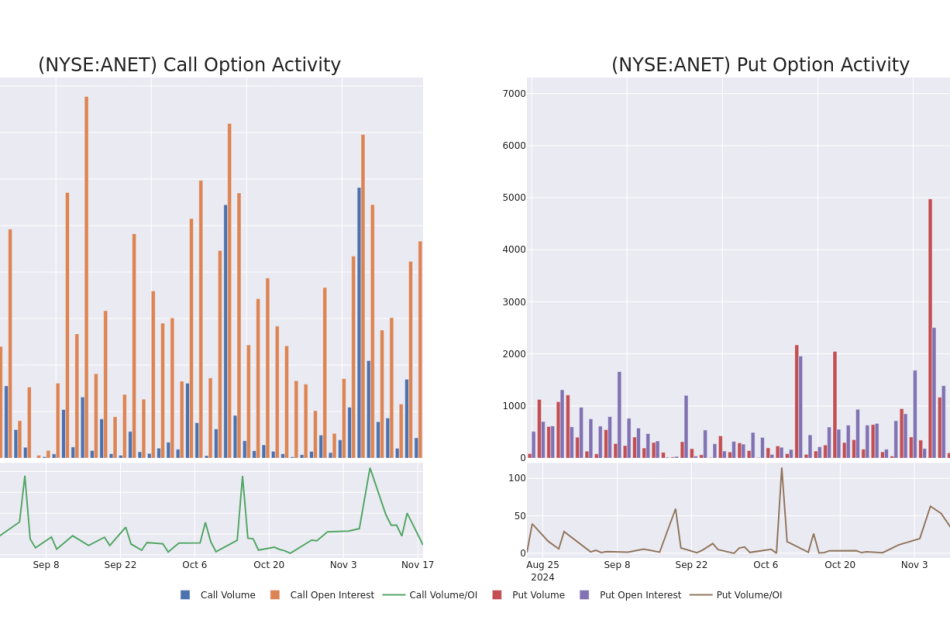
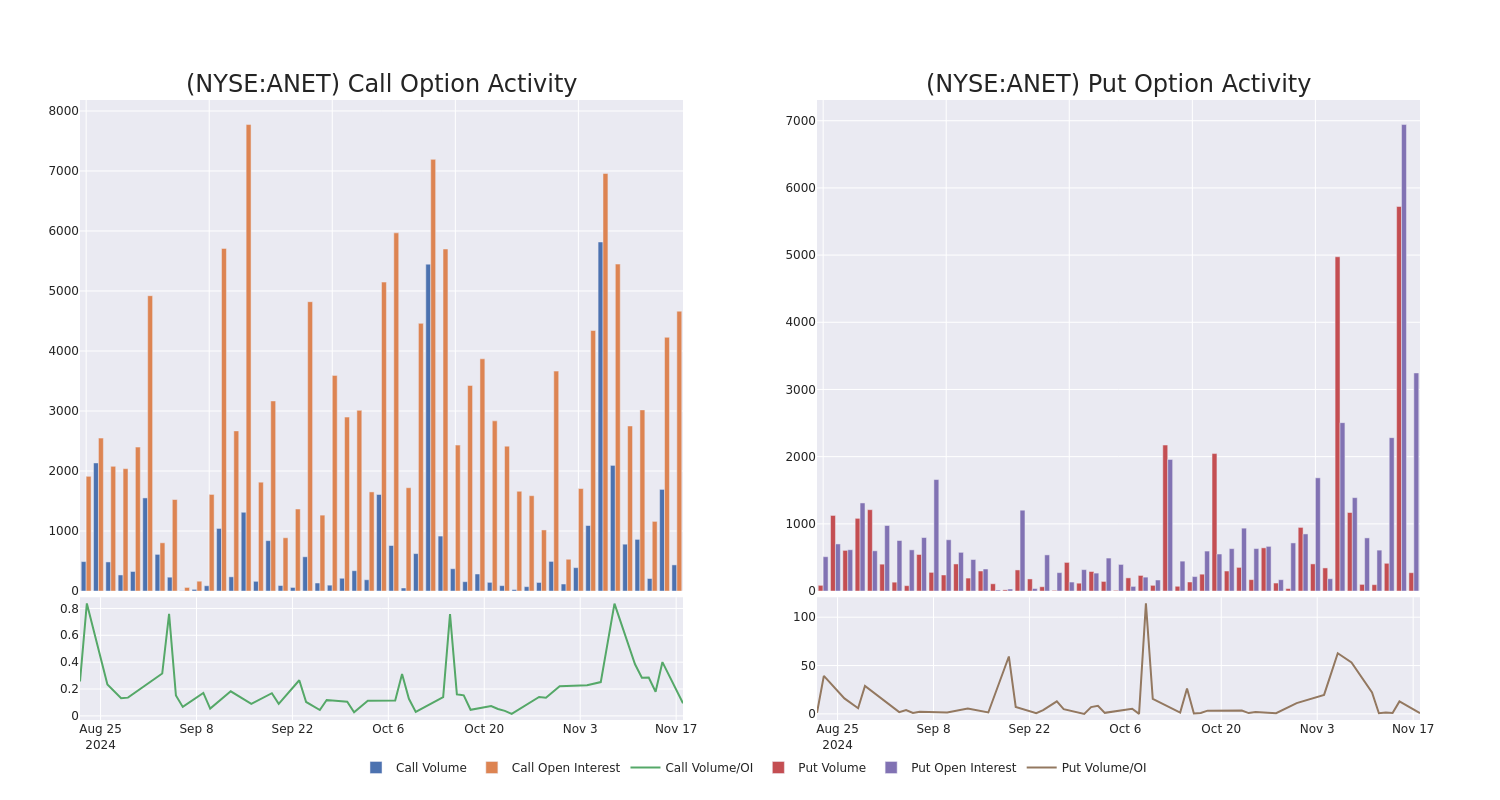
Looking at the volume and open interest is a powerful move while trading options. This data can help you track the liquidity and interest for Arista Networks’s options for a given strike price. Below, we can observe the evolution of the volume and open interest of calls and puts, respectively, for all of Arista Networks’s whale trades within a strike price range from $260.0 to $460.0 in the last 30 days.
Arista Networks Option Volume And Open Interest Over Last 30 Days
Noteworthy Options Activity:
| Symbol | PUT/CALL | Trade Type | Sentiment | Exp. Date | Ask | Bid | Price | Strike Price | Total Trade Price | Open Interest | Volume |
|---|---|---|---|---|---|---|---|---|---|---|---|
| ANET | CALL | TRADE | NEUTRAL | 06/20/25 | $49.1 | $47.5 | $48.4 | $380.00 | $91.9K | 110 | 21 |
| ANET | CALL | TRADE | BEARISH | 02/21/25 | $15.3 | $14.6 | $14.7 | $430.00 | $80.8K | 171 | 114 |
| ANET | CALL | SWEEP | BEARISH | 02/21/25 | $18.0 | $17.4 | $17.43 | $420.00 | $80.3K | 309 | 52 |
| ANET | CALL | TRADE | NEUTRAL | 01/17/25 | $2.7 | $2.1 | $2.45 | $460.00 | $73.5K | 502 | 311 |
| ANET | CALL | TRADE | BEARISH | 02/21/25 | $13.3 | $12.6 | $12.6 | $430.00 | $69.3K | 171 | 0 |
About Arista Networks
Arista Networks is a networking equipment provider that primarily sells Ethernet switches and software to data centers. Its marquee product is its extensible operating system, or EOS, that runs a single image across every single one of its devices. The firm operates as one reportable segment. It has steadily gained market share since its founding in 2004, with a focus on high-speed applications. Arista counts Microsoft and Meta Platforms as its largest customers and derives roughly three quarters of its sales from North America.
In light of the recent options history for Arista Networks, it’s now appropriate to focus on the company itself. We aim to explore its current performance.
Arista Networks’s Current Market Status
- With a volume of 2,357,777, the price of ANET is up 1.84% at $377.3.
- RSI indicators hint that the underlying stock is currently neutral between overbought and oversold.
- Next earnings are expected to be released in 83 days.
Professional Analyst Ratings for Arista Networks
Over the past month, 5 industry analysts have shared their insights on this stock, proposing an average target price of $424.2.
Turn $1000 into $1270 in just 20 days?
20-year pro options trader reveals his one-line chart technique that shows when to buy and sell. Copy his trades, which have had averaged a 27% profit every 20 days. Click here for access.
* Consistent in their evaluation, an analyst from Barclays keeps a Overweight rating on Arista Networks with a target price of $495.
* An analyst from Wells Fargo persists with their Overweight rating on Arista Networks, maintaining a target price of $460.
* An analyst from UBS persists with their Neutral rating on Arista Networks, maintaining a target price of $425.
* An analyst from Piper Sandler has revised its rating downward to Neutral, adjusting the price target to $421.
* Maintaining their stance, an analyst from Rosenblatt continues to hold a Sell rating for Arista Networks, targeting a price of $320.
Options are a riskier asset compared to just trading the stock, but they have higher profit potential. Serious options traders manage this risk by educating themselves daily, scaling in and out of trades, following more than one indicator, and following the markets closely.
If you want to stay updated on the latest options trades for Arista Networks, Benzinga Pro gives you real-time options trades alerts.
Market News and Data brought to you by Benzinga APIs
© 2024 Benzinga.com. Benzinga does not provide investment advice. All rights reserved.
Insights Ahead: Intchains Gr's Quarterly Earnings
Intchains Gr ICG is preparing to release its quarterly earnings on Wednesday, 2024-11-20. Here’s a brief overview of what investors should keep in mind before the announcement.
Analysts expect Intchains Gr to report an earnings per share (EPS) of $0.05.
Investors in Intchains Gr are eagerly awaiting the company’s announcement, hoping for news of surpassing estimates and positive guidance for the next quarter.
It’s worth noting for new investors that stock prices can be heavily influenced by future projections rather than just past performance.
Earnings Track Record
During the last quarter, the company reported an EPS beat by $0.08, leading to a 4.53% increase in the share price on the subsequent day.
Stock Performance
Shares of Intchains Gr were trading at $4.1 as of November 18. Over the last 52-week period, shares are down 50.91%. Given that these returns are generally negative, long-term shareholders are likely a little upset going into this earnings release.
To track all earnings releases for Intchains Gr visit their earnings calendar on our site.
This article was generated by Benzinga’s automated content engine and reviewed by an editor.
Market News and Data brought to you by Benzinga APIs
© 2024 Benzinga.com. Benzinga does not provide investment advice. All rights reserved.
Why Supermicro Stock Is Up 30% Today
David Paul Morris / Bloomberg / Getty Images
Super Micro Computer CEO Charles Liang
-
Supermicro’s shares were up more than 30% in recent trading, extending a wild year that has seen both dramatic highs and steep declines.
-
The company late yesterday issued a much-awaited announcement, naming a new auditor and filing a plan to avoid delisting by the Nasdaq.
-
Despite today’s jump, the stock is down 75% from its all-time highs in March.
Shares of Super Micro Computer are flying today, though nowhere near their highs.
The server maker’s shares were recently up more than 30% in Tuesday trading, extending a wild year that has seen both dramatic highs and steep declines.
What’s behind the move? Supermicro (SMCI) late yesterday issued a much-awaited announcement, naming a new auditor and filing a plan to avoid delisting by the Nasdaq—which was itself necessitated by the company’s failure to file its annual report on time. (The plan still requires approval from the Nasdaq, Mizuho analysts noted Tuesday.)
Today’s jump is the latest swing for a stock that has seen a whipsaw 2024. Aided by AI-fueled enthusiasm, the stock—which finished last year just below $29—jumped above $120 in March; earlier this month, amid ongoing concerns about issues related to the filing, its accounting and related matters, it traded below $18.
Along the way, the company was named to the benchmark S&P 500 index and split its shares 10-for-1. At recent prices, it’s roughly in the neighborhood of break-even for the year so far.
TradingView
Not World War III But New Russian Nuclear Doctrine Brings Selling In Stocks, Walmart Breaks Out
To gain an edge, this is what you need to know today.

New Russian Nuclear Doctrine
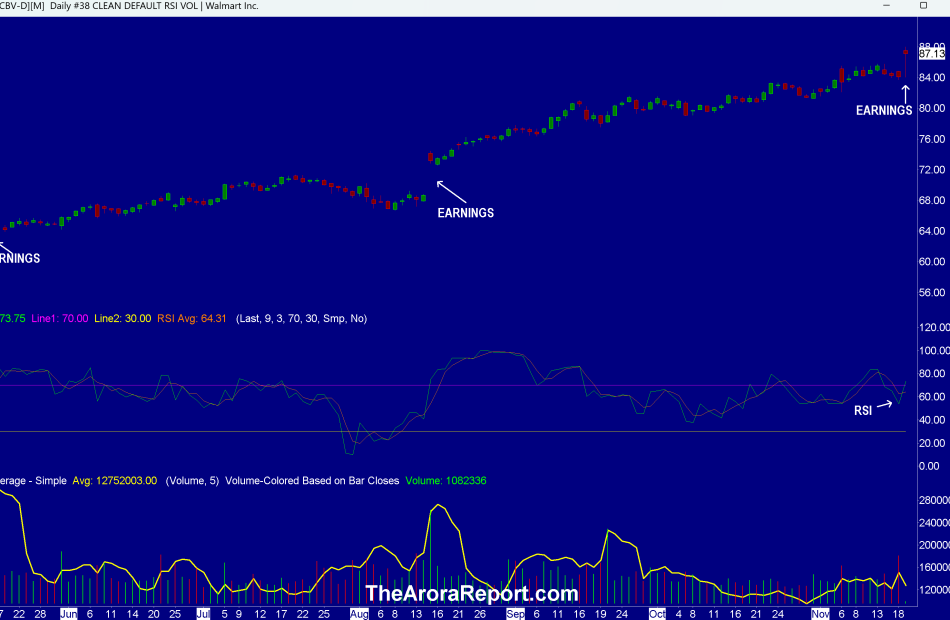
Please click here for an enlarged chart of Walmart Inc WMT.
Note the following:
- This article is about the big picture, not an individual stock. The chart of WMT is being used to illustrate the point.
- The U.S. economy is 70% consumer based. Walmart is the largest retailer in the U.S. For this reason, prudent investors pay attention to Walmart’s earnings.
- The chart shows WMT stock gapped up after earnings.
- The chart shows that WMT stock also gapped up on earnings in the prior two quarters.
- Walmart reported earnings better than the whisper numbers. Stocks move based on the difference between reported numbers and whisper numbers. Whisper numbers are the number analysts privately share with their best clients. Whisper numbers are different from the numbers the same analysts publish for public consumption.
- In The Arora Report analysis, the following are the most important points from Walmart earnings:
- Higher end consumers continue to shift to Walmart.
- E-commerce at Walmart, especially quick delivery, is growing rapidly.
- Margins are expanding.
- Walmart is gaining market share.
- In The Arora Report analysis, as good as Walmart is doing, investors need to be mindful of the very high valuation for a retailer. Walmart is trading at a trailing PE of 43. However, as Walmart’s earnings are growing, forward PE is 30, which is still expensive for a retailer.
- As full disclosure, Walmart is in The Arora Report’s ZYX Buy Core Model Portfolio from an average price of $19.25.
- Prudent investors also watch earnings from home improvement retailer Lowe’s Companies Inc LOW. Lowe’s earnings are a reflection of the consumer, especially remodeling of existing homes. Lowe’s earnings are slightly below whisper numbers. As full disclosure, LOW is also in The Arora Report’s ZYX Buy Core Model Portfolio and is long from an average of $81.85.
- In the early trade, markets are responding to the new Russian doctrine.
- Stocks are being sold.
- Gold and silver are being bought.
- Oil is being bought.
- The dollar is being bought.
- The yen is being bought.
- The new Russian doctrine brings the world closer to World War III. The new doctrine is in response to the U.S. allowing Ukraine to fire U.S. manufactured long range missiles on targets inside Russia.
- Prudent investors should note the following three elements of the new Russian doctrine.
- An attack on Russia by any country supported by a nuclear power will be considered a joint attack on Russia.
- A massive aerial attack could trigger a nuclear response from Russia.
- In reference to NATO, an aggression by a member of the coalition will be viewed as aggression by the entire bloc.
- In The Arora Report analysis, the new Russian doctrine is squarely directed at the U.S. The purpose appears to be to persuade Trump to stop supporting Ukraine and force Ukraine to cede territory in Eastern Ukraine to Russia. Further, in The Arora Report analysis, the ultimate solution is likely going to be the U.S. forcing Ukraine to give Eastern Ukraine to Russia as per Russian wishes. This has been a long standing Arora call.
- For the first time ever, Ukraine has attacked a warehouse inside Russia using long range missiles manufactured by the U.S. The missile attack was conducted with Army Tactical Missile System (ATACMS). The missiles are manufactured by Lockheed Martin Corp LMT, a major U.S. defense contractor. The targeted warehouse housed ammunition and missiles from North Korea. North Korea is promising 100K troops to fight for Russia in Ukraine.
- There is no change in the protection band at this time, but we are keeping a close eye on the situation.
Housing
New housing is beginning to weaken. Here is the just released data:
- Housing starts came at 1.311M vs. 1.34M consensus.
- Building permits came at 1.416M vs. 1.441M consensus.
Magnificent Seven Money Flows
In the early trade, money flows are positive in NVIDIA Corp NVDA.
In the early trade, money flows are negative in Apple Inc AAPL, Amazon.com, Inc. AMZN, Alphabet Inc Class C GOOG, Meta Platforms Inc META, Microsoft Corp MSFT, and Tesla Inc TSLA.
In the early trade, money flows are negative in SPDR S&P 500 ETF Trust SPY and Invesco QQQ Trust Series 1 QQQ.
Momo Crowd And Smart Money In Stocks
Investors can gain an edge by knowing money flows in SPY and QQQ. Investors can get a bigger edge by knowing when smart money is buying stocks, gold, and oil. The most popular ETF for gold is SPDR Gold Trust GLD. The most popular ETF for silver is iShares Silver Trust SLV. The most popular ETF for oil is United States Oil ETF USO.
Bitcoin
Bitcoin BTC/USD is range bound.
Protection Band And What To Do Now
It is important for investors to look ahead and not in the rearview mirror. The proprietary protection band from The Arora Report is very popular. The protection band puts all of the data, all of the indicators, all of the news, all of the crosscurrents, all of the models, and all of the analysis in an analytical framework that is easily actionable by investors.
Consider continuing to hold good, very long term, existing positions. Based on individual risk preference, consider a protection band consisting of cash or Treasury bills or short-term tactical trades as well as short to medium term hedges and short term hedges. This is a good way to protect yourself and participate in the upside at the same time.
You can determine your protection bands by adding cash to hedges. The high band of the protection is appropriate for those who are older or conservative. The low band of the protection is appropriate for those who are younger or aggressive. If you do not hedge, the total cash level should be more than stated above but significantly less than cash plus hedges.
A protection band of 0% would be very bullish and would indicate full investment with 0% in cash. A protection band of 100% would be very bearish and would indicate a need for aggressive protection with cash and hedges or aggressive short selling.
It is worth reminding that you cannot take advantage of new upcoming opportunities if you are not holding enough cash. When adjusting hedge levels, consider adjusting partial stop quantities for stock positions (non ETF); consider using wider stops on remaining quantities and also allowing more room for high beta stocks. High beta stocks are the ones that move more than the market.
Traditional 60/40 Portfolio
Probability based risk reward adjusted for inflation does not favor long duration strategic bond allocation at this time.
Those who want to stick to traditional 60% allocation to stocks and 40% to bonds may consider focusing on only high quality bonds and bonds of five year duration or less. Those willing to bring sophistication to their investing may consider using bond ETFs as tactical positions and not strategic positions at this time.
The Arora Report is known for its accurate calls. The Arora Report correctly called the big artificial intelligence rally before anyone else, the new bull market of 2023, the bear market of 2022, new stock market highs right after the virus low in 2020, the virus drop in 2020, the DJIA rally to 30,000 when it was trading at 16,000, the start of a mega bull market in 2009, and the financial crash of 2008. Please click here to sign up for a free forever Generate Wealth Newsletter.
Market News and Data brought to you by Benzinga APIs
© 2024 Benzinga.com. Benzinga does not provide investment advice. All rights reserved.
ICF International Insider Trades SendAa Signal
In a recent SEC filing, it was revealed that SCOTT SALMIRS, Board Member at ICF International ICFI, made a noteworthy insider purchase on November 19,.
What Happened: SALMIRS’s recent move, as outlined in a Form 4 filing with the U.S. Securities and Exchange Commission on Tuesday, involves purchasing 400 shares of ICF International. The total transaction value is $55,352.
As of Tuesday morning, ICF International shares are up by 0.19%, currently priced at $135.53.
Discovering ICF International: A Closer Look
ICF International Inc provides professional services and technology-based solutions to government and commercial clients, including management, marketing, technology, and policy consulting and implementation services. Its services support clients that operate in four key markets that include Energy, Environment, Infrastructure and Disaster Recovery; Health and Social Programs and Security and Other Civilian & Commercial. The Company’s majority clients are United States federal government departments and agencies. It operates in single segment, which is providing professional services.
ICF International: Delving into Financials
Positive Revenue Trend: Examining ICF International’s financials over 3 months reveals a positive narrative. The company achieved a noteworthy revenue growth rate of 3.09% as of 30 September, 2024, showcasing a substantial increase in top-line earnings. As compared to competitors, the company encountered difficulties, with a growth rate lower than the average among peers in the Industrials sector.
Analyzing Profitability Metrics:
-
Gross Margin: With a high gross margin of 37.13%, the company demonstrates effective cost control and strong profitability relative to its peers.
-
Earnings per Share (EPS): ICF International’s EPS is notably higher than the industry average. The company achieved a positive bottom-line trend with a current EPS of 1.74.
Debt Management: The company maintains a balanced debt approach with a debt-to-equity ratio below industry norms, standing at 0.63.
Valuation Overview:
-
Price to Earnings (P/E) Ratio: The Price to Earnings ratio of 23.77 is lower than the industry average, indicating potential undervaluation for the stock.
-
Price to Sales (P/S) Ratio: The current P/S ratio of 1.28 is below industry norms, suggesting potential undervaluation and presenting an investment opportunity for those considering sales performance.
-
EV/EBITDA Analysis (Enterprise Value to its Earnings Before Interest, Taxes, Depreciation & Amortization): With a below-average EV/EBITDA ratio of 14.04, ICF International presents an opportunity for value investors. This lower valuation may attract investors seeking undervalued opportunities.
Market Capitalization Analysis: Reflecting a smaller scale, the company’s market capitalization is positioned below industry averages. This could be attributed to factors such as growth expectations or operational capacity.
Now trade stocks online commission free with Charles Schwab, a trusted and complete investment firm.
Why Pay Attention to Insider Transactions
Insider transactions shouldn’t be used primarily to make an investing decision, however an insider transaction can be an important factor in the investing decision.
In the context of legal matters, the term “insider” refers to any officer, director, or beneficial owner holding more than ten percent of a company’s equity securities, as outlined by Section 12 of the Securities Exchange Act of 1934. This includes executives in the c-suite and significant hedge funds. Such insiders are obligated to report their transactions through a Form 4 filing, which must be completed within two business days of the transaction.
Pointing towards optimism, a company insider’s new purchase signals their positive anticipation for the stock to rise.
Despite insider sells not always signaling a bearish sentiment, they can be driven by various factors.
Understanding Crucial Transaction Codes
When dissecting transactions, the focal point for investors is often those occurring in the open market, meticulously detailed in Table I of the Form 4 filing. A P in Box 3 denotes a purchase, while S signifies a sale. Transaction code C indicates the conversion of an option, and transaction code A denotes a grant, award, or other acquisition of securities from the company.
Check Out The Full List Of ICF International’s Insider Trades.
Insider Buying Alert: Profit from C-Suite Moves
Benzinga Edge reveals every insider trade in real-time. Don’t miss the next big stock move driven by insider confidence. Unlock this ultimate sentiment indicator now. Click here for access.
This article was generated by Benzinga’s automated content engine and reviewed by an editor.
Market News and Data brought to you by Benzinga APIs
© 2024 Benzinga.com. Benzinga does not provide investment advice. All rights reserved.
This Is What Whales Are Betting On Alnylam Pharmaceuticals
Financial giants have made a conspicuous bearish move on Alnylam Pharmaceuticals. Our analysis of options history for Alnylam Pharmaceuticals ALNY revealed 11 unusual trades.
Delving into the details, we found 27% of traders were bullish, while 45% showed bearish tendencies. Out of all the trades we spotted, 9 were puts, with a value of $515,770, and 2 were calls, valued at $88,650.
Projected Price Targets
Analyzing the Volume and Open Interest in these contracts, it seems that the big players have been eyeing a price window from $210.0 to $290.0 for Alnylam Pharmaceuticals during the past quarter.
Volume & Open Interest Trends
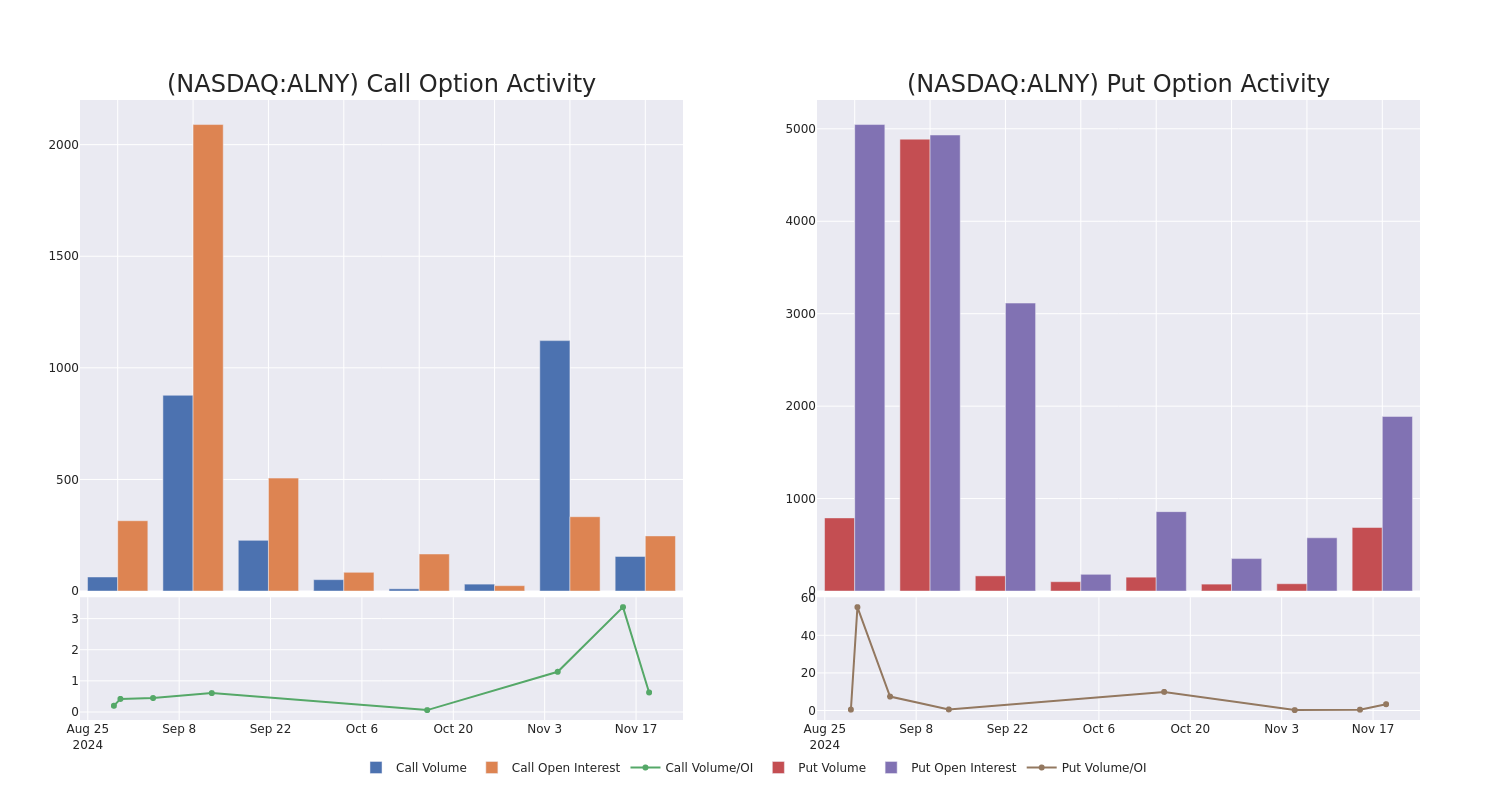
Examining the volume and open interest provides crucial insights into stock research. This information is key in gauging liquidity and interest levels for Alnylam Pharmaceuticals’s options at certain strike prices. Below, we present a snapshot of the trends in volume and open interest for calls and puts across Alnylam Pharmaceuticals’s significant trades, within a strike price range of $210.0 to $290.0, over the past month.
Alnylam Pharmaceuticals Option Volume And Open Interest Over Last 30 Days
Significant Options Trades Detected:
| Symbol | PUT/CALL | Trade Type | Sentiment | Exp. Date | Ask | Bid | Price | Strike Price | Total Trade Price | Open Interest | Volume |
|---|---|---|---|---|---|---|---|---|---|---|---|
| ALNY | PUT | SWEEP | BEARISH | 12/20/24 | $15.5 | $15.5 | $15.5 | $240.00 | $130.2K | 517 | 100 |
| ALNY | PUT | SWEEP | BEARISH | 12/20/24 | $3.5 | $3.0 | $3.5 | $210.00 | $62.6K | 170 | 457 |
| ALNY | PUT | TRADE | NEUTRAL | 12/20/24 | $58.5 | $55.9 | $57.0 | $290.00 | $57.0K | 241 | 40 |
| ALNY | CALL | TRADE | BULLISH | 01/15/27 | $54.0 | $50.5 | $54.0 | $250.00 | $54.0K | 0 | 10 |
| ALNY | PUT | TRADE | NEUTRAL | 12/20/24 | $50.1 | $46.6 | $48.1 | $280.00 | $52.9K | 395 | 11 |
About Alnylam Pharmaceuticals
Alnylam Pharmaceuticals is a leader in the study of RNA interference (RNAi) therapeutics. RNAi is a naturally occurring biological pathway within cells for sequence-specific silencing and regulation of gene expression. Alnylam has five drugs on the market: Onpattro and Amvuttra for hATTR amyloidosis, Givlaari for acute hepatic porphyria, Oxlumo for primary hyperoxaluria type 1, and Leqvio for hypercholesterolemia. It also has several clinical programs across various therapeutic areas: genetic medicines; cardio-metabolic diseases; hepatic infectious diseases, and CNS/ocular diseases. Upfront fees from research partnerships have boosted Alnylam’s cash levels, and the company stands to see additional milestones and royalties from drugs commercialized under collaboration partnerships.
In light of the recent options history for Alnylam Pharmaceuticals, it’s now appropriate to focus on the company itself. We aim to explore its current performance.
Alnylam Pharmaceuticals’s Current Market Status
- With a volume of 446,657, the price of ALNY is up 0.74% at $233.99.
- RSI indicators hint that the underlying stock may be oversold.
- Next earnings are expected to be released in 86 days.
What Analysts Are Saying About Alnylam Pharmaceuticals
A total of 5 professional analysts have given their take on this stock in the last 30 days, setting an average price target of $350.2.
Turn $1000 into $1270 in just 20 days?
20-year pro options trader reveals his one-line chart technique that shows when to buy and sell. Copy his trades, which have had averaged a 27% profit every 20 days. Click here for access.
* Maintaining their stance, an analyst from Canaccord Genuity continues to hold a Buy rating for Alnylam Pharmaceuticals, targeting a price of $384.
* An analyst from Piper Sandler downgraded its action to Overweight with a price target of $296.
* An analyst from HC Wainwright & Co. downgraded its action to Buy with a price target of $400.
* An analyst from RBC Capital has revised its rating downward to Outperform, adjusting the price target to $300.
* An analyst from TD Cowen persists with their Buy rating on Alnylam Pharmaceuticals, maintaining a target price of $371.
Options are a riskier asset compared to just trading the stock, but they have higher profit potential. Serious options traders manage this risk by educating themselves daily, scaling in and out of trades, following more than one indicator, and following the markets closely.
If you want to stay updated on the latest options trades for Alnylam Pharmaceuticals, Benzinga Pro gives you real-time options trades alerts.
Market News and Data brought to you by Benzinga APIs
© 2024 Benzinga.com. Benzinga does not provide investment advice. All rights reserved.
A Preview Of Williams-Sonoma's Earnings
Williams-Sonoma WSM is gearing up to announce its quarterly earnings on Wednesday, 2024-11-20. Here’s a quick overview of what investors should know before the release.
Analysts are estimating that Williams-Sonoma will report an earnings per share (EPS) of $1.77.
Williams-Sonoma bulls will hope to hear the company announce they’ve not only beaten that estimate, but also to provide positive guidance, or forecasted growth, for the next quarter.
New investors should note that it is sometimes not an earnings beat or miss that most affects the price of a stock, but the guidance (or forecast).
Earnings Track Record
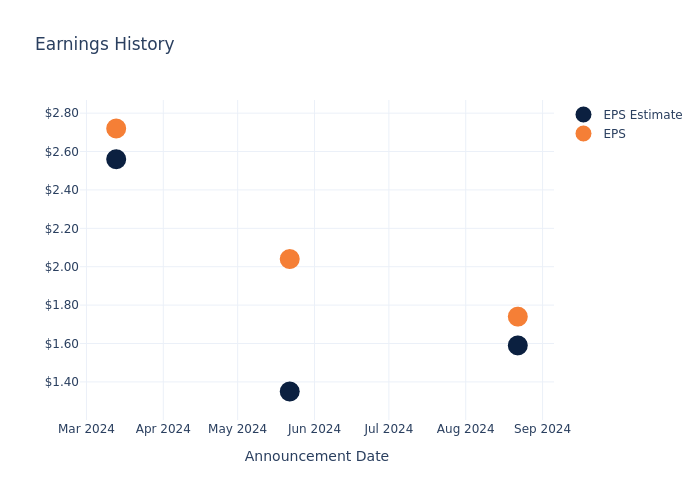
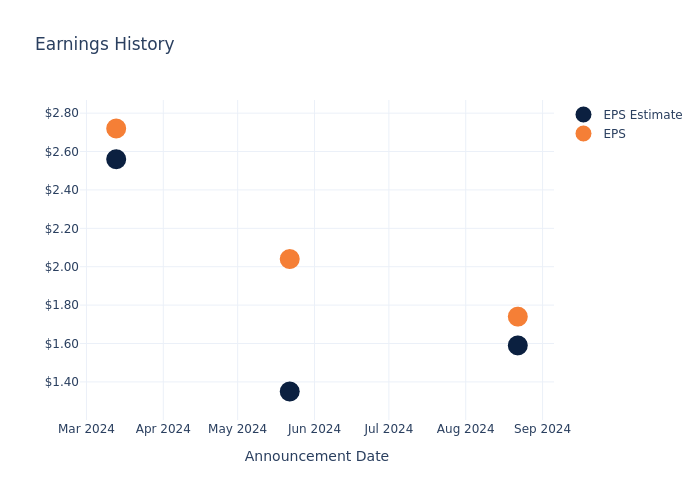
In the previous earnings release, the company beat EPS by $0.15, leading to a 6.9% increase in the share price the following trading session.
Here’s a look at Williams-Sonoma’s past performance and the resulting price change:
| Quarter | Q2 2024 | Q1 2024 | Q4 2023 | Q3 2023 |
|---|---|---|---|---|
| EPS Estimate | 1.59 | 1.35 | 2.56 | 1.68 |
| EPS Actual | 1.74 | 2.04 | 2.72 | 1.83 |
| Price Change % | 7.000000000000001% | 2.0% | 1.0% | 4.0% |
Performance of Williams-Sonoma Shares
Shares of Williams-Sonoma were trading at $133.89 as of November 18. Over the last 52-week period, shares are up 51.8%. Given that these returns are generally positive, long-term shareholders should be satisfied going into this earnings release.
To track all earnings releases for Williams-Sonoma visit their earnings calendar on our site.
This article was generated by Benzinga’s automated content engine and reviewed by an editor.
Market News and Data brought to you by Benzinga APIs
© 2024 Benzinga.com. Benzinga does not provide investment advice. All rights reserved.
CVS Health Options Trading: A Deep Dive into Market Sentiment
Investors with a lot of money to spend have taken a bearish stance on CVS Health CVS.
And retail traders should know.
We noticed this today when the trades showed up on publicly available options history that we track here at Benzinga.
Whether these are institutions or just wealthy individuals, we don’t know. But when something this big happens with CVS, it often means somebody knows something is about to happen.
So how do we know what these investors just did?
Today, Benzinga‘s options scanner spotted 13 uncommon options trades for CVS Health.
This isn’t normal.
The overall sentiment of these big-money traders is split between 38% bullish and 61%, bearish.
Out of all of the special options we uncovered, 7 are puts, for a total amount of $668,128, and 6 are calls, for a total amount of $310,421.
Predicted Price Range
Based on the trading activity, it appears that the significant investors are aiming for a price territory stretching from $50.0 to $80.0 for CVS Health over the recent three months.
Analyzing Volume & Open Interest
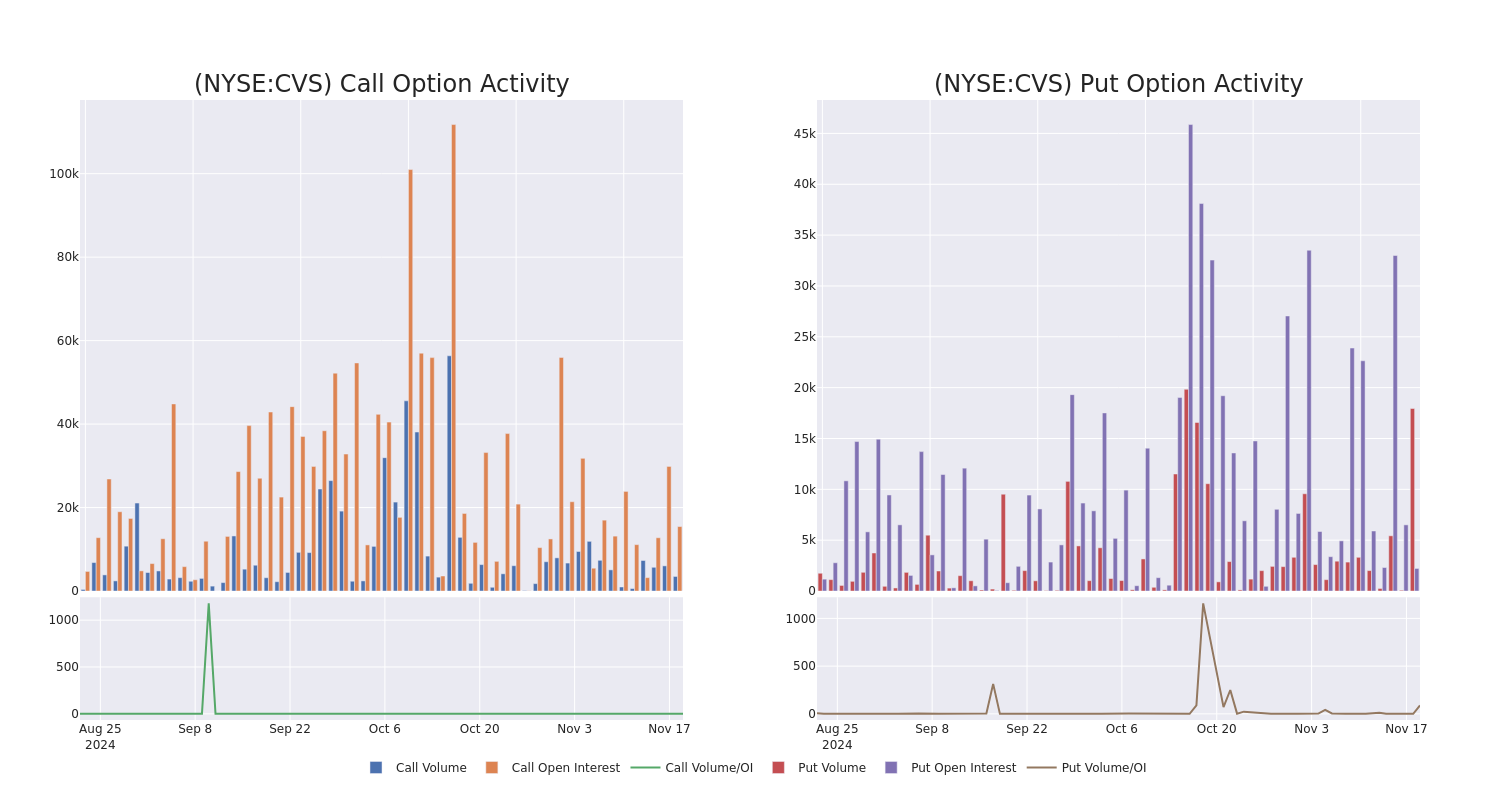
In terms of liquidity and interest, the mean open interest for CVS Health options trades today is 1767.3 with a total volume of 21,448.00.
In the following chart, we are able to follow the development of volume and open interest of call and put options for CVS Health’s big money trades within a strike price range of $50.0 to $80.0 over the last 30 days.
CVS Health Call and Put Volume: 30-Day Overview
Noteworthy Options Activity:
| Symbol | PUT/CALL | Trade Type | Sentiment | Exp. Date | Ask | Bid | Price | Strike Price | Total Trade Price | Open Interest | Volume |
|---|---|---|---|---|---|---|---|---|---|---|---|
| CVS | PUT | SWEEP | BEARISH | 11/22/24 | $1.27 | $1.1 | $1.1 | $56.00 | $219.5K | 594 | 2.0K |
| CVS | PUT | SWEEP | BULLISH | 11/22/24 | $1.25 | $1.1 | $1.1 | $56.00 | $141.0K | 594 | 3.3K |
| CVS | PUT | SWEEP | BULLISH | 12/20/24 | $1.0 | $0.98 | $0.99 | $54.00 | $106.4K | 57 | 1.1K |
| CVS | CALL | SWEEP | BULLISH | 11/29/24 | $0.95 | $0.94 | $0.95 | $56.00 | $86.6K | 527 | 919 |
| CVS | CALL | SWEEP | BEARISH | 01/17/25 | $1.35 | $1.32 | $1.32 | $60.00 | $72.8K | 10.4K | 960 |
About CVS Health
CVS Health offers a diverse set of healthcare services. Its roots are in its retail pharmacy operations, where it operates over 9,000 stores primarily in the us. CVS is also a large pharmacy benefit manager (acquired through Caremark), processing about 2 billion adjusted claims annually. It also operates a top-tier health insurer (acquired through Aetna) where it serves about 26 million medical members. The company’s recent acquisition of Oak Street adds primary care services to the mix, which could have significant synergies with all its existing business lines.
CVS Health’s Current Market Status
- With a trading volume of 6,498,681, the price of CVS is down by -0.72%, reaching $55.65.
- Current RSI values indicate that the stock is is currently neutral between overbought and oversold.
- Next earnings report is scheduled for 78 days from now.
Expert Opinions on CVS Health
In the last month, 5 experts released ratings on this stock with an average target price of $65.0.
Unusual Options Activity Detected: Smart Money on the Move
Benzinga Edge’s Unusual Options board spots potential market movers before they happen. See what positions big money is taking on your favorite stocks. Click here for access.
* An analyst from Mizuho has decided to maintain their Outperform rating on CVS Health, which currently sits at a price target of $66.
* Maintaining their stance, an analyst from Wells Fargo continues to hold a Equal-Weight rating for CVS Health, targeting a price of $60.
* An analyst from UBS persists with their Neutral rating on CVS Health, maintaining a target price of $62.
* An analyst from Barclays persists with their Overweight rating on CVS Health, maintaining a target price of $71.
* In a positive move, an analyst from Wells Fargo has upgraded their rating to Overweight and adjusted the price target to $66.
Options are a riskier asset compared to just trading the stock, but they have higher profit potential. Serious options traders manage this risk by educating themselves daily, scaling in and out of trades, following more than one indicator, and following the markets closely.
If you want to stay updated on the latest options trades for CVS Health, Benzinga Pro gives you real-time options trades alerts.
Market News and Data brought to you by Benzinga APIs
© 2024 Benzinga.com. Benzinga does not provide investment advice. All rights reserved.

