Alphabet Unusual Options Activity
Deep-pocketed investors have adopted a bullish approach towards Alphabet GOOGL, and it’s something market players shouldn’t ignore. Our tracking of public options records at Benzinga unveiled this significant move today. The identity of these investors remains unknown, but such a substantial move in GOOGL usually suggests something big is about to happen.
We gleaned this information from our observations today when Benzinga’s options scanner highlighted 58 extraordinary options activities for Alphabet. This level of activity is out of the ordinary.
The general mood among these heavyweight investors is divided, with 51% leaning bullish and 37% bearish. Among these notable options, 26 are puts, totaling $2,325,158, and 32 are calls, amounting to $1,836,169.
What’s The Price Target?
Based on the trading activity, it appears that the significant investors are aiming for a price territory stretching from $50.0 to $200.0 for Alphabet over the recent three months.
Insights into Volume & Open Interest
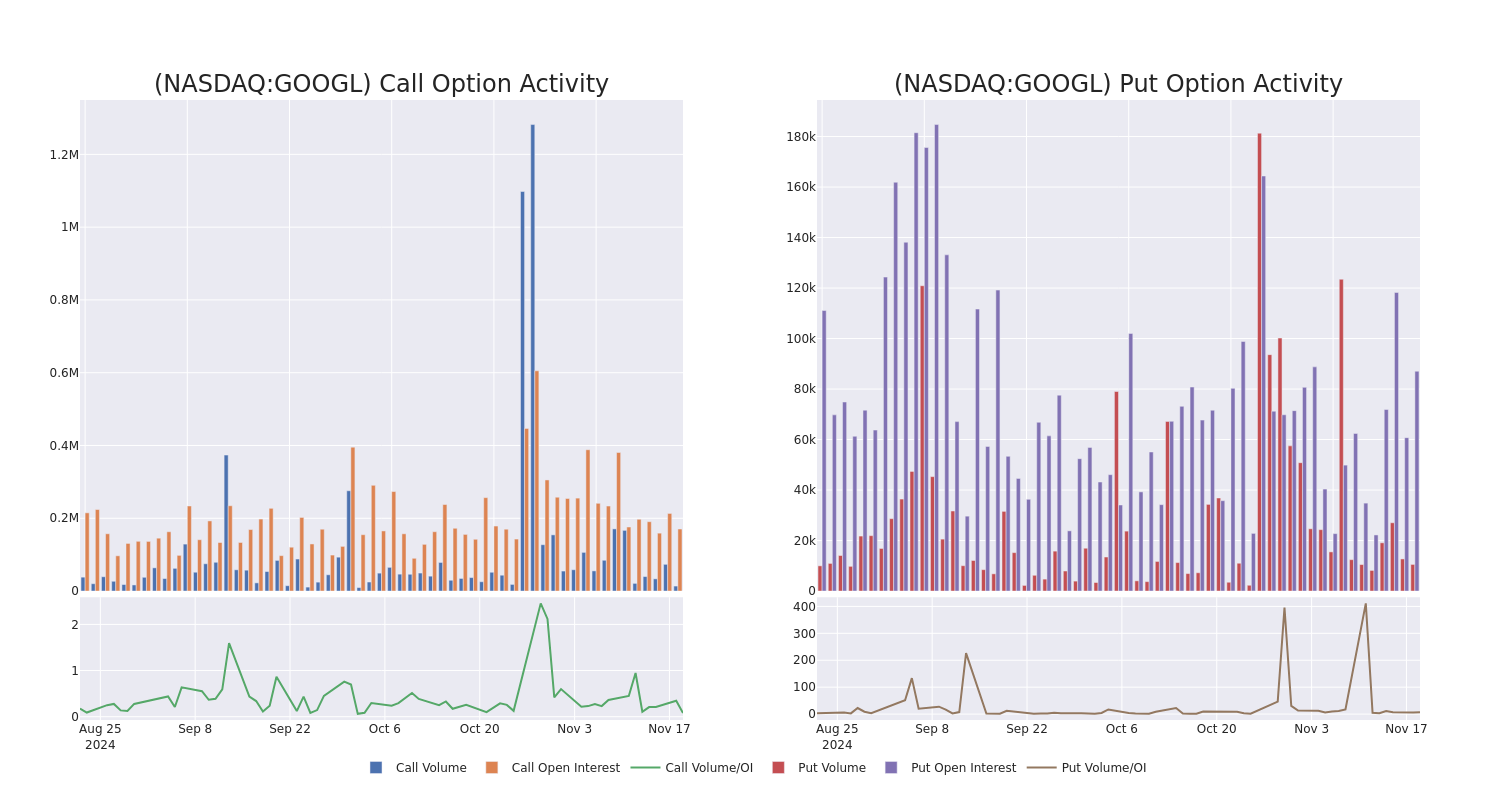
Looking at the volume and open interest is a powerful move while trading options. This data can help you track the liquidity and interest for Alphabet’s options for a given strike price. Below, we can observe the evolution of the volume and open interest of calls and puts, respectively, for all of Alphabet’s whale trades within a strike price range from $50.0 to $200.0 in the last 30 days.
Alphabet Option Volume And Open Interest Over Last 30 Days
Noteworthy Options Activity:
| Symbol | PUT/CALL | Trade Type | Sentiment | Exp. Date | Ask | Bid | Price | Strike Price | Total Trade Price | Open Interest | Volume |
|---|---|---|---|---|---|---|---|---|---|---|---|
| GOOGL | PUT | SWEEP | BULLISH | 06/20/25 | $6.4 | $6.3 | $6.3 | $160.00 | $962.1K | 7.3K | 3.4K |
| GOOGL | CALL | SWEEP | BULLISH | 01/17/25 | $127.05 | $126.8 | $127.05 | $50.00 | $190.5K | 3.6K | 183 |
| GOOGL | CALL | SWEEP | BEARISH | 03/21/25 | $7.8 | $7.6 | $7.6 | $185.00 | $152.0K | 3.4K | 205 |
| GOOGL | PUT | SWEEP | BEARISH | 01/16/26 | $19.25 | $19.0 | $19.16 | $180.00 | $138.0K | 1.5K | 230 |
| GOOGL | CALL | SWEEP | BULLISH | 01/17/25 | $127.1 | $126.75 | $127.1 | $50.00 | $127.1K | 3.6K | 98 |
About Alphabet
Alphabet is a holding company that wholly owns internet giant Google. The California-based company derives slightly less than 90% of its revenue from Google services, the vast majority of which is advertising sales. Alongside online ads, Google services houses sales stemming from Google’s subscription services (YouTube TV, YouTube Music among others), platforms (sales and in-app purchases on Play Store), and devices (Chromebooks, Pixel smartphones, and smart home products such as Chromecast). Google’s cloud computing platform, or GCP, accounts for roughly 10% of Alphabet’s revenue with the firm’s investments in up-and-coming technologies such as self-driving cars (Waymo), health (Verily), and internet access (Google Fiber) making up the rest.
Having examined the options trading patterns of Alphabet, our attention now turns directly to the company. This shift allows us to delve into its present market position and performance
Current Position of Alphabet
- Currently trading with a volume of 10,588,450, the GOOGL’s price is up by 0.7%, now at $176.52.
- RSI readings suggest the stock is currently may be approaching overbought.
- Anticipated earnings release is in 70 days.
Expert Opinions on Alphabet
In the last month, 5 experts released ratings on this stock with an average target price of $212.4.
Turn $1000 into $1270 in just 20 days?
20-year pro options trader reveals his one-line chart technique that shows when to buy and sell. Copy his trades, which have had averaged a 27% profit every 20 days. Click here for access.
* An analyst from Pivotal Research persists with their Buy rating on Alphabet, maintaining a target price of $225.
* Consistent in their evaluation, an analyst from RBC Capital keeps a Outperform rating on Alphabet with a target price of $210.
* An analyst from Truist Securities persists with their Buy rating on Alphabet, maintaining a target price of $225.
* Consistent in their evaluation, an analyst from Bernstein keeps a Market Perform rating on Alphabet with a target price of $185.
* An analyst from BMO Capital downgraded its action to Outperform with a price target of $217.
Options are a riskier asset compared to just trading the stock, but they have higher profit potential. Serious options traders manage this risk by educating themselves daily, scaling in and out of trades, following more than one indicator, and following the markets closely.
If you want to stay updated on the latest options trades for Alphabet, Benzinga Pro gives you real-time options trades alerts.
Market News and Data brought to you by Benzinga APIs
© 2024 Benzinga.com. Benzinga does not provide investment advice. All rights reserved.
How To Earn $500 A Month From Target Stock Ahead Of Q3 Earnings
Some investors may be eyeing potential gains from the Minneapolis-based company’s dividends. Target currently offers an annual dividend yield of 2.86%. That’s a quarterly dividend amount of $1.12 per share ($4.48 a year).
To figure out how to earn $500 monthly from Target, we start with the yearly target of $6,000 ($500 x 12 months). Next, we take this amount and divide it by Target’s $4.48 dividend: $6,000 / $4.48 = 1,339 shares.
So, an investor would need to own approximately $209,634 worth of Target, or 1,339 shares to generate a monthly dividend income of $500.
Assuming a more conservative goal of $100 monthly ($1,200 annually), we do the same calculation: $1,200 / $4.48 = 268 shares, or $41,958 to generate a monthly dividend income of $100.
The dividend yield can change on a rolling basis; the dividend payment and the stock price both fluctuate over time.
The dividend yield is calculated by dividing the annual dividend payment by the current stock price. As the stock price changes, the dividend yield will also change.
For example, if a stock pays an annual dividend of $2 and its current price is $50, its dividend yield would be 4%. However, if the stock price increases to $60, the dividend yield would decrease to 3.33% ($2/$60).
Conversely, if the stock price decreases to $40, the dividend yield would increase to 5% ($2/$40).
Further, the dividend payment itself can also change over time, which can also impact the dividend yield. If a company increases its dividend payment, the dividend yield will increase even if the stock price remains the same. Similarly, if a company decreases its dividend payment, the dividend yield will decrease.
Price Action: Target shares gained by 2.9% to close at $156.56 on Monday.
Analysts expect Target to report quarterly earnings at $2.30 per share. That’s up from $2.10 per share a year ago. The retailer projects to report quarterly revenue of $25.9 billion, compared to $25.4 billion a year earlier, according to data from Benzinga Pro.
On Nov. 13, Telsey Advisory Group analyst Joseph Feldman maintained Target with an Outperform rating and maintained a $195 price target.
Read More:
Image: Shutterstock
Market News and Data brought to you by Benzinga APIs
© 2024 Benzinga.com. Benzinga does not provide investment advice. All rights reserved.
What's Going On With Target Stock Today?
Target Corporation TGT shares are trading slightly higher following strong earnings from top peer Walmart Inc. WMT.
Today, Walmart announced third-quarter results and raised its fiscal-2025 guidance. The retailer reported adjusted EPS of 58 cents, beating the consensus of 53 cents. Sales were $169.59 billion, up 5.5% year over year or 6.2% (at constant currency), beating the consensus of $167.72 billion.
For FY25, Walmart raised its adjusted EPS outlook to $2.42 – $2.47 (from $2.35 – $2.43), vs. the consensus of $2.45. Walmart boosted FY25 net sales (at constant currency) growth guidance to 4.8% – 5.1% from 3.75% – 4.75% earlier.
Meanwhile, Target will report its third-quarter results on Wednesday, November 20, 2024, at 7:00 a.m. central time.
Last week, Target announced its store hours for Black Friday week and the holiday season.
On Friday, November 29, Target will open its doors early at 6 a.m. local time, offering exclusive items such as the “Taylor Swift | The Eras Tour Book” and “The Tortured Poets Department: The Anthology” on CD and vinyl.
These items will be available only at Target, along with top deals across the store. Special offers will be available in-store, online, and through the Target app, providing shoppers with great value for their holiday purchases.
According to Benzinga Pro, TGT stock has gained over 20.76% in the past year. Investors can gain exposure to the stock via SPDR Select Sector Fund – Consumer Staples XLP and VanEck Retail ETF RTH.
Price Action: TGT shares are trading higher by 0.57% to $157.46 at last check Tuesday.
Photo via Shutterstock
Read Next:
This content was partially produced with the help of AI tools and was reviewed and published by Benzinga editors.
Market News and Data brought to you by Benzinga APIs
© 2024 Benzinga.com. Benzinga does not provide investment advice. All rights reserved.
Rohit Kapoor Takes Money Off The Table, Sells $4.53M In ExlService Holdings Stock
Disclosed on November 18, Rohit Kapoor, Chairman & CEO at ExlService Holdings EXLS, executed a substantial insider sell as per the latest SEC filing.
What Happened: A Form 4 filing with the U.S. Securities and Exchange Commission on Monday outlined that Kapoor executed a sale of 100,000 shares of ExlService Holdings with a total value of $4,531,000.
Monitoring the market, ExlService Holdings‘s shares down by 0.0% at $44.35 during Tuesday’s morning.
About ExlService Holdings
ExlService Holdings Inc. is a business process management company that provides digital operations and analytical services to clients driving enterprise-scale business transformation initiatives that leverage company’s deep expertise in analytics, AI, ML and cloud. The company offers business process outsourcing and automation services, and data-driven insights to customers across multiple industries. The company operates through four segments based on the products and services offered and markets served: Insurance, Healthcare, Emerging, Analytics. The vast majority of the company’s revenue is earned in the United States, and more than half of its revenue comes from Analytics segment.
Financial Milestones: ExlService Holdings’s Journey
Revenue Growth: Over the 3 months period, ExlService Holdings showcased positive performance, achieving a revenue growth rate of 14.87% as of 30 September, 2024. This reflects a substantial increase in the company’s top-line earnings. As compared to its peers, the company achieved a growth rate higher than the average among peers in Industrials sector.
Exploring Profitability:
-
Gross Margin: With a low gross margin of 37.76%, the company exhibits below-average profitability, signaling potential struggles in cost efficiency compared to its industry peers.
-
Earnings per Share (EPS): ExlService Holdings’s EPS reflects a decline, falling below the industry average with a current EPS of 0.33.
Debt Management: ExlService Holdings’s debt-to-equity ratio is below industry norms, indicating a sound financial structure with a ratio of 0.47.
Valuation Analysis:
-
Price to Earnings (P/E) Ratio: A higher-than-average P/E ratio of 38.9 suggests caution, as the stock may be overvalued in the eyes of investors.
-
Price to Sales (P/S) Ratio: With a higher-than-average P/S ratio of 4.14, ExlService Holdings’s stock is perceived as being overvalued in the market, particularly in relation to sales performance.
-
EV/EBITDA Analysis (Enterprise Value to its Earnings Before Interest, Taxes, Depreciation & Amortization): ExlService Holdings’s EV/EBITDA ratio stands at 21.48, surpassing industry benchmarks. This places the company in a position with a higher-than-average market valuation.
Market Capitalization: Boasting an elevated market capitalization, the company surpasses industry averages. This signals substantial size and strong market recognition.
Now trade stocks online commission free with Charles Schwab, a trusted and complete investment firm.
Understanding the Significance of Insider Transactions
Insightful as they may be, insider transactions should be considered alongside a thorough examination of other investment criteria.
Exploring the legal landscape, an “insider” is defined as any officer, director, or beneficial owner holding more than ten percent of a company’s equity securities, as stipulated by Section 12 of the Securities Exchange Act of 1934. This encompasses executives in the c-suite and major hedge funds. These insiders are required to report their transactions through a Form 4 filing, which must be submitted within two business days of the transaction.
Highlighted by a company insider’s new purchase, there’s a positive anticipation for the stock to rise.
But, insider sells may not necessarily indicate a bearish view and can be motivated by various factors.
A Deep Dive into Insider Transaction Codes
In the domain of transactions, investors frequently turn their focus to those taking place in the open market, as meticulously outlined in Table I of the Form 4 filing. A P in Box 3 indicates a purchase, while S signifies a sale. Transaction code C signals the conversion of an option, and transaction code A denotes a grant, award, or other acquisition of securities from the company.
Check Out The Full List Of ExlService Holdings’s Insider Trades.
Insider Buying Alert: Profit from C-Suite Moves
Benzinga Edge reveals every insider trade in real-time. Don’t miss the next big stock move driven by insider confidence. Unlock this ultimate sentiment indicator now. Click here for access.
This article was generated by Benzinga’s automated content engine and reviewed by an editor.
Market News and Data brought to you by Benzinga APIs
© 2024 Benzinga.com. Benzinga does not provide investment advice. All rights reserved.
A Look Ahead: Canaan's Earnings Forecast
Canaan CAN is set to give its latest quarterly earnings report on Wednesday, 2024-11-20. Here’s what investors need to know before the announcement.
Analysts estimate that Canaan will report an earnings per share (EPS) of $-0.15.
Investors in Canaan are eagerly awaiting the company’s announcement, hoping for news of surpassing estimates and positive guidance for the next quarter.
It’s worth noting for new investors that stock prices can be heavily influenced by future projections rather than just past performance.
Past Earnings Performance
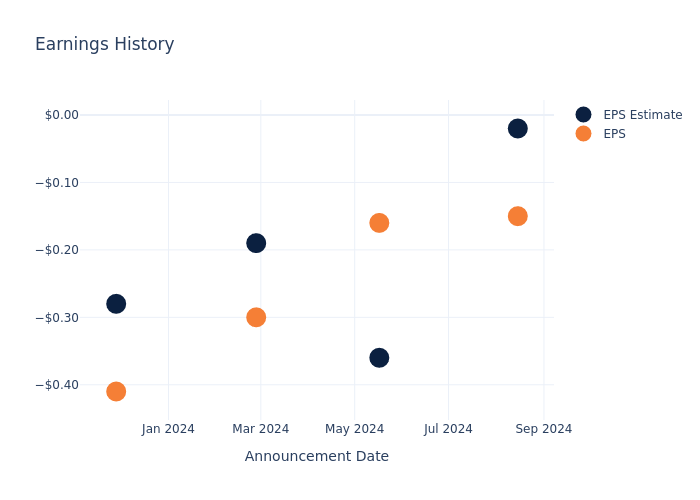
In the previous earnings release, the company missed EPS by $0.13, leading to a 3.74% increase in the share price the following trading session.
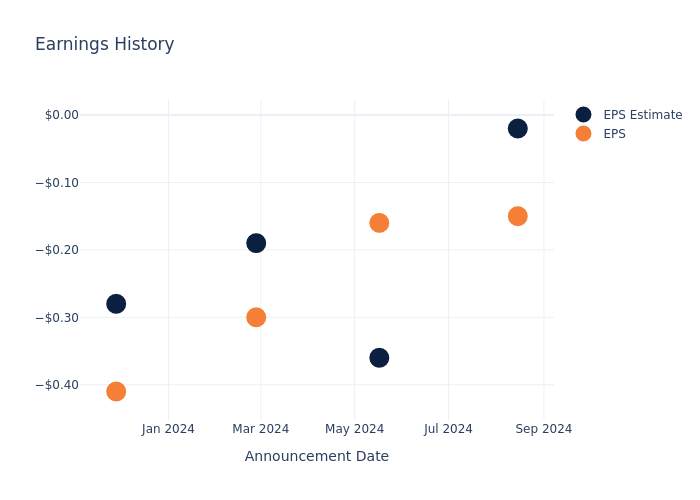
Here’s a look at Canaan’s past performance and the resulting price change:
| Quarter | Q2 2024 | Q1 2024 | Q4 2023 | Q3 2023 |
|---|---|---|---|---|
| EPS Estimate | -0.02 | -0.36 | -0.19 | -0.28 |
| EPS Actual | -0.15 | -0.16 | -0.30 | -0.41 |
| Price Change % | 4.0% | -10.0% | 6.0% | -7.000000000000001% |
Canaan Share Price Analysis
Shares of Canaan were trading at $1.53 as of November 18. Over the last 52-week period, shares are down 1.55%. Given that these returns are generally negative, long-term shareholders are likely bearish going into this earnings release.
To track all earnings releases for Canaan visit their earnings calendar on our site.
This article was generated by Benzinga’s automated content engine and reviewed by an editor.
Market News and Data brought to you by Benzinga APIs
© 2024 Benzinga.com. Benzinga does not provide investment advice. All rights reserved.
Cathie Wood Is Selling Palantir Stock. Here's Why That Makes Sense.
The artificial intelligence (AI) narrative is entering a new chapter, and it’s time for the “Magnificent Seven” stocks to move over. Throughout 2024, investors have been presented with a host of new, emerging players that are working alongside big tech and have proven they are here to compete in the AI realm.
Start Your Mornings Smarter! Wake up with Breakfast news in your inbox every market day. Sign Up For Free »
In my eyes, Palantir Technologies (NYSE: PLTR) has become the most interesting case study among smaller technology companies. So far in 2024, shares of Palantir have gained 283% as of this writing, and the company stands as the best-performing stock in the S&P 500 this year.
And yet, as shares of Palantir continue to reach new highs, one notable investor has been dumping the stock in droves. I’m going to outline the moves Cathie Wood of Ark Invest is making, and detail why selling Palantir stock right now actually makes a lot of sense.
One of the more interesting things about Ark Invest is that the firm publishes a breakdown of the stocks it buys and sells each trading day.
|
Date |
Shares of PLTR Sold |
|---|---|
|
09/11/24 |
184,051 |
|
09/13/24 |
13,713 |
|
09/17/24 |
8,555 |
|
09/18/24 |
32,772 |
|
09/20/24 |
16,053 |
|
09/23/24 |
7,747 |
|
09/25/24 |
62,809 |
|
10/28/24 |
128,908 |
|
10/30/24 |
372,730 |
|
11/01/24 |
227,699 |
|
11/04/24 |
158,457 |
|
11/05/24 |
211,203 |
|
11/07/24 |
264,513 |
|
11/15/24 |
197,847 |
Data source: Ark Invest, Cathiesark.com. Table by author.
According to that data, Wood and her team reduced their holdings of Palantir across Ark’s various funds by roughly 1.9 million shares between Sept. 11 and Nov. 15.
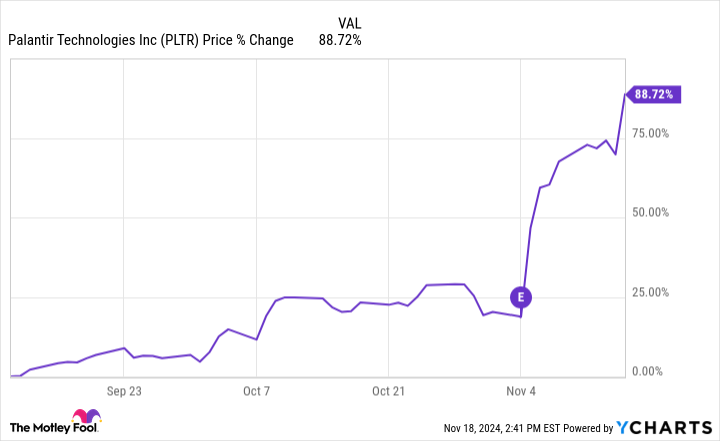
Shares of Palantir have soared throughout 2024. But between Sept. 11 and Nov. 15 (the period of Ark’s selling), Palantir stock gained 89%.
In the chart above, the date of Palantir’s third-quarter earnings release is marked with a purple circle with the letter “E” in the center. As you can see, Palantir stock has risen considerably following that blowout Q3 report.
While such gains have been great for Palantir shareholders, the magnitude of these upswings should come with a hard look at the fundamentals. As illustrated in the graph below, Palantir’s price-to-sales (P/S) multiple of 60 is the highest among leading software-as-a-service (SaaS) businesses — and it’s not particularly close, either.
I cannot stress this point enough: Palantir is trading at more 60 times sales, not earnings. While Palantir is indeed generating positive net income and free cash flow, both measures are still relatively small right now.
Lululemon Athletica Unusual Options Activity
Deep-pocketed investors have adopted a bullish approach towards Lululemon Athletica LULU, and it’s something market players shouldn’t ignore. Our tracking of public options records at Benzinga unveiled this significant move today. The identity of these investors remains unknown, but such a substantial move in LULU usually suggests something big is about to happen.
We gleaned this information from our observations today when Benzinga’s options scanner highlighted 8 extraordinary options activities for Lululemon Athletica. This level of activity is out of the ordinary.
The general mood among these heavyweight investors is divided, with 50% leaning bullish and 12% bearish. Among these notable options, 2 are puts, totaling $58,060, and 6 are calls, amounting to $376,940.
Expected Price Movements
Based on the trading activity, it appears that the significant investors are aiming for a price territory stretching from $290.0 to $325.0 for Lululemon Athletica over the recent three months.
Volume & Open Interest Development
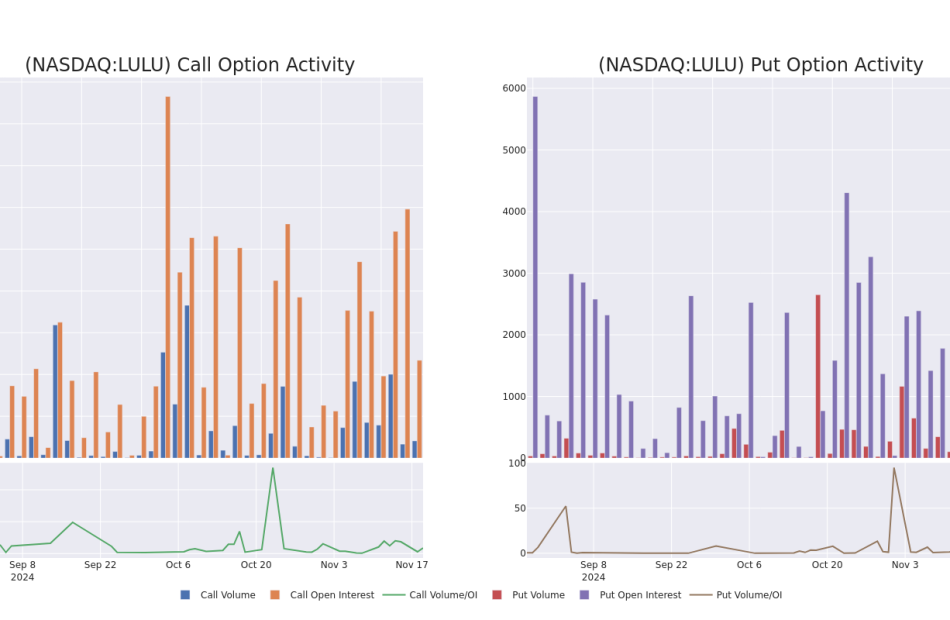
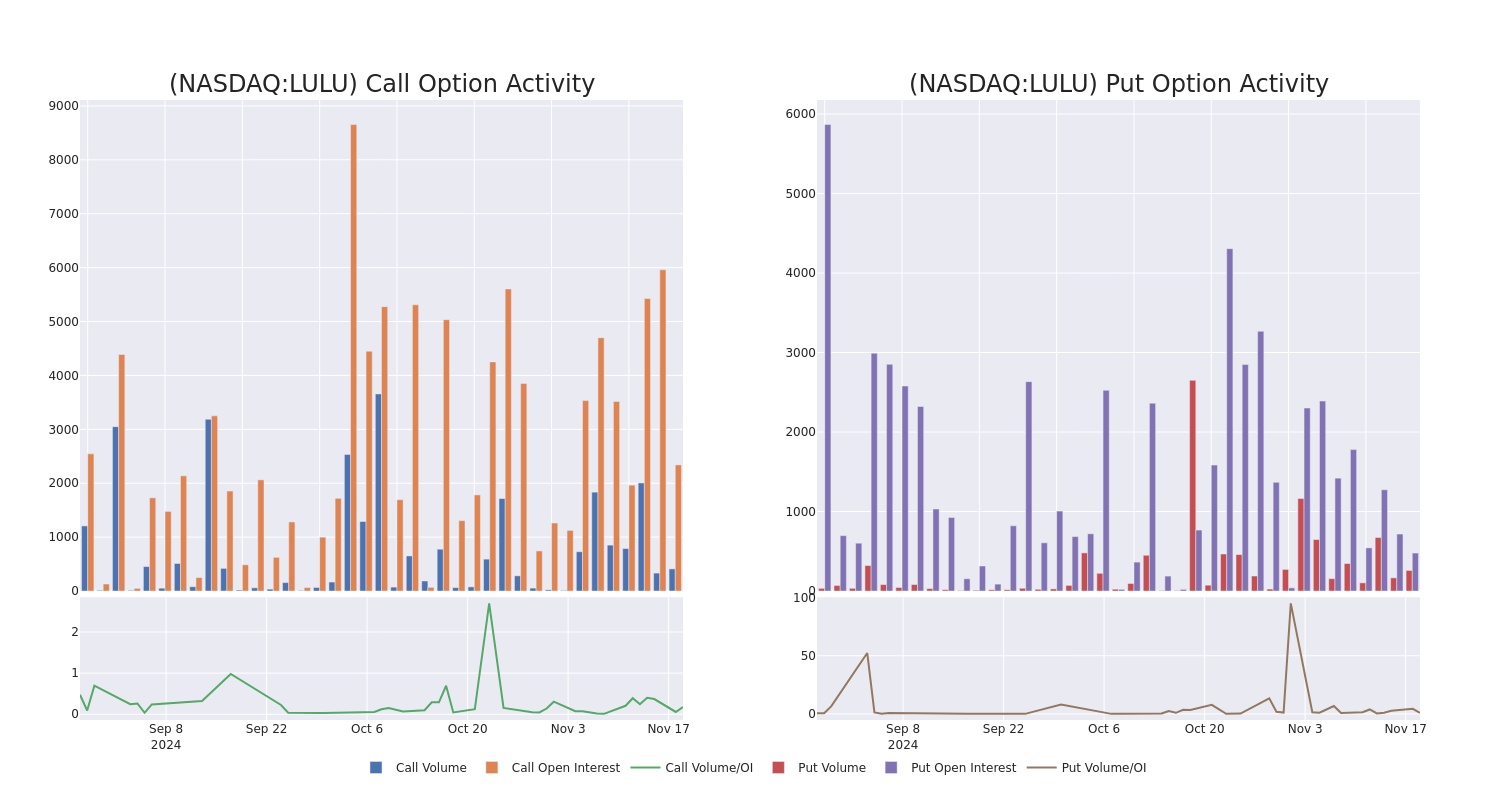
Assessing the volume and open interest is a strategic step in options trading. These metrics shed light on the liquidity and investor interest in Lululemon Athletica’s options at specified strike prices. The forthcoming data visualizes the fluctuation in volume and open interest for both calls and puts, linked to Lululemon Athletica’s substantial trades, within a strike price spectrum from $290.0 to $325.0 over the preceding 30 days.
Lululemon Athletica 30-Day Option Volume & Interest Snapshot
Biggest Options Spotted:
| Symbol | PUT/CALL | Trade Type | Sentiment | Exp. Date | Ask | Bid | Price | Strike Price | Total Trade Price | Open Interest | Volume |
|---|---|---|---|---|---|---|---|---|---|---|---|
| LULU | CALL | SWEEP | NEUTRAL | 01/17/25 | $32.85 | $32.35 | $32.85 | $290.00 | $95.2K | 1.1K | 110 |
| LULU | CALL | TRADE | BEARISH | 01/17/25 | $33.2 | $31.0 | $31.6 | $290.00 | $94.8K | 1.1K | 22 |
| LULU | CALL | TRADE | BULLISH | 01/17/25 | $32.45 | $32.45 | $32.45 | $290.00 | $81.1K | 1.1K | 78 |
| LULU | CALL | SWEEP | BULLISH | 11/22/24 | $5.1 | $4.05 | $5.1 | $302.50 | $40.8K | 251 | 138 |
| LULU | CALL | TRADE | BULLISH | 01/17/25 | $24.7 | $24.35 | $24.7 | $300.00 | $37.0K | 792 | 3 |
About Lululemon Athletica
Lululemon Athletica designs, distributes, and markets athletic apparel, footwear, and accessories for women, men, and girls. Lululemon offers pants, shorts, tops, and jackets for both leisure and athletic activities such as yoga and running. The company also sells fitness accessories, such as bags, yoga mats, and equipment. Lululemon sells its products through more than 700 company-owned stores in about 20 countries, e-commerce, outlets, and wholesale accounts. The company was founded in 1998 and is based in Vancouver, Canada.
Following our analysis of the options activities associated with Lululemon Athletica, we pivot to a closer look at the company’s own performance.
Lululemon Athletica’s Current Market Status
- Trading volume stands at 525,621, with LULU’s price down by -1.25%, positioned at $305.66.
- RSI indicators show the stock to be is currently neutral between overbought and oversold.
- Earnings announcement expected in 16 days.
What Analysts Are Saying About Lululemon Athletica
In the last month, 2 experts released ratings on this stock with an average target price of $370.0.
Turn $1000 into $1270 in just 20 days?
20-year pro options trader reveals his one-line chart technique that shows when to buy and sell. Copy his trades, which have had averaged a 27% profit every 20 days. Click here for access.
* An analyst from Baird persists with their Outperform rating on Lululemon Athletica, maintaining a target price of $380.
* Consistent in their evaluation, an analyst from Truist Securities keeps a Buy rating on Lululemon Athletica with a target price of $360.
Options trading presents higher risks and potential rewards. Astute traders manage these risks by continually educating themselves, adapting their strategies, monitoring multiple indicators, and keeping a close eye on market movements. Stay informed about the latest Lululemon Athletica options trades with real-time alerts from Benzinga Pro.
Market News and Data brought to you by Benzinga APIs
© 2024 Benzinga.com. Benzinga does not provide investment advice. All rights reserved.
Glycerol Market Size Set to Achieve USD 454.1 Billion Milestone by 2031 with 6.3% CAGR : Transparency Market Research, Inc.
Wilmington, Delaware, United States, Transparency Market Research, Inc. , Nov. 19, 2024 (GLOBE NEWSWIRE) — The global glycerol market is estimated to flourish at a CAGR of 6.3% from 2021 to 2031. Transparency Market Research projects that the overall sales revenue for glycerol is estimated to reach US$ 454.1 billion by the end of 2031.
A significant driver is the emergence of glycerol as a feedstock for bioenergy production. Innovations in biotechnological processes are transforming glycerol into biofuels, providing an alternative and sustainable energy source. This not only addresses environmental concerns but also taps into untapped markets beyond traditional glycerol applications.
Download Sample Pages Of The Report: https://www.transparencymarketresearch.com/sample/sample.php?flag=S&rep_id=917
Glycerol’s role in the creation of sustainable packaging materials is quietly shaping the industry. As the world embraces eco-conscious practices, glycerol-based polymers are gaining traction as a bio-based alternative, reducing reliance on conventional plastics and minimizing environmental impact.
The utilization of glycerol in advanced pharmaceutical formulations represents a prominent driver. Glycerol’s properties make it an ideal candidate for drug delivery systems, enhancing the efficacy of pharmaceutical products and broadening its applications within the healthcare sector.

Glycerol Market: Competitive Landscape
The glycerol market unfolds within a dynamic competitive landscape shaped by key players vying for market share. Leading companies like Cargill, Archer Daniels Midland Company, and Wilmar International drive innovation, offering a diverse range of glycerol products.
Intense competition fosters technological advancements, pushing the market towards sustainable practices and expanding applications beyond traditional industries. Strategic collaborations, mergers, and acquisitions further characterize the landscape, as companies seek to fortify their positions in this evolving market.
As glycerol’s significance extends into pharmaceuticals, food, and personal care, the competitive dynamics are pivotal in shaping the industry’s trajectory. Some prominent manufacturers are as follows:
- P&G Chemicals
- IOI Group
- Emery Oleochemicals
- Kuala Lumpur Berhad
- Dial Corporation
- Croda
- Wilmar International
- Dow Chemicals
- Godrej Industries Ltd.
- Sofiprotéol Group
Key Findings of the Market Report
- The soap industry dominates glycerol production, utilizing it as a byproduct in soap manufacturing, contributing significantly to market volume.
- Personal care and pharmaceuticals lead the glycerol market, driven by its essential role in cosmetics, pharmaceuticals, and skincare products.
- The Asia Pacific region leads the glycerol market, driven by rapid industrialization, a growing consumer base, and diverse applications.
Glycerol Market Growth Drivers & Trends
- Glycerol’s versatile applications in pharmaceuticals, cosmetics, and food industries drive market growth, fostering increased demand for this multi-functional compound.
- Growing emphasis on sustainable solutions propels the glycerol market, with bio-based glycerol gaining prominence as an eco-friendly alternative.
- Ongoing research and development efforts focus on innovative glycerol production methods, enhancing efficiency, and ensuring a continuous influx of new applications.
- Increasing industrial activities, especially in the Asia Pacific, contribute to heightened glycerol demand as a key ingredient in various manufacturing processes.
- Partnerships and collaborations among major industry players drive glycerol market expansion, fostering innovation and ensuring a competitive edge in this evolving landscape.
Global Glycerol Market: Regional Profile
- In North America, the glycerol market experiences robust growth driven by its diverse applications in pharmaceuticals, cosmetics, and the food and beverage industry. The United States, in particular, stands as a major contributor to the region’s market, hosting prominent players such as Cargill and Archer Daniels Midland Company. The market in North America is characterized by a high level of technological innovation, with a focus on enhancing glycerol production efficiency and exploring novel applications.
- Europe stands out as a key player in the global glycerol market, driven by a growing demand for sustainable and bio-based products. Countries like Germany, France, and the Netherlands house major glycerol manufacturers, with companies like Croda International and BASF leading the charge. The European market is significantly influenced by the rising trend of bio-based chemicals, with glycerol serving as a crucial ingredient in various sustainable formulations. Stricter regulations promoting environmental responsibility further underscore the importance of glycerol in the region, as it aligns with the European Union’s ambitious sustainability goals.
- The Asia Pacific region emerges as a powerhouse in the glycerol market, fueled by rapid industrialization, a burgeoning consumer base, and diverse applications. Countries like China, India, and Malaysia witness a surge in glycerol consumption, with IOI Oleochemicals and Wilmar International spearheading the market. The region’s industrial activities contribute to heightened glycerol demand, especially in sectors such as personal care and textiles.
Download PDF Brochure: https://www.transparencymarketresearch.com/sample/sample.php?flag=S&rep_id=917
Product Portfolio
- P&G Chemicals offers innovative solutions for diverse industries, delivering high-quality chemicals that drive performance and sustainability. From surfactants to specialty ingredients, their portfolio reflects a commitment to excellence and environmental responsibility.
- IOI Group’s chemical division pioneers sustainable solutions. Their diverse product portfolio, including oleochemicals and specialty fats, caters to industries worldwide, emphasizing quality, reliability, and eco-friendly practices.
- Emery Oleochemicals excels in providing natural-based chemicals for various applications. Their product portfolio encompasses bio-based solutions, specialty esters, and renewable polymer additives, embodying a commitment to innovation, performance, and environmental consciousness.
Glycerol Market: Key Segments
By Production Source
- Biodiesel
- Fatty Acids
- Fatty Alcohols
- Soap Industry
By Application
- Personal Care and Pharmaceuticals
- Alkyd Resins
- Food and Beverages
- Polyether Polyols
- Tobacco Humectants
- Others (including Explosives, Textile, and Paper)
By Region
- North America
- Europe
- Asia Pacific
- Latin America
- Middle East & Africa
Enquire Before Buying: https://www.transparencymarketresearch.com/checkout.php?rep_id=917<ype=S
Browse More Reports by TMR:
- Aluminum Castings Market– The global aluminum castings market size stood at US$ 74.3 Bn in 2022. It is expected to increase at a CAGR of 5.4% from 2023 to 2031 and reach US$ 119.3 Bn by the end of 2031.
- U.S. Fiberglass Tanks Market – The U.S. fiberglass tanks market size is estimated to grow at a CAGR of 6.8% from 2024 to 2034 and reach US$ 1.3 Billion by the end of 2034.
- U.S. Acoustics Market– The U.S. acoustics market is estimated to grow at a CAGR of 5.2% from 2024 to 2034 and reach US$ 2.3 Billion by the end of 2034.
About Transparency Market Research
Transparency Market Research, a global market research company registered at Wilmington, Delaware, United States, provides custom research and consulting services. Our exclusive blend of quantitative forecasting and trends analysis provides forward-looking insights for thousands of decision makers. Our experienced team of Analysts, Researchers, and Consultants use proprietary data sources and various tools & techniques to gather and analyses information.
Our data repository is continuously updated and revised by a team of research experts, so that it always reflects the latest trends and information. With a broad research and analysis capability, Transparency Market Research employs rigorous primary and secondary research techniques in developing distinctive data sets and research material for business reports.
Contact:
Transparency Market Research Inc.
CORPORATE HEADQUARTER DOWNTOWN,
1000 N. West Street,
Suite 1200, Wilmington, Delaware 19801 USA
Tel: +1-518-618-1030
USA – Canada Toll Free: 866-552-3453
Website: https://www.transparencymarketresearch.com
Email: sales@transparencymarketresearch.com
Follow Us: LinkedIn| Twitter| Blog | YouTube

Market News and Data brought to you by Benzinga APIs
© 2024 Benzinga.com. Benzinga does not provide investment advice. All rights reserved.


