Despite the stellar numbers in its latest earnings report, Nvidia Corp NVDA stock slipped 3% in after-hours trading on Wednesday.
In premarket Thursday, Nvidia shares swung between gains and losses, ultimately opening 5% higher before losing steam.
By mid-morning, Nvidia shares were down 1.23%, trading at $144.10—a move many attribute to the priced-for-perfection environment surrounding the AI giant. It seems the market's insatiable appetite for upside surprises left even Nvidia's blockbuster results struggling to impress.
Nvidia Stock’s Underlying Resilience
The Santa Clara, California-based company reported an 8% beat on earnings per share and a nearly 6% revenue beat compared to estimates. Revenue soared 93.71% year-over-year, reaching $35.1 billion, fueled by the relentless demand for AI chips.
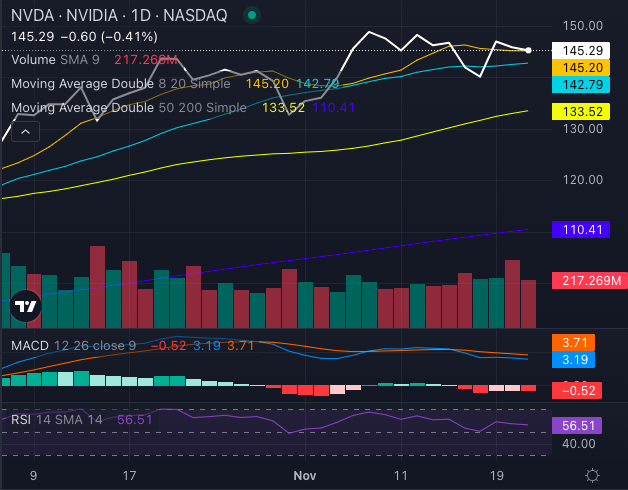
Despite Thursday’s volatile trading, Nvidia's technical indicators suggest underlying resilience.

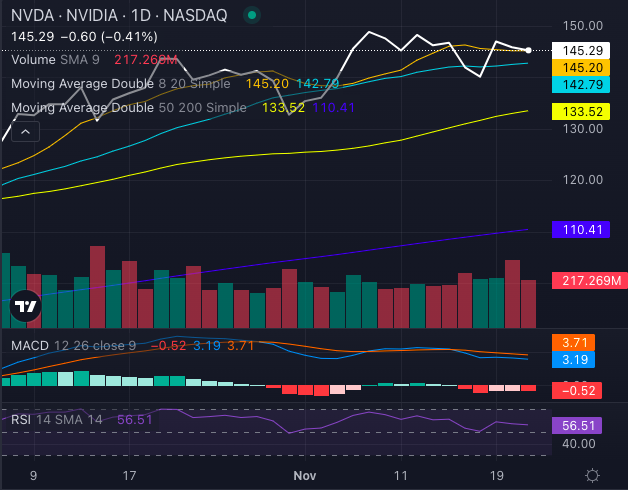
Chart created using Benzinga Pro
The stock is trading above its eight-day, 20-day, 50-day and 200-day simple moving averages, signaling a strong bullish foundation:
- 8-day SMA: Nvidia sits at $145.29, above its $145.20 SMA, generating a short-term bullish signal.
- 20-day SMA: The stock's $145.29 price exceeds the $142.79 average, reinforcing the bullish narrative.
- 50-day SMA: Nvidia's $145.29 eclipses its 50-day average of $133.52, pointing to solid momentum.
- 200-day SMA: At $110.41, the 200-day average remains far below current levels, reflecting long-term bullish strength.
The MACD (moving average convergence/divergence) indicator also supports a bullish outlook with a reading of 3.19, while the RSI (relative strength index) at 56.51 shows the stock is comfortably neutral, leaving room for further upward movement without triggering overbought alarms.
Can Nvidia Break Free?
Nvidia's fundamentals remain as robust as its AI ambitions, but the question lingers: Can the stock sustain its high-altitude trajectory amid sky-high expectations?
Investors will be watching closely as Nvidia tries to stabilize after its earnings-induced turbulence.
Read Next:
Image: Unsplash
© 2024 Benzinga.com. Benzinga does not provide investment advice. All rights reserved.


