High-rolling investors have positioned themselves bullish on T-Mobile US TMUS, and it's important for retail traders to take note. This activity came to our attention today through Benzinga's tracking of publicly available options data. The identities of these investors are uncertain, but such a significant move in TMUS often signals that someone has privileged information.
Today, Benzinga's options scanner spotted 11 options trades for T-Mobile US. This is not a typical pattern.
The sentiment among these major traders is split, with 45% bullish and 27% bearish. Among all the options we identified, there was one put, amounting to $48,870, and 10 calls, totaling $1,051,318.
What's The Price Target?
Taking into account the Volume and Open Interest on these contracts, it appears that whales have been targeting a price range from $170.0 to $300.0 for T-Mobile US over the last 3 months.
Volume & Open Interest Trends
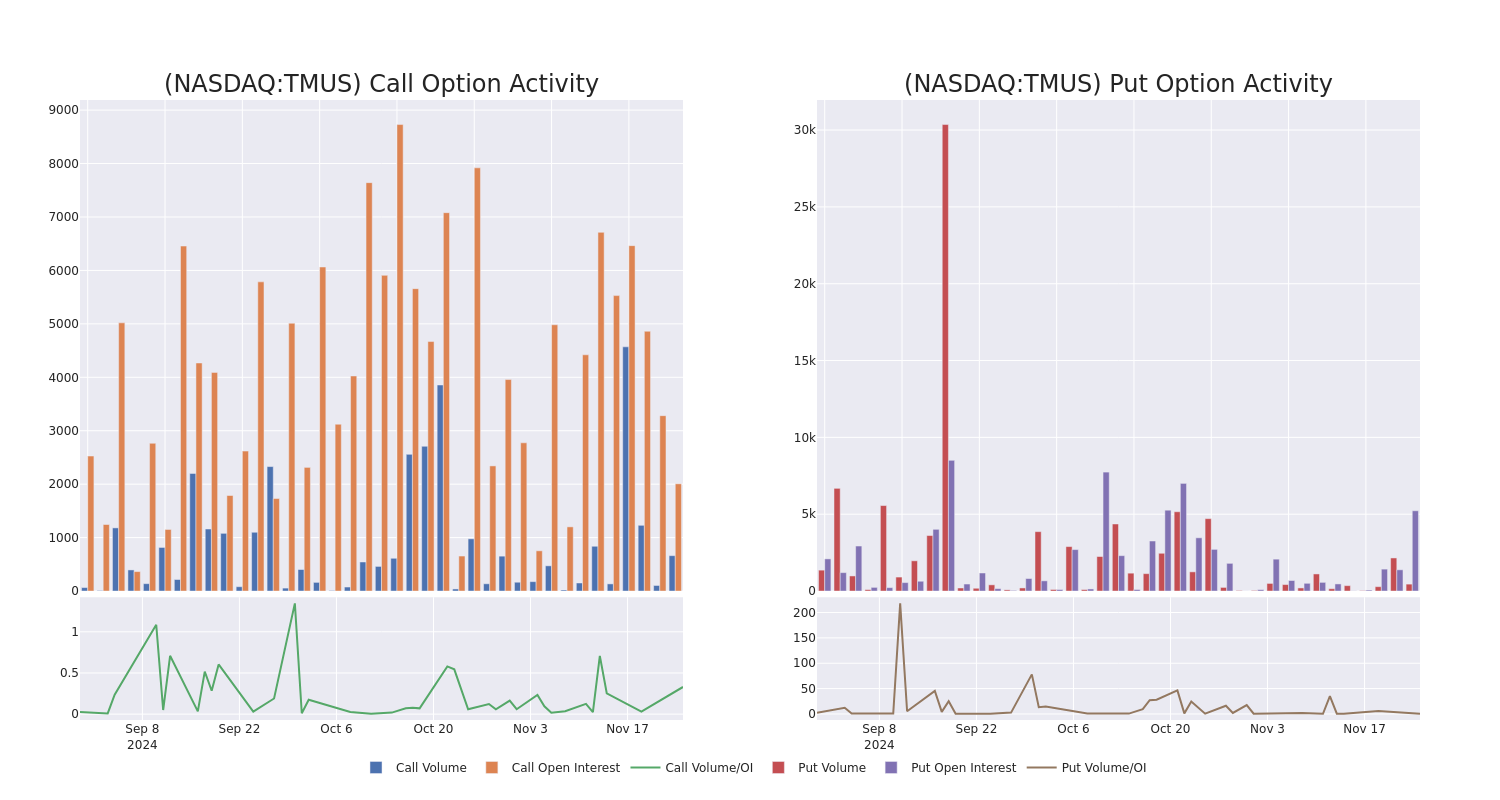
In terms of liquidity and interest, the mean open interest for T-Mobile US options trades today is 1006.56 with a total volume of 937.00.
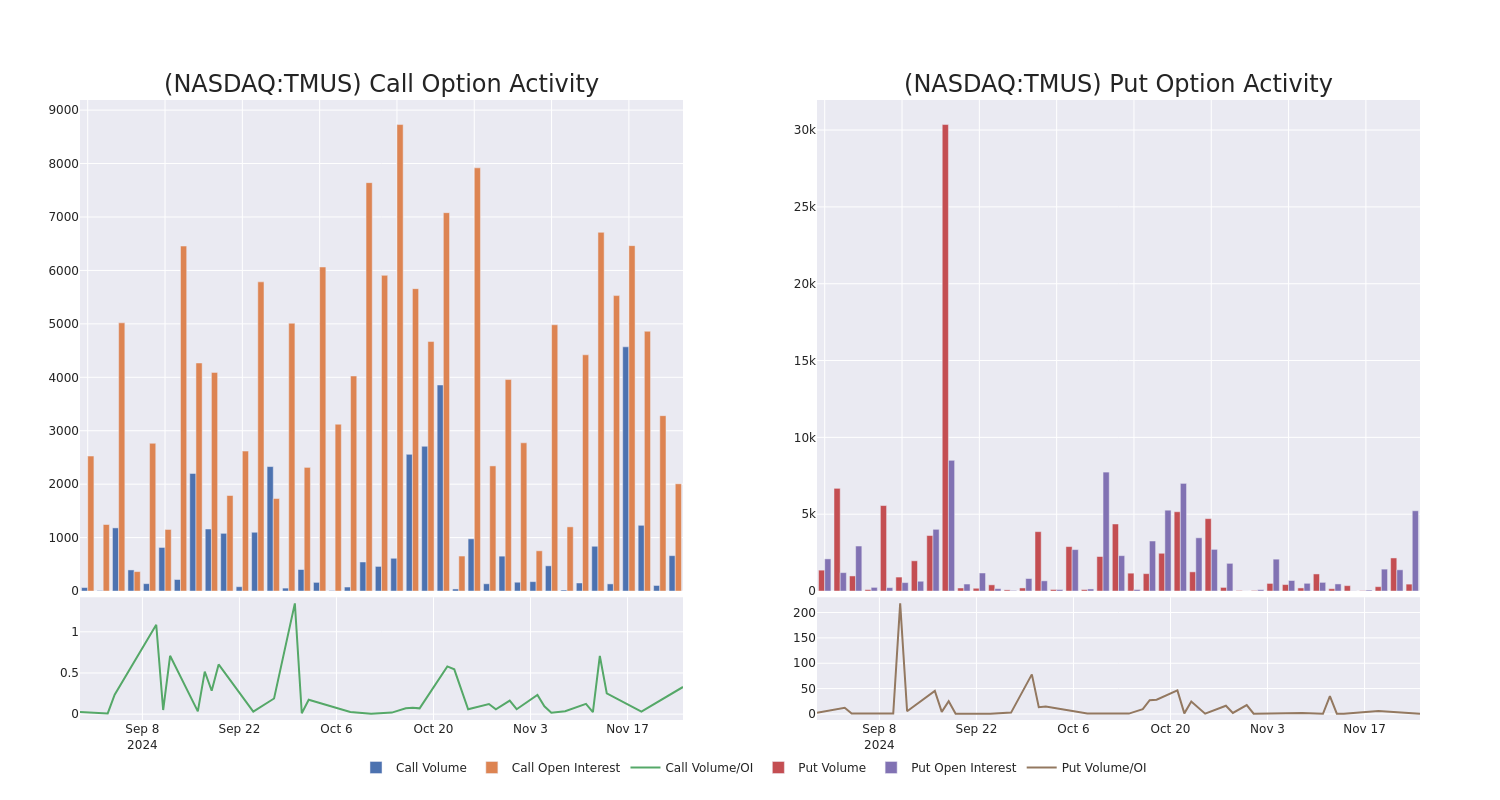
In the following chart, we are able to follow the development of volume and open interest of call and put options for T-Mobile US's big money trades within a strike price range of $170.0 to $300.0 over the last 30 days.
T-Mobile US Option Activity Analysis: Last 30 Days

Noteworthy Options Activity:
| Symbol | PUT/CALL | Trade Type | Sentiment | Exp. Date | Ask | Bid | Price | Strike Price | Total Trade Price | Open Interest | Volume |
|---|---|---|---|---|---|---|---|---|---|---|---|
| TMUS | CALL | SWEEP | BEARISH | 01/17/25 | $53.9 | $52.55 | $52.64 | $195.00 | $263.3K | 2.9K | 50 |
| TMUS | CALL | SWEEP | BEARISH | 01/17/25 | $39.0 | $38.05 | $38.05 | $210.00 | $190.2K | 1.0K | 88 |
| TMUS | CALL | SWEEP | BULLISH | 01/17/25 | $28.5 | $28.3 | $28.5 | $220.00 | $114.0K | 1.4K | 81 |
| TMUS | CALL | SWEEP | BULLISH | 01/17/25 | $37.95 | $37.9 | $37.95 | $210.00 | $113.8K | 1.0K | 32 |
| TMUS | CALL | SWEEP | BEARISH | 12/20/24 | $2.14 | $1.85 | $2.14 | $252.50 | $89.3K | 75 | 476 |
About T-Mobile US
Deutsche Telekom merged its T-Mobile USA unit with prepaid specialist MetroPCS in 2013, and that firm merged with Sprint in 2020, creating the second-largest wireless carrier in the us. T-Mobile now serves 77 million postpaid and 21 million prepaid phone customers, equal to around 30% of the us retail wireless market. The firm entered the fixed-wireless broadband market aggressively in 2021 and now serves more than 5 million residential and business customers. In addition, T-Mobile provides wholesale services to resellers.
Following our analysis of the options activities associated with T-Mobile US, we pivot to a closer look at the company's own performance.
Present Market Standing of T-Mobile US
- With a volume of 1,243,754, the price of TMUS is up 0.92% at $247.18.
- RSI indicators hint that the underlying stock may be overbought.
- Next earnings are expected to be released in 57 days.
What Analysts Are Saying About T-Mobile US
1 market experts have recently issued ratings for this stock, with a consensus target price of $239.0.
Unusual Options Activity Detected: Smart Money on the Move
Benzinga Edge's Unusual Options board spots potential market movers before they happen. See what positions big money is taking on your favorite stocks. Click here for access. * Consistent in their evaluation, an analyst from Morgan Stanley keeps a Overweight rating on T-Mobile US with a target price of $239.
Trading options involves greater risks but also offers the potential for higher profits. Savvy traders mitigate these risks through ongoing education, strategic trade adjustments, utilizing various indicators, and staying attuned to market dynamics. Keep up with the latest options trades for T-Mobile US with Benzinga Pro for real-time alerts.
© 2024 Benzinga.com. Benzinga does not provide investment advice. All rights reserved.


